Hyperfine Clock Transitions of Bismuth Donors in Silicon Detected by Spin Dependent Recombination
Abstract
Bismuth donors ion-implanted in 28Si and Si are studied using magnetic resonance spectroscopy based on spin dependent recombination. The hyperfine clock transition, at which the linewidth is significantly narrowed, is observed for the bismuth donors. The experimental results are modeled quantitatively by molecular orbital theory for a coupled pair consisting of a bismuth donor and a spin dependent recombination readout center, including the effect of hyperfine and Zeeman interactions.
I Introduction
Among a variety of physical systems investigated for quantum information processing, superconducting qubits are one of the promising candidates as quantum processors because of their fast operation capabilities and their potential for scalability.Devoret and Schoelkopf (2013) However, because of their relatively fast decoherence rate which might be insufficient for maintaining quantum information throughout the course of computation, development of quantum memories that could support the operation of the superconducting processors are desired. Such memory qubits have to be addressable at low magnetic field ( mT for aluminumCochran and Mapother (1958)), since superconducting qubits become unoperable at magnetic fields higher than their critical fields.
Within this context, a bismuth (Bi) donor in silicon (Si) has attracted much attention recently. Its large hyperfine interaction GHz (Ref. Feher, 1959) and the 209Bi nuclear spin give rise to a large zero-field splitting of 7.4 GHz that is comparable to the typical energy splitting between and states of superconducting flux qubits.Chiorescu et al. (2003) Thus, coherent coupling between a Bi spin qubit in Si and a superconducting flux qubit on Si is in principle possible via a microwave photon traveling through a waveguide placed between the two qubits. Morley et al. (2010); George et al. (2010) The proposal to couple Bi in Si with a superconducting qubitGeorge et al. (2010) have triggered extensive fundamental studies of the Bi donor in Si very recently. Starting from the spectroscopic analysis of the electron paramagnetic resonance (EPR),George et al. (2010); Weis et al. (2012) the electron spin relaxation time ,Morley et al. (2010); Belli et al. (2011) decoherence time ,Morley et al. (2010); Belli et al. (2011); Weis et al. (2012); Wolfowicz et al. (2012, 2013) and superhyperfine interaction with nearby 29Si nuclear spins Belli et al. (2011); Balian et al. (2012) were investigated. Moreover, the coherent coupling between the Bi electrons and 209Bi nuclear spinsGeorge et al. (2010) and dynamic nuclear polarization of 209Bi were achieved.Morley et al. (2010); Sekiguchi et al. (2010) Hybrid nuclear-electronic qubits consisting of superpositions of electronic and nuclear spin states have been used to demonstrate five orders of magnitude longer coherence times than the manipulation times.Morley et al. (2013) In order to extend the coherence time of Bi donor electrons, magnetic field-insensitive clock transitions can be used.Wolfowicz et al. (2013); Mohammady et al. (2010); Balian et al. (2012) Also, at low temperatures, the presence of 29Si (=1/2) in naturally available silicon (Si) limits the coherence time of donorsAbe et al. (2010); Witzel et al. (2010) so that the use of isotopically purified 28Si is helpful.Tyryshkin et al. (2012); Steger et al. (2012); Wolfowicz et al. (2013) The fact that most of aforementioned Si:Bi studies were performed in the past three years shows how rapidly developing this field is. However, one aspect that has been scarcely studied is the investigation of Si:Bi at low-fields to enable the coupling to superconducting qubits. In order to fill in this gap, we have shown recently Mortemousque et al. (2012) that magnetic resonance spectroscopy with detection based on spin dependent recombinationLepine (1972) (SDR) allows to manipulate and detect spins at low magnetic fields.
In the present study, using such a capable SDR technique, we perform spectroscopy of bismuth implanted in both Si and isotopically enriched 28Si samples and observe a significant line narrowing at the hyperfine clock transition (HCT), where the transition frequency is insensitive to the change in induced by variations in charge distribution (). While existence of optimal working points (e. g., gate voltages) at which superconducting qubits are immune to the electric charge noise has been demonstrated,Vion et al. (2002) observation of HCT in solid state systems has never been reported to our knowledge. The HCT is different from the conventional clock transition, which is insensitive to magnetic noise (). The conventional clock transitions are routinely employed in the operation of atomic clocksLyons (1952); Kusch (1949) utilizing 133Cs and trapped ions.Diddams et al. (2001) A similar clock transition of bismuth donors in silicon has been adopted to achieve extremely long donor electron spin coherence time.Wolfowicz et al. (2013) HCT investigated in this study is more involved in the sense that the hyperfine interaction of a donor can be affected by both strain and electric field fluctuations. Away from the HCT point, the interaction of a donor (D) electron with a nearby implantation defect, which is used in SDR spectroscopy as a readout center (R), causes an asymmetric broadening of the spectral line shapes. This interaction is equivalent to an effective electric perturbation. Thus we propose a theoretical model that describes the change of the donor wave function due to the presence of this readout center. This model makes it possible to simulate the SDR spectra and estimate the associated change in the hyperfine interaction. Finally, we compare the line position and the line shape measured by SDR spectroscopy with our calculation and extend the theoretical model for other donors in silicon.
II Experimental observation of the change in hyperfine interaction
II.1 Samples
Two types of samples were employed; a silicon crystal enriched to 99.983% 28Si ( ppm and ppm) with a resistivity cm and a highly resistive ( kcm) float-zone Si. These two substrates were ion-implanted with Bi and are labeled 28Si:Bi and Si:Bi, respectively. The ion implantations were performed at room temperature with the total fluence of cm-2. The implantation energies were 300 and 550 keV with the doses of and cm-2, respectively. These conditions yielded a maximum bismuth concentration of cm-3 (above the solubility limitTrumbore (1960)) in the depth of 90 to 150 nm from the surface. The post-implantation annealing, performed at 650 for 30 min in an evacuated quartz tube, led to an activation efficiencyMarsh et al. (1968); Baron et al. (1969); de Souza and Fichtner (1993); Weis et al. (2012) below , resulting in the Bi donor concentration less than cm-3 (below the metal-insulator transitionAbramof et al. (1997)). This process was designed to maximize the number of D-R pairs, instead of fully activating all the implanted Bi atoms.Studer et al. (2013)
II.2 SDR method
The continuous illumination provided by a 100-W halogen lamp (above band-gap power of 100 mW/cm2 outside the EPR cavity) generated photoexcited electrons in the sample. The capture of photocarriers by the ionized donors of D-R pairs takes place on a time scale of the order of 10 to 100 s for an illumination at 635 nm of 20 mW/cm2 at 5 K.Hoehne et al. (2013) For the phosphorus donor coupled to a dangling bond readout center, the expected recombination time for the antiparallel electron spin pair was typically s whereas for the parallel spin pair, the recombination time ms was much longer.Hoehne et al. (2013) Preliminary time-resolved electrically detected magnetic resonance (EDMR) measurements of Bi-R pairs in Si:Bi showed a dynamics similar to the donor coupled to a dangling bond defect situating at the Si/SiO2 interface even though the readout centers R created by the implantation were situated around 90 nm deep Bi donors. As a consequence, only the parallel spin pairs remained in the steady state under illumination without external induction of the magnetic resonance. Therefore, flipping the donor electron spins by the external magnetic resonance irradiation broke this steady-state constant current situation and decreased the photocurrent by the enhancement of the spin-dependent recombinations.Lepine (1972) Such a change of the sample photoconductivity led to a decrease in the absorption of the microwave electric field by the sample (photocarriers) leading to an enhancement in the factor of the EPR cavity. The defect utilized as a readout center in this study had a factor of measured by the cross-relaxation R()-Bi() (Ref. Mortemousque et al., 2012) but its microstructure was unknown. In our measurement, the sample was placed in the JEOL JES-RE3X X band EPR spectrometer. A small coil placed near the sample within the EPR cavity was used to excite the magnetic resonance. On the other hand, the X-band ( GHz) irradiation and reflection were used for probing the change in the sample conductivity. Since the additional coil near the sample could apply an arbitrary microwave frequency, it was possible to reduce the frequency along with the static magnetic field.Mortemousque et al. (2012) The second derivative of the reflected X-band intensity with respect to the field modulation was recorded as an SDR signal to reduce the broad cyclotron resonance lines and the background change of the sample conductivity during the magnetic field scan. All the SDR measurements were performed at 16 K.
II.3 Experimental results
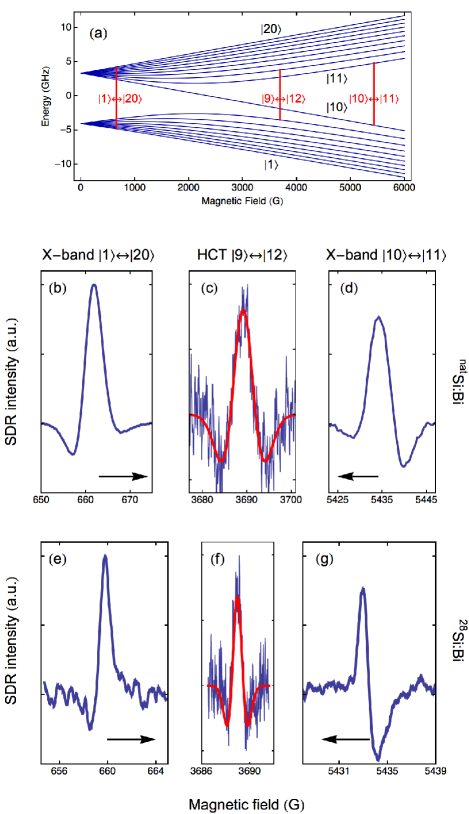
The Bi donor can be modeled by the spin Hamiltonian
| (1) |
where and are the donor electron and nuclear -factors, respectively, and the value of the isotropic hyperfine interaction in units of frequency. We label the -th eigenstate in order of increasing energy as . The Breit-Rabi diagram of the bismuth donor is shown in Fig. 1(a). The Hamiltonian parameters used are summarized in Table 1, together with the ones extracted from the SDR data of this study. The sensitivity of the resonant magnetic field to a parameter for a given resonant frequency is defined as , which satisfies
| (2) |
which leads to . For to be zero, must be zero since when , (Ref. Wolfowicz et al., 2013) so that takes a finite value.
| 28Si:Bi | |||||
| (ppm) | (MHz) | (ppm) | |||
| EPR111Wolfowicz et al. (Ref. Wolfowicz et al., 2013) | 2.00032 | Ref. | 0.9135 | 1475.17 | Ref. |
| SDR222-factor and fitting parameters. | 2.00036(4) | 1475.31(7) | |||
| SDR333-factor determined at HCT9-12, used as fitting parameter | 2.00038(2) | 1475.29(7) | |||
| Si:Bi | |||||
| EPR444Feher (Ref. Feher, 1959)555Morley et al. (Ref. Morley et al., 2010) | 2.0003 | Ref. | 0.914 | 1475.4 | Ref. |
| SDR333-factor determined at HCT9-12, used as fitting parameter | 2.00049(5) | 1475.05(17) | (120) |
Figures 1(bd) and 1(eg) show cw SDR spectra of Si:Bi and 28Si:Bi. The spectra recorded at the Bi donor HCT for (7.3043 GHz for Si:Bi and 7.3054 GHz for 28Si:Bi) between the states and [Figs. 1(c, f)] have a symmetric line shape whereas the X-band spectra of the transition () and the transition (), shown in Figs. 1(b, e) and in Figs. 1(d, g), respectively, are asymmetric. At the HCT, the resonant field sensitivity to the hyperfine value is zero so that one can probe the Si:Bi linewidth and line shape not subject to such electric perturbations. The measured FWHM linewidth of the HCT lines are 6.7 G and 1.3 G for Si:Bi and for 28Si:Bi, respectively. These values are significantly larger than the measured linewidth at X-band of 4.1 G for Si:BiMorley et al. (2010); George et al. (2010) and the theoretical prediction of 0.08 G at the HCT9-12 for 28Si:Bi.Wolfowicz et al. (2012) In contrast, the X-band transitions are asymmetrically broadened (FWHM linewidths of 7.7 G and 1.6 G) toward high field and the transitions toward low field (7.0 G and 1.4 G). dependent asymmetry directions can be described by an (inhomogeneous) distribution of the hyperfine interaction but is inconsistent with any distribution of the Zeeman interaction.
Let us now discuss whether the experimental conditions we employed are sufficient to achieve the intrinsic linewidth and shape of the Bi donor spin transitions. In the duration of a single measurement, the microwave frequency of the EPR spectrometer drifts typically by kHz. The signal generated at 7 GHz by an Agilent 8257D microwave source in series with a 3-W MiniCircuits ZVE-8G+ amplifier exhibits a frequency stability of kHz for the same duration. These fluctuations in the applied microwaves lead to a maximum line broadening of G at 9 GHz and G at 7 GHz, which is negligibly small compared to the estimated G precision in magnetic field and its inhomogeneity.
| Transition | ||||
|---|---|---|---|---|
| (spectrum in Fig. 1) | [G/MHz] | [ G] | [G/MHz] | |
| (b, e) | 0.08 | |||
| (c, f) | 0.06 | |||
| (d, g) | 0.08 |
The asymmetric line broadening of the and transitions is consistent with a distribution of the donor hyperfine interactions with a long tail toward low hyperfine couplings. From the line shapes of the spectra in Figs. 1 (b, d, e and g), the asymmetric part of the line broadening can be estimated roughly 1 G, corresponding to a distribution of the hyperfine constant toward lower values by 3 MHz. We can exclude the distribution in the donor -factor as a cause of this asymmetric broadening, because the sensitivity is negative for both transitions so that the broadening for both and transitions would be in the same direction. The spin exchange interaction (Ref. Cox et al., 1978) between the two electrons of the SDR pair can also be ruled out as it would yield a symmetric line broadening for low enough couplings, estimated by Lu et al.Lu et al. (2011) to be below 5 MHz for phosphorus donor coupled to a surface dangling bond (31PP) and below 10 kHz for separations larger than one donor Bohr radius .Suckert et al. (2013) The values of , and corresponding to each spectrum in Fig. 1 are summarized in Table 2.
Other possible causes for the observed asymmetric broadening would be the strain induced by the implantation damage that was not recovered fully by the post-implantation annealing process.Kimura et al. (1993) For shallow donors (P, As, Sb) in silicon, Wilson and FeherWilson and Feher (1961) and Dreher et al.Dreher et al. (2011) have shown that uniaxial macroscopic strain decreases the hyperfine interaction mainly through the valley repopulation of the ground-state Bloch function. Recently, Dreher (Ref. Dreher, 2013) has shown that, despite the fact that Bi has a large electron binding energy of 71 meV, the strain decreases its hyperfine interaction in the manner similar to other shallow donors. However, the effective hyperfine of the Bi donors in 28Si, obtained from the peak positions in the SDR spectra, is ppm higher than the reported value for EPR measurements.Wolfowicz et al. (2013) Thus the macroscopic strain cannot account for the observed positive shift in effective hyperfine interaction. In fact, the positive shift suggests that orbitals of the donor and the readout center electrons are coupled and their densities are redistributed. In this study, we thus describe the SDR pair in terms of a model based on the coupling between the electron orbitals of the pair in this study.
III Calculation of the line shape with the SDR model
One Bi donor electron and one readout center electron form a spin pair. In section III.1, we introduce a theoretical model to describe this electron pair. Then, we evaluate the effect of the readout center on the donor hyperfine properties (section III.2) and we discuss the influence of the model parameters on the line shape (section III.3).
III.1 wave function of the donor-readout center pair
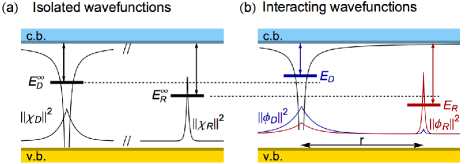
The one-electron molecular orbitals corresponding to the neutral donor in the presence of an ionized readout center (D0-R+) and to a neutral readout center close to an ionized donor (D+-R0) are denoted by and , respectively. In a simplified picture, and can be expressed as a linear combination of the wave functions of the electron of an isolated donor and an isolated center so that and . The linear coefficients and are calculated by applying the variational method to the one-electron Hamiltonian where is the effective kinetic energy of the electron, is the screened Coulomb potential of the donor, and is the effective potential of the readout center. The difference in energy between these molecular states and the isolated states is small, even for a small spatial separation. This is due to the significant difference in the two orbitals and . The electron densities and are plotted in Fig. 2(a), and those of the one-electron molecular orbitals and in Fig. 2(b).
Antisymmetrized wave functions of the two-electron system, including the spin part, are constructed using the Slater determinant of the one-electron molecular orbitals:
| (3a) | ||||
| (3b) | ||||
| (3c) | ||||
| (3d) | ||||
In the above, the spin states are denoted as with and the orbital products of the correspond, from left to right, to the first and the second electrons of the system. One notices that the spin singlet state (triplet ) behaves like a bonding (antibonding) orbital. Note that these states correspond to the charge states DR-, DR0 (=0), DR0 (=1) and DR+, respectively.
Furthermore, the charge repulsion can be included. The corrected two-electron molecular orbitals are then written as linear combinations of . Thus, the bonding orbital is , where the coefficients are and . Then, assuming a negatively charged donor (D-) with an energy , the coefficient tends to zero and the contribution of to can be neglected. It follows that
| (4) |
In the coefficient , the term can be approximated as where is the two-electron correlation energy taken as the Coulomb repulsion of the electrons in the R- state. In this model, is included in the parameter . On the other hand, the antibonding spin triplet state does not mix with either of the spin singlet states , i. e., we have .
III.2 Change in hyperfine interaction
The Fermi hyperfine interaction for the two electrons is
| (5) |
where is the one-electron density at the bismuth nucleus. The electron magnetic dipolar moment depends on the electron orbital function. As the two-electron orbitals can be expressed as functions of and , only two operators and are relevant, where and are the -factors of the isolated donor and readout center electrons, respectively. In order to simulate the SDR line shape, we only consider the change in the electron distribution while assuming the -factor of the isolated centers. However, due to the confined nature of the readout center, only the component has a significant electron density at the bismuth nucleus. Then, in the rest of this section, the subscript of is dropped.
Now, if one considers the hyperfine interaction for a given spin projection of the readout center, one finds that
| (6) |
| (7) |
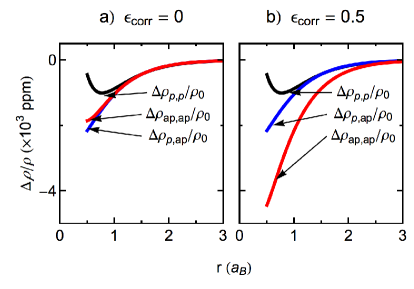
where each on the right-hand side is a block matrix of dimension , calculated using the electron density with subscripts indicating the parallel and antiparallel electron spin configurations: , and . On the other hand, the off-diagonal blocks for give a contribution only at the second and higher orders, which are neglected in this model. The simulation of the fractional change in the electron density at the donor nucleus was performed using a single exponential envelope function characterized by the Bohr radius Å for the Bi donor electron and a Dirac function for the readout center. is plotted in Fig. 3 for a readout center energy of eV, and repulsion energy parameters (a) and (b). One notices that a large repulsion energy parameter decreases the hyperfine interaction for the electron spin pair in the triplet configuration.
III.3 SDR model parameters
The present model contains three physical parameters for a given donor in silicon: the concentration of readout centers , and two parameters and related to the energy levels of the readout center. In order to discuss the effect of the model parameters on the spectral line shapes, it is required to know how much each SDR pair contributes to the detected SDR signal as a function of the pair separation distance.
Among all the readout centers interacting with a donor, we assume that the closest one exclusively forms the most efficient recombination pair. Then, in the ensemble measurement, each donor has a different separation to the nearest readout center and, therefore, a different recombination time in the anti-parallel spin configuration, . However is much shorter than the pair creation time , i. e., , the signal intensity from a single D-R pair is determined by the electron capture time and thus independent of in cw SDR measurements. Then, the total intensity from an ensemble of D-R pairs should be determined directly by the distribution function of the D-R separation . Here we identify the concentration of the pair having the pair separation as follows.
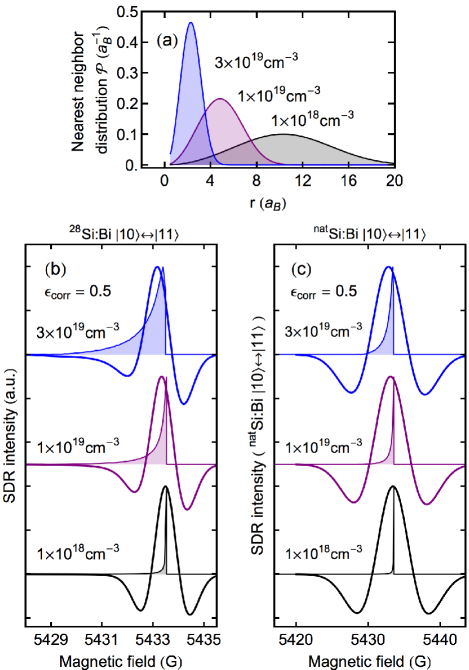
First, we assume that the SDR intensity is proportional to the probability of a Bi donor to find the nearest readout center at a distance between and . This distribution can be written asHertz (1909)
| (8) |
where is the average distance between the readout center and its nearest neighbor. Such distributions are plotted in Fig. 4(a), as a function of in the unit of , for three different concentrations of the readout centers. By combining Eq. (8) with the dependence of the hyperfine on the D-R separation obtained in section III.2, the distribution in resonant magnetic field for the transition is calculated and shown by thin curves in Figs. 4 (b, c). Since the peak for each should be accompanied by a symmetric broadening due to inhomogeneous distribution of 29Si nuclear spins in Si:Bi and of other Bi-donor and readout-center electron spins in 28Si:Bi [as observed in Figs. 1(c) and 1(f)], the thin curves are convoluted with the second derivative of a Gaussian function to simulate the SDR spectra. The simulated spectra are shown as the thick curves in the same figures.
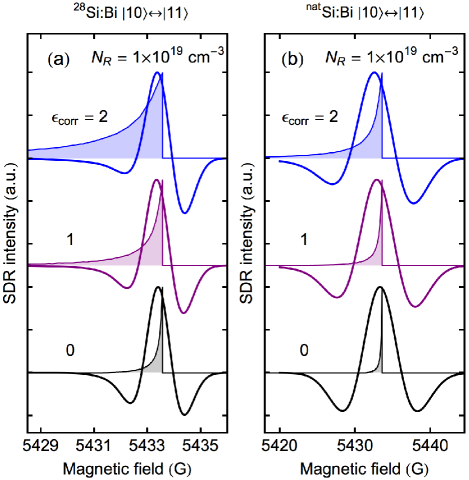
The mixing of atomic orbitals in the present model is assumed to be driven by the long range Coulomb potential of the ionized donor, and the readout center energy is set at eV from the silicon conduction band. The remaining parameter of this model is the two-electron correlation parameter defined in section III.1. It characterizes the mixing of the two-electron molecular orbitals in the spin singlet configuration . The dependence on of the resonant magnetic field is plotted in Fig. 5 for the transition.
IV Comparison of experimental results and simulations
IV.1 Line position
At low magnetic field that we employed, the line positions are determined by the two parameters, and . In section III, we have shown the dependence of the resonant field on the electron density at the donor nucleus, , through the hyperfine interaction. The donor electron -factor further influences the line positions through both the Zeeman and the hyperfine [Eq. (5)] interactions. Because the resonant magnetic field of the HCT9-12 is robust against fluctuations in hyperfine , it allows a precise determination of the -factor of the donor electron. We measured an effective shift in the donor electron -factor of ppm in 28Si:Bi (see Table 1), which can be qualitatively explained by the second order perturbation theory as follows. For a donor electron non interacting with any readout center, the deviation from the free electron -factor resulting from the spin-orbit coupling is given by:
| (9) |
where are eigenvalues of the Hamiltonian and with the free electron -factor, and the spin-orbit coupling parameter. Here the electron ground state is an eigenstate of , neglecting the readout center potential . However, as shown in section III.1, the electron wave function is modified due to the presence of the readout center. Therefore, the -factor correction of the donor electron in an SDR pair is where and are the spin-orbit corrections of the isolated donor and readout center, respectively, and are defined in section III.1. Since the -factor of the isolated readout center (Ref. Mortemousque et al., 2012) is larger than the -factor of the isolated donor (see Table 1), the weighted average must satisfy . This qualitatively explains the larger effective -factor of the donor in an SDR pair . Moreover, since the hyperfine interaction is proportional to the donor -factor [Eq. (5)], the positive change of ppm in -factor measured in the SDR spectroscopy of 28Si:Bi can be partly accounted for by the increase in effective hyperfine interaction of ppm. On the other hand, the linewidth of a transition in Si:Bi is much larger than in 28Si:Bi due to the inhomogeneous hyperfine interaction with the 29Si nuclear spins. Therefore, the line position where the SDR intensity has a maximum, is shifted toward the mean of the resonant field distribution, away from its maximum (see Fig. 4 and 5). Thus, the decrease in effective hyperfine of ppm for Si:Bi is attributed to a combination of the line asymmetry from the distribution in resonant magnetic field and of the broad linewidth from the inhomogeneous broadening.
The excitation frequency of the HCT9-12 (Fig. 1) has been determined using the reference values of the donor electron -factor (Table 1). However, the measured by SDR spectroscopy is different from . The resulting deviations in resonant field HCT HCT are G for 28Si:Bi and G for Si:Bi. As a consequence, the spectra of Figs. 1(b) and 1(e) are not exactly at the HCT, and the sensitivity is finite: G/MHz for 28Si:Bi and G/MHz for Si:Bi. Nevertheless, the line broadening due to these finite sensitivities is much smaller than the magnetic field inhomogeneity and cannot be detected.
IV.2 Line shape
The experimental and simulated line shapes can be quantitatively compared in terms of moments defined as:
| (10) |
where is the normalized signal intensity and is the mean field for this spectrum. The degree of broadening and asymmetry can be represented by the variance and skewness . The simulated values of and for 28Si:Bi are plotted as functions of and in Figs. 6(a) and 6(b), respectively. The experimental variance and skewness are, G2 and for the spin transition in 28Si:Bi. These are represented by the red surfaces in Figs. 6(a) and 6(b). The experimental uncertainties come mainly from a large background after the double-integration of the SDR signal, which is recorded as the second derivative of the sample photoconductivity, necessary for the intensity in Eq. (10) to evaluate the moments. The intersection in Fig. 6(c) represents the corresponding values for the correlation parameter and the readout center concentration: = 1 and cm-3. Such a high readout center concentration is consistent with the high damage cross-section for energetic bismuth ions and the limited recovery of the crystallinity by the annealing process. The two-electron correlation parameter = 1 obtained in this study is equal to the one estimated for 31P-P (, Ref. Poindexter et al., 1984), which confirms the localized wave function of the readout center.
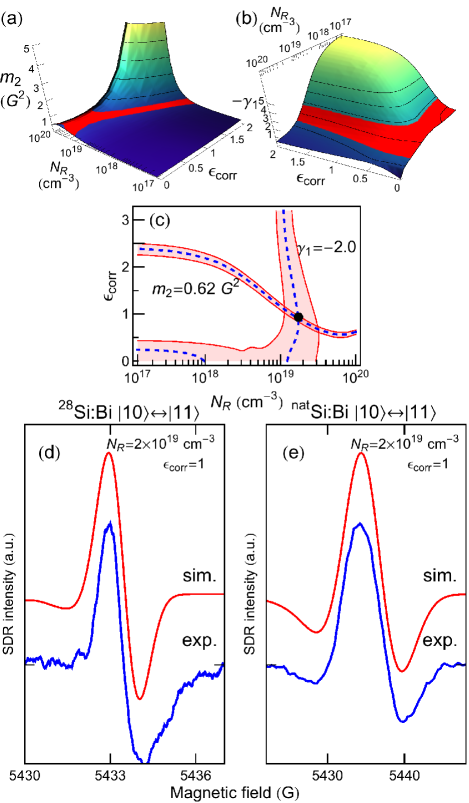
For these numerical simulations, we used the experimental linewidth of 28Si:Bi (1.3 G) measured at HCT9-12. This rather large linewidth can be explained by the dipole-dipole interaction of the donor and the readout center electron spins for a concentration cm-3. Moreover, one can expect a spectral line broadening due to the distribution in the donor electron -factor. Assuming that this distribution covers a range of ppm around for Si:Bi (see Table 1), the broadening in the line FWHM, induced by the finite sensitivity (see Table II) at the HCT, should be G. As a consequence, the distribution in the donor electron -factor is negligible for Si:Bi and the FWHM linewidth of the Gaussian for the transition is 5.7 G. For 28Si:Bi however, even a smaller distribution of ppm in -factor is responsible for 0.1 G linewidth broadening (more than 10% of the linewidth measured at the HCT9-12). The 0.1 G contribution of the -factor distribution to the linewidth is multiplied by the sensitivity ratio . Thus, the Gaussian linewidth to be used in the simulations for 28Si:Bi is 1.35 G. It can be noted that for close pairs (), the strong exchange interactionSuckert et al. (2013) can be neglected since the corresponding SDR intensity for cm-3 is below 0.1 % of the total SDR intensity. The above mentioned linewidths together with the and parameters calculated for 28Si:Bi lead to the simulated spectra shown in Fig. 6(d) for 28Si:Bi and (e) for Si:Bi. The experimental spectra are also shown below the simulations. The line shapes of the transition for both 28Si:Bi and Si:Bi samples are well reproduced. This demonstrates the validity of the presented molecular model for the SDR detection of donors for a wide range of host isotope composition.
Before concluding this section, we would like to point out the work of Morishita et al.Morishita et al. (2011) in which the spectroscopy of 28Si:P was performed using low-field electrically detected magnetic resonance (LFEDMR), a technique similar to SDR. In this work, the authors compared the linewidth of 28Si:P probed by LFEDMR at 160 MHz and by EPR at 9 GHz. No difference in the linewidth ( G) for the transition was observed and the authors concluded that the interaction of the phosphorus donor with the readout center is strong enough to allow the recombination process, but weak enough not to alter the transition linewidth. Yet, the hyperfine structure of the phosphorus donor is only 117 MHz so that its maximum change due to the interaction with the readout center is times smaller for phosphorus than for bismuth. Moreover, the small phosphorus nuclear spin makes the sensitivity relatively small: G/MHz at 160 MHz for the . Thus, the effect of the phosphorus donor interaction with its readout center on the magnetic resonance is below the detection limit and the conclusions of Morishita do not contradict the present analysis.
V Hyperfine clock transitions for other group-V donors in silicon
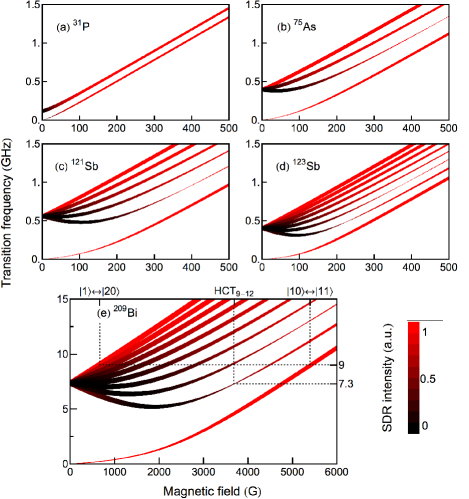
There is no HCT in the EPR transitions of phosphorus donors in silicon. Other group-V donors have HCT. At such points, as discussed in section IV.1, the contribution of the -factor distribution to the linewidth can be evaluated knowing the intrinsic EPR linewidth and extrapolated for an arbitrary transition. In fact, since the broadening due to the distribution in hyperfine (electron density at the donor nucleus) scales with , the contribution to the linewidth calculated in this paper can be extrapolated for any points. The values of for EPR-allowed transitions of group-V donors in silicon (31P, 75As, 121Sb, 123Sb and 209Bi) are plotted as the line thickness in Fig. 7. One can notice that for a given EPR transition, the high-field limit of is exactly and, as a consequence, the field sensitivity to the hyperfine interaction is simply written as
| (11) |
Also no polarization of the donor spins is required for SDR spectroscopy; only parallel spin pairs remain in the steady state under illumination. However, at low magnetic field, the donor eigenstates are not pure spin states. Thus, for one transition, the fraction of parallel and antiparallel electron spins of an SDR pair modified by magnetic resonance depends on the magnetic field.Mortemousque et al. (2012) With such considerations taken into account, the simulated SDR signal intensity for cw-SDR spectroscopy is plotted by the color scale in Fig. 7.
VI Summary and conclusions
In summary, we have performed the cw SDR spectroscopy of 28Si:Bi and Si:Bi at 9 and 7 GHz and observed a significant SDR line narrowing at the HCT. The theoretical model proposed in this study for the SDR pair electron distribution reproduces the experimentally obtained line shapes very well. By analyzing the line shape at the HCT, we have shown that the main broadening process in 28Si:Bi is the dipole-dipole interaction between the bismuth donor and the surrounding readout centers. Our results illustrate fundamental properties of hyperfine clock transitions and serve as a stepping stone for further investigations of coupling between microwave circuits and donors in silicon.
Acknowledgments
The authors wish to express their appreciation to Martin S. Brandt, Felix Hoehne, and David Franke for fruitful discussions. This work has been supported in part by the JSPS Core-to-Core program, in part by MEXT, and in part by FIRST. S.Berger was supported by a JSPS Fellowship for his stay at Keio University. We also acknowledge the Australian Government’s NCRIS/EIF programs for access to Heavy Ion accelerator Facilities at the Australian National University.
References
- Devoret and Schoelkopf (2013) M. H. Devoret and R. J. Schoelkopf, Science 339, 1169 (2013).
- Cochran and Mapother (1958) J. F. Cochran and D. E. Mapother, Phys. Rev. 111, 133 (1958).
- Feher (1959) G. Feher, Phys. Rev. 114, 1219 (1959).
- Chiorescu et al. (2003) I. Chiorescu, Y. Nakamura, C. Harmans, and J. E. Mooij, Science 299, 1869 (2003).
- Morley et al. (2010) G. W. Morley, M. Warner, A. M. Stoneham, P. T. Greenland, J. van Tol, C. W. M. Kay, and G. Aeppli, Nat. Mater. 9, 725 (2010).
- George et al. (2010) R. E. George, W. Witzel, H. Riemann, N. V. Abrosimov, N. Noetzel, M. L. W. Thewalt, and J. J. L. Morton, Phys. Rev. Lett. 105, 067601 (2010).
- Weis et al. (2012) C. D. Weis, C. C. Lo, V. Lang, A. M. Tyryshkin, R. E. George, K. M. Yu, J. Bokor, S. A. Lyon, J. J. L. Morton, and T. Schenkel, Appl. Phys. Lett. 100, 172104 (2012).
- Belli et al. (2011) M. Belli, M. Fanciulli, and N. V. Abrosimov, Phys. Rev. B 83, 235204 (2011).
- Wolfowicz et al. (2012) G. Wolfowicz, S. Simmons, A. M. Tyryshkin, R. E. George, H. Riemann, N. V. Abrosimov, P. Becker, H. J. Pohl, S. A. Lyon, M. L. W. Thewalt, and J. J. L. Morton, Phys. Rev. B 86, 245301 (2012).
- Wolfowicz et al. (2013) G. Wolfowicz, A. M. Tyryshkin, R. E. George, H. Riemann, N. V. Abrosimov, P. Becker, H. J. Pohl, M. L. W. Thewalt, S. A. Lyon, and J. J. L. Morton, Nat. Nanotechnol. 8, 561 (2013).
- Balian et al. (2012) S. J. Balian, M. B. A. Kunze, M. H. Mohammady, G. W. Morley, W. M. Witzel, C. W. M. Kay, and T. S. Monteiro, Phys. Rev. B 86, 104428 (2012).
- Sekiguchi et al. (2010) T. Sekiguchi, M. Steger, K. Saeedi, M. L. W. Thewalt, H. Riemann, N. V. Abrosimov, and N. Notzel, Phys. Rev. Lett. 104, 137402 (2010).
- Morley et al. (2013) G. W. Morley, P. Lueders, M. H. Mohammady, S. J. Balian, G. Aeppli, C. W. M. Kay, W. M. Witzel, G. Jeschke, and T. S. Monteiro, Nat. Mater. 12, 103 (2013).
- Mohammady et al. (2010) M. H. Mohammady, G. W. Morley, and T. S. Monteiro, Phys. Rev. Lett. 105, 067602 (2010).
- Abe et al. (2010) E. Abe, A. M. Tyryshkin, S. Tojo, J. J. L. Morton, W. M. Witzel, A. Fujimoto, J. W. Ager, E. E. Haller, J. Isoya, S. A. Lyon, M. L. W. Thewalt, and K. M. Itoh, Phys. Rev. B 82, 121201 (2010).
- Witzel et al. (2010) W. M. Witzel, M. S. Carroll, A. Morello, L. Cywinski, and S. Das Sarma, Phys. Rev. Lett. 105, 187602 (2010).
- Tyryshkin et al. (2012) A. M. Tyryshkin, S. Tojo, J. J. L. Morton, H. Riemann, N. V. Abrosimov, P. Becker, H. J. Pohl, T. Schenkel, M. L. W. Thewalt, K. M. Itoh, and S. A. Lyon, Nat. Mater. 11, 143 (2012).
- Steger et al. (2012) M. Steger, K. Saeedi, M. L. W. Thewalt, J. J. L. Morton, H. Riemann, N. V. Abrosimov, P. Becker, and H. J. Pohl, Science 336, 1280 (2012).
- Mortemousque et al. (2012) P. A. Mortemousque, T. Sekiguchi, C. Culan, M. P. Vlasenko, R. G. Elliman, L. S. Vlasenko, and K. M. Itoh, Appl. Phys. Lett. 101, 082409 (2012).
- Lepine (1972) D. J. Lepine, Phys. Rev. B 6, 436 (1972).
- Vion et al. (2002) D. Vion, A. Aassime, A. Cottet, P. Joyez, H. Pothier, C. Urbina, D. Esteve, and M. H. Devoret, Science 296, 886 (2002).
- Lyons (1952) H. Lyons, Ann. New York Acad. Sci 55, 831 (1952).
- Kusch (1949) P. Kusch, Phys. Rev. 76, 161 (1949).
- Diddams et al. (2001) S. A. Diddams, T. Udem, J. C. Bergquist, E. A. Curtis, R. E. Drullinger, L. Hollberg, W. M. Itano, W. D. Lee, C. W. Oates, K. R. Vogel, and D. J. Wineland, Science 293, 825 (2001).
- Trumbore (1960) F. A. Trumbore, Bell Syst. Tech. 39, 205 (1960).
- Marsh et al. (1968) O. J. Marsh, R. Baron, G. A. Shifrin, and J. W. Mayer, Appl. Phys. Lett. 13, 199 (1968).
- Baron et al. (1969) R. Baron, G. A. Shifrin, O. J. Marsh, and J. W. Mayer, J. Appl. Phys. 40, 3702 (1969).
- de Souza and Fichtner (1993) J. P. de Souza and P. F. P. Fichtner, J. Appl. Phys. 74, 119 (1993).
- Abramof et al. (1997) E. Abramof, A. Ferreira da Silva, B. E. Sernelius, J. P. de Sousa, and H. Boudinov, Phys. Rev. B 55, 9584 (1997).
- Studer et al. (2013) P. Studer, S. R. Schofield, C. F. Hirjibehedin, and N. J. Curson, Appl. Phys. Lett. 102, 012107 (2013).
- Hoehne et al. (2013) F. Hoehne, L. Dreher, M. Suckert, D. P. Franke, M. Stutzmann, and M. S. Brandt, Phys. Rev. B 88, 155301 (2013).
- Cox et al. (1978) R. T. Cox, D. Block, A. Herve, R. Picard, C. Santier, and R. Helbig, Solid State Commun. 25, 77 (1978).
- Lu et al. (2011) J. M. Lu, F. Hoehne, A. R. Stegner, L. Dreher, M. Stutzmann, M. S. Brandt, and H. Huebl, Phys. Rev. B 83, 235201 (2011).
- Suckert et al. (2013) M. Suckert, F. Hoehne, L. Dreher, M. Kuenzl, H. Huebl, M. Stutzmann, and M. S. Brandt, Molecular Physics 111, 2690 (2013).
- Kimura et al. (1993) S. Kimura, H. Ono, T. Ikarashi, and T. Ishikawa, Jpn. J. Appl. Phys. Part 1 - Letters 32, L1074 (1993).
- Wilson and Feher (1961) D. K. Wilson and G. Feher, Phys. Rev. 124, 1068 (1961).
- Dreher et al. (2011) L. Dreher, T. A. Hilker, A. Brandlmaier, S. T. B. Goennenwein, H. Huebl, M. Stutzmann, and M. S. Brandt, Phys. Rev. Lett. 106, 037601 (2011).
- Dreher (2013) L. Dreher, Ph.D. thesis, Technische Universität München, 2013.
- Hertz (1909) P. Hertz, Math. Ann. 67, 387 (1909).
- Poindexter et al. (1984) E. H. Poindexter, G. J. Gerardi, M. E. Rueckel, P. J. Caplan, N. M. Johnson, and D. K. Biegelsen, J. Appl. Phys. 56, 2844 (1984).
- Morishita et al. (2011) H. Morishita, E. Abe, W. Akhtar, L. S. Vlasenko, A. Fujimoto, K. Sawano, Y. Shiraki, L. Dreher, H. Riemann, N. V. Abrosimov, P. Becker, H. J. Pohl, M. L. W. Thewalt, M. S. Brandt, and K. M. Itoh, Appl. Phys. Express 4, 021302 (2011).