Probabilistic Model Checking of DTMC Models of User Activity Patterns
Abstract
Software developers cannot always anticipate how users will actually use their software as it may vary from user to user, and even from use to use for an individual user. In order to address questions raised by system developers and evaluators about software usage, we define new probabilistic models that characterise user behaviour, based on activity patterns inferred from actual logged user traces. We encode these new models in a probabilistic model checker and use probabilistic temporal logics to gain insight into software usage. We motivate and illustrate our approach by application to the logged user traces of an iOS app.
1 Introduction
Software developers cannot always anticipate how users will actually use their software, which is sometimes surprising and varies from user to user, and even from use to use, for an individual user. We propose that temporal logic reasoning over formal, probabilistic models of actual logged user traces can aid software developers, evaluators, and users by:
-
•
providing insights into application usage, including differences and similarities between different users,
-
•
predicting user behaviours, and
-
•
recommending future application development.
Our approach is based on systematic and automated logging and reasoning about users of applications. While this paper is focused on mobile applications (apps), much of our work applies to any software system. A logged user trace is a chronological sequence of in-app actions representing how the user explores the app. From logged user traces of a population of users we infer activity patterns, represented each by a discrete-time Markov chain (DTMC), and for each user we infer a user strategy over the activity patterns. For each user we deduce a meta model based on the set of all activity patterns inferred from the population of users and the user strategy, and we call it the user metamodel. We reason about the user metamodel using probabilistic temporal logic properties to express hypotheses about user behaviours and relationships within and between the activity patterns, and to formulate app-specific questions posed by developers and evaluators.
We motivate and illustrate our approach by application to the mobile, multiplayer game Hungry Yoshi [1], which was deployed in 2009 for iPhone devices and has involved thousands of users worldwide. We collaborate with the Hungry Yoshi developers on several mobile apps and we have access to all logged user data. We have chosen the Hungry Yoshi app because its functionality is relatively simple, yet adequate to illustrate how formal analysis can inform app evaluation and development.
The main contributions of the paper are:
-
•
a formal and systematic approach to formal user activity analysis in a probabilistic setting,
-
•
inference of user activity patterns represented as DTMCs,
-
•
definition of the DTMC user metamodel and guidelines for inferring user metamodels from logged user data,
-
•
encoding of the user metamodel in the PRISM model checker and temporal logic properties defined over both states and activity patterns as atomic propositions,
-
•
illustration with a case study of a deployed app with thousands of users and analysis results that reveal insights into real-life app usage.
The paper is organised as follows. In the next section we give an overview of the Hungry Yoshi app, which we use to motivate and illustrate our work. We list some example questions that have been posed by the Yoshi developers and evaluators; while these are specific to the Yoshi app, they are also indicative questions for any app. In Sect. 3 we give background technical definitions concerning DTMCs and probabilistic temporal logics. In Sect. 4 we define inference of user activity patterns, giving a small example as illustration and some example results for Hungry Yoshi. In Sect. 5 we define the user metamodel, we illustrate it for Hungry Yoshi and we give an encoding for the PRISM model checker. In Sect. 6 we consider how to encode some of the questions posed in Sect. 2.1 in probabilistic temporal logic, and give some results for an example Hungry Yoshi user metamodel. In Sect. 7 we reflect upon the results obtained for Hungry Yoshi and some further issues raised by our approach. In Sect. 8 we review related work and we conclude in Sect. 9.
2 Running example: Hungry Yoshi
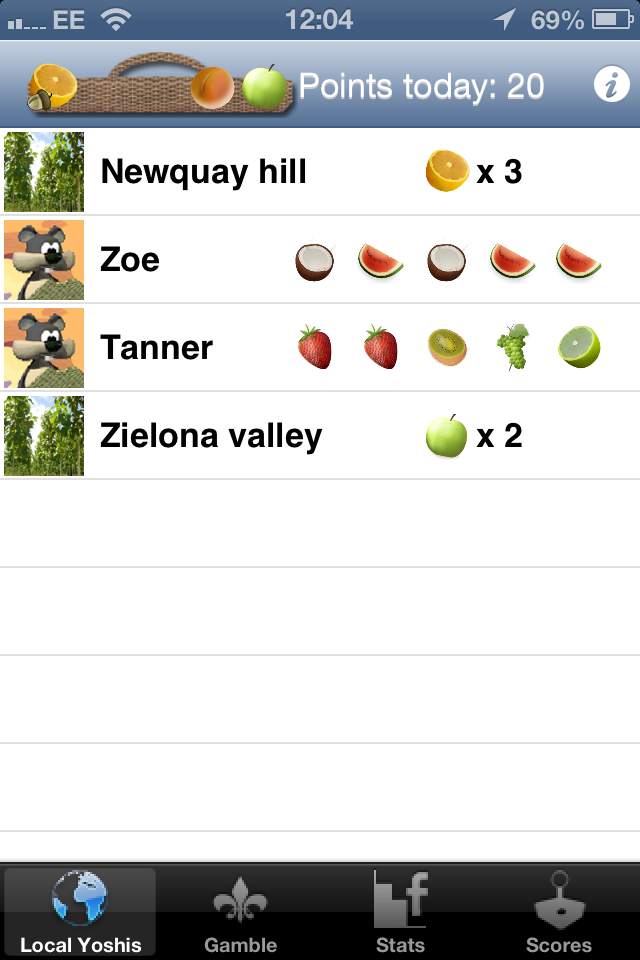
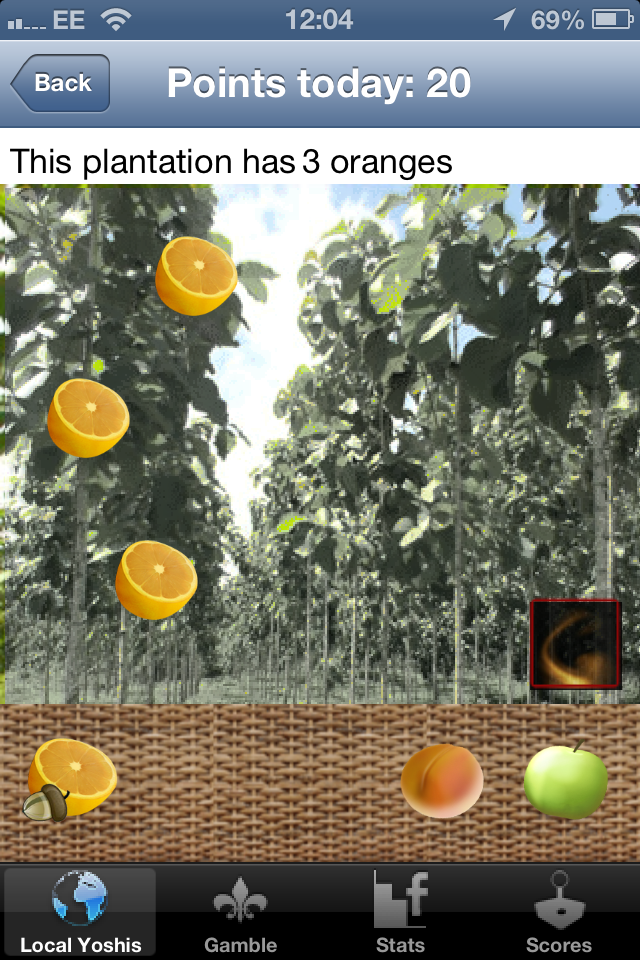
The mobile, multiplayer game Hungry Yoshi [1] is based on picking pieces of fruit and feeding them to creatures called yoshis. Players’ mobile devices regularly scan the available WiFi access points and display a password-protected network as a yoshi and a non-protected network as a fruit plantation. Plantations grow particular types of fruit (possibly from seeds) and yoshis ask players for particular types of fruit. Players score points if they pick the fruit from the correct plantations, store them in a basket, and give them to yoshis as requested. There is further functionality, but here we concentrate on the key user-initiated events, or button taps, which are: see a yoshi, see a plantation, pick fruit and feed a yoshi. The external environment (as scanned by device), combined with user choice, determines when yoshis and plantations can be observed. The game was instrumented by the developers using the SGLog data logging infrastructure [2], which streams logs of specific user system operations back to servers on the developing site as user traces. The developers specify directly in the source code what method calls or contextual information are to be logged by SGLog. A sample of screenshots from the game is shown in Fig. 1.

2.1 Example questions from developers and evaluators
Key to our formal analysis is suitable hypotheses, or questions, about user behaviour. For Hungry Yoshi, we interviewed the developers and evaluators of the game to obtain questions that would provide useful insights for them. Interestingly most of their hypotheses were app-specific, and so we focus on these here, and then indicate how each could be generalised. We note that to date, tools available to the developers and evaluators for analysis include only SQL and iPython stats scripts.
-
1.
When a yoshi has been fed pieces of fruit (which results in extra points when is 5), did the user interleave pick fruit and feed a yoshi times or did the user perform pick fruit events followed by feed a yoshi events? And afterwards, did he/she continue with that pick-feed strategy or change to another one? Which strategy is more likely in which activity pattern? More generally, when there are several ways to reach a goal state, does the user always take a particular route and is this dependent on the activity pattern?
-
2.
If a user in one activity pattern does not feed a yoshi within button taps, but then changes to another activity pattern, is the user then likely to feed a yoshi within button taps? More generally, which events cause a change of activity pattern, and which events follow that change of activity pattern?
-
3.
What kind of user tries to pick fruit times in a row (a basket can only hold pieces of fruit)? More generally, in which activity pattern is a user more likely to perform an inappropriate event?
-
4.
If a user reads the instructions once, then does that user reach a goal state in fewer steps than a user who does not read the instructions at all? (Thus indicating the instructions are of some utility.) More generally, if a user performs a given event, then it is more likely that he/she will perform another given event, within button taps, than users that have not performed the first event? Is this affected by the activity pattern?
3 Technical Background
We assume familiarity with Discrete-Time Markov Chains, probabilistic logics PCTL and PCTL*, and model checking [3, 4]; basic definitions are below.
A discrete-time Markov chain (DTMC) is a tuple where: is a set of states; is the initial state; is the transition probability function (or matrix) such that for all states we have ; and is a labelling function associating to each state in a set of valid atomic propositions from a set . A path (or execution) of a DTMC is a non-empty sequence where and for all . A path can be finite or infinite. Let denote the set of all infinite paths of starting in state .
Probabilistic Computation Tree Logic (PCTL) [3] and its extension PCTL* allow one to express a probability measure of the satisfaction of a temporal property. Their syntax is the following:
| State formulae | |
|---|---|
| PCTL Path formulae | |
| PCTL* Path formulae |
where ranges over a set of atomic propositions , , , and .
A state in a DTMC satisfies an atomic proposition if . A state satisfies a state formula , written , if the probability of taking a path starting from and satisfying meets the bound , i.e., , where is the probability measure defined over paths from state . The path formula is true on a path starting with if is satisfied in the state following ; is true on a path if holds in the state at some time step and at all preceding states holds. This is a minimal set of operators, the propositional operators , disjunction and implication can be derived using basic logical equivalences and a common derived path operators is the eventually operator where . If then superscripts omitted.
We assume the following two additional notations. Let denote the state formulae from the propositional logic fragment of PCTL, i.e., , where . Let denote the DTMC obtained from by restricting the set of states to those satisfying .
Many of the properties we will examine require PCTL*, because we want to examine sequences of events: this requires multiple occurrences of a bounded until operator. This is not fully implemented in the current version of PRISM (only a single bounded is permitted111Because currently the LTL-to-automata translator that PRISM uses does not support bounded properties.) and so we combine probabilities obtained from PRISM filtered properties to achieve the same result. Filtered probabilities check for properties that hold from sets of states satisfying given propositions. For a DTMC , we define the filtered probability of taking all paths that start from any state satisfying and satisfy (PCTL) by:
where is an operator on the probabilities of for all the states satisfying . In the examples illustrated in this paper we always apply the function as the filter operator. If uniquely identifies a state, then the filters , , give the same result, and so we omit the filter from formulae.
4 Inferring User Activity Patterns
The role of inference is to construct a representation of the data that is amenable to checking probabilistic temporal logic properties. Developers want to be able to select a user and explore that user’s model. While this could be achieved by constructing an independent DTMC for each user, there is much to be gained from sharing information between users. One way to do this is to construct a set of user classes based on attribute information, and to learn a DTMC for each class. This is the approach taken in [5] for users interacting with web applications, and is a natural way to aggregate information over users and to condition user-models on attribute values. One issue with this approach is that it assumes within-class use to be homogeneous. For example, all users in the same city using the same browser are modelled using the same DTMC.
In this work we take a different approach to inference. We construct user models based on the log information alone, without any ad-hoc specification of user classes. One reason for doing this is that we have found the common representations of context - such as location, operating system, or time of day - to be poor predictors of mobile application use. We would like to be able to construct user classes based on more sophisticated representations of context, such as a user’s level of development or engagement in the app, or their tendency to particular activity patterns. By letting the data speak for itself, we hope to uncover interesting activity patterns and meaningful representations of users.
4.1 Probabilistic model and inference
We extend the standard DTMC model by introducing a strategy for each user over activity patterns. More formally, we assume there exists a finite number of activity patterns, each modelled by a DTMC denoted , for . Note only the transition probability varies over the set of DTMCs, all the other parameters are the same. For some enumeration of users , we represent a user’s strategy by a vector such that denotes the probability that user transitions according to the DTMC indexed by . We assume all DTMCs are available to all users at all points in time.
The data for each user is assumed to be generated in the following iterative way. An initial state is chosen according to . When in state , user selects the th DTMC with probability . If the user chooses the th DTMC, then they transition from state to with probability . It is assumed that each user is independent from all other users. This simple description specifies all the probabilistic dependencies in our statistical model. The power of this model is that it represents users as mixtures of activity patterns, and enables us to examine users in the low dimensional space of .
While there are many ways to infer the parameters of this model, we choose simply to find the parameters that make the data most likely. This requires us to use the expectation-maximisation (EM) algorithm of [6]. The EM algorithm involves optimising a non-linear objective and, to remedy this, we restart the algorithm multiple times and use the optimal parameters over all restarts.
4.2 Example activity patterns from Hungry Yoshi
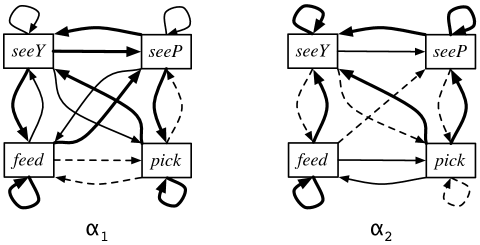
In Fig. 2 we give the activity patterns, inferred from a dataset of user traces for 164 users randomly selected from the user population, for . A more detailed overview is given in the work-in-progress paper [7]. For brevity, we do not include the exact values of and , but thicker arcs correspond to transition probabilities greater than , thinner ones to transition probabilities in , and dashed ones to transition probabilities smaller than . Intuitively, we can see that given the game is essentially about seeing yoshis and feeding them, looks like a better way for playing the game. For example in it is quite rare to reach feed from seeY and seeP, and also rare to move from seeP to pick. Hungry Yoshi is a simple app with only two distinctive activity patterns, in a more complex setting we might not be able to have any intuition about the activity patterns.
5 User Metamodel
We define the formal model of the behaviour of a user with respect to the population of users, which we call the user metamodel (UMM). The UMM for user is a DTMC where at each time step the user either follows the current activity pattern with probability and makes a move according to or selects a different activity pattern with probability and then makes a move according to . Basically, we compose the DTMCs modelling the user activity patterns using the strategy .
Definition 1 (User Metamodel)
Given activity patterns and the strategy of user for choosing activity patterns, the user metamodel for is a DTMC where:
-
•
,
-
•
,
-
•
,
-
•
.
We label each state with the atomic proposition to denote that the state belongs to the activity pattern .
5.1 Example UMM from Hungry Yoshi
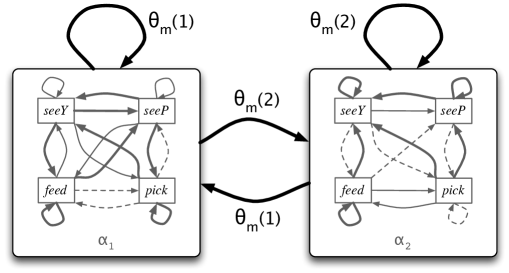
An intuitive graphical description of the UMM for the Hungry Yoshi game for is illustrated in Fig. 3. For example, is the probability that user continues with activity pattern , i.e. takes a transition between states in . The probability that the user changes the activity pattern and makes a transition according to is proportional to . Figure 3 is not a direct representation of the transition probability matrix of the UMM DTMC, but it illustrates how that matrix is derived from the matrices of the individual user activity patterns. Note that the activity patterns have the same sets of states. For instance, in the Hungry Yoshi example, consider we are in state with ; we can move to state following the same pattern with the probability , or we can change the activity pattern and move to state following with the probability .
5.2 Encoding a UMM in PRISM
We use the probabilistic model checker PRISM [8]. We assume some familiarity with the modelling language (based on the language of reactive modules), which includes global variables, modules with local variables, labelled-commands corresponding to transitions and multiway synchronisation of modules. In Fig. 4 we illustrate the PRISM encoding of the UMM for user . The representation is straightforward, consisting of one module with commands for all states of any activity pattern and for one (dummy) initial state. The initial state is a dummy that encodes the global initial distribution for the user activity patterns. All activity patterns have the same set of states and we enumerate them from to ; we can label them conveniently with atomic propositions. For instance, in a Hungry Yoshi UMM the states to are labelled by the atomic proposition , , , , respectively. For each state , with , we have a command defining all possible probabilistic transitions. If the probability of an update is null, then the corresponding update, i.e., transition, does not take place.
6 Analysing the Hungry Yoshi UMM
In this section, we give some example analysis for a UMM. Namely, we encode and evaluate quantitatively several example questions from Sect. 2.1 for the UMM with the strategy for transitioning between activity patterns defined by . The PRISM models and property files are freely available222Available from http://dcs.gla.ac.uk/~oandrei/yoshi ..
Recall that to score highly, a user must feed one or more yoshis (the appropriate fruit) often. An informal inspection of and indicates that is a less effective strategy for playing the game, since paths from and to are unlikely. Now, by formal inspection of the UMM (encoded in PRISM), we can investigate this hypothesis more rigorously. We consider properties that are parametrised by a number of button taps (e.g. , , ) and by activity pattern (e.g. , ), so we use the PRISM experiment facility that allows us to evaluate and then plot graphically results for a range of formulae.
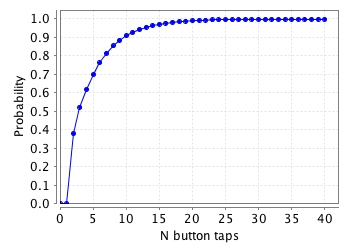
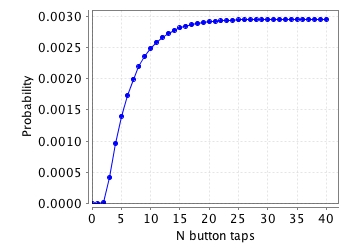
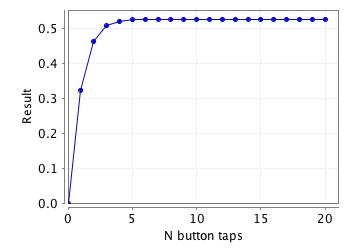
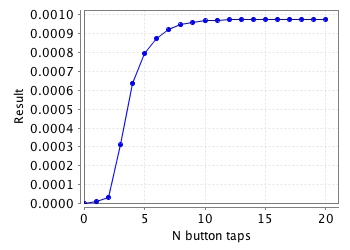
Question 6.
How many button taps does it take to feed a yoshi for the first time? We encode this by the probabilistic until formula:
For activity pattern , Figure 5 shows that within 2 button taps the probability increases rapidly, and after 5 button taps the probability is more than . Contrast this with the results for : the probability increases rapidly after 3 button taps but soon it reaches the upper bound of 0.003. Comparing the two results, is clearly more effective.
Now we consider more complex questions concerning sequences of feeding and picking; recall that a basket can hold at most 5 fruits and extra points are gained by feeding a yoshi its required 5 fruits without any other interruption. In Question 6 we consider feeding a full basket to a yoshi, without being interrupted by a (note, we allow and ); in Question 6 we consider picking a full basket, without being interrupted by a , followed by feeding the full basket to a yoshi, without being interrupted by a (again, we allow and ).
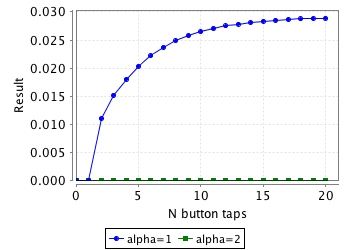
Question 6.
We calculate the probability of reaching the state within button taps and then visiting it (with the same activity pattern) for another four times without visiting the state , for each activity pattern ():
As example, in this case we also give the corresponding PRISM formula:
P=?[F<=N((alpha=i)&"feed")]*
pow(filter(min,P=?[X(((alpha=i)&(!"pick")&(!"feed"))U((alpha=i)&"feed"))],
           ((alpha=i)&"feed")),4)
The results are shown in Fig. 7 for both activity patterns and a range of number of button taps. While the results for (converging to 0.03) are higher than for (effectively 0); they are both small. There could be several causes for this. For example, players are only made aware of the possibility of extra points at the end of the instructions pages, or available fruit depends on the external environment. If designers/evaluators want this investigated further, then we would require to record and extract more detail from the logs, for example to log numbers of available WiFi access points and scrolls through instruction pages.
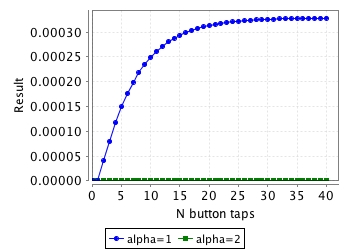
Question 6.
We calculate the probability of reaching the state only after visiting the state five times (without feeding) and then visiting the state four more times (without picking), for each activity pattern:
The results are presented in Fig. 7. Again, while the probabilities are low (presumably for the reasons outlined above for Question 6) the user that picks a full basket and feeds it to a yoshi by following activity pattern does it with around 0.0003 probability within 15 steps into the game, whereas if they follow from the beginning, they never empty the basket. So again, proves to be more effective.
Now we turn our attention to a question that involves a change of activity pattern, i.e. a change in the playing strategy.
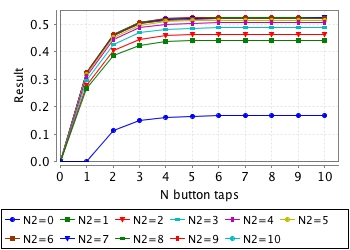
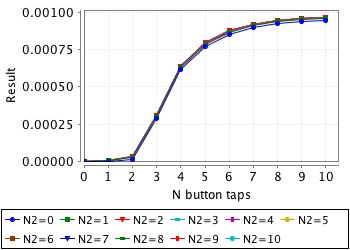
Question 6.
What is the probability of starting with an activity pattern and not feeding a yoshi within button taps, then changing to the other activity pattern and eventually first feeding a yoshi within button taps? We compute this probability as follows, where :
Figure 8 shows the results for switching from activity patterns to and vice-versa respectively for less than 10 button taps to feed a yoshi after switching the activity pattern, while Figure 9 shows the same but for an unbounded number of button taps (to feed a yoshi). We can see that success is much more likely by switching from to , than switching from to , and a user needs about 4-5 button taps to switch from to to maximise their score. This latter result is not surprising, considering that users might first inspect the game, which would involve visiting the 4 states.
All analyses were performed on a standard laptop. Note that for brevity, the mobile app analysed here, and its formal model, are relatively small in size; more complex applications will yield more meaningful activity patterns and complex logic properties that can be analysed on the metamodels. While state-space explosion of the UMM could be an issue, it is important to note that the state-space does not depend on the number of users, but on the granularity of the states (logged in-app actions) we distinguish.
7 Discussion
We reflect upon the results obtained for the Hungry Yoshi example and further issues raised by our approach.
Hungry Yoshi usage.
Our analysis has revealed some insight into how users have actually played the game: corresponds to a more successful game playing strategy than and a user is much more likely to be effective if they change from to (rather than vice-versa), thus we conclude that is expert behaviour and is ineffective behaviour. (Note that users can, and do, switch between both behaviours, e.g. a user who exhibits expert behaviour can still exhibit ineffective behaviour at some later time.) This interpretation of activity patterns can inform a future redesign that helps users move from ineffective to expert behaviour, or induces explicitly populations of users to follow selected computation paths to reach certain goal states. We note that the developers had very little intuition about how often, or if, users were picking a full basket and then feeding a yoshi (e.g. Questions 6 and 6 in Sect. 6), and so the results, which indicate this scenario is quite rare, provided a new and useful insight for them.
Temporal properties.
The properties refer to propositions about user-initiated events (e.g. seeY, feed) and activity patterns (e.g. , ). A future improvement would be a syntax that parametrises the temporal operators by activity pattern. We note that PCTL properties alone were insufficient for our analysis and we have made extensive use of filtered properties. We also note that for some properties we have used PRISM rewards, e.g. to compare scores between activity patterns, but these are omitted in this short paper.
Reasoning about users.
Model checking is performed on the UMM resulting from the augmentation of the set of activity patterns with a strategy . It is simple to select a user by selecting a and to analyse the resulting UMM. Metrics on the set will be used in future work to characterise how the results of the analysis change depending on the value of one , in the hope that results of the analysis for one user can be generalised to users close by (under the given metric).
Formulating hypotheses: domain specific and generic.
We have considered domain-specific hypotheses presented by developers and evaluators, but could a formal approach help with hypothesis generation? For example, we could frame questions using the specifications patterns for probabilistic quality properties as defined in [9] (probabilistic response, probabilistic precedence, etc.). Referring to our questions in Sect. 2.1, we recognise in the first item the probabilistic precedence pattern, in the second one the probabilistic response pattern, and in the last two the probabilistic constrained response pattern. However, these patterns refer only to the top level structure, whereas all our properties consist of multiple levels of embedded patterns. Perhaps more complex patterns are required for our domain? The patterns of [9] were abstracted from avionic, defence, and automotive systems, which are typical reactive systems; does the mobile app domain, or domains with strong user interaction exhibit different requirements? We remark also that analysis of activity patterns is just one dimension to consider: there are many others that are relevant to tailoring software to users, for example software variability and configuration, and user engagement. These are all topics of further work.
Choosing activity patterns.
What is the most appropriate value for , can we guide its choice? While we could use model selection or non-parametric methods to infer it, there might be domain-based reasons for fixing . For example, we can start with an estimate value of and then compare analysis activity patterns: if properties for two different activity patterns give very close quantitative results then we only need a smaller .
What to log?
This is a key question and depends upon the propositions we examine in our properties, as well as the overheads of logging (e.g. on system performance, battery, etc.) and ethical considerations (e.g. what have users agreed). Formal analysis will often lead to new instrumentation requirements, which in turn will stimulate new analysis. For example, our analysis of Hungry Yoshi has indicated a need for logged traces to include more information about current context, e.g. the observable access points (yoshis).
Overall approach and future plans.
In this paper we have focused on defining the appropriate statistical and formal models, their encoding, and reasoning using model checking. We have not explored here the types of insights we can gain into user behaviours from our approach, nor how we can employ these in system redesign and future system design, especially for specific subpopulations. Further, in this short paper, we have not considered the role of prediction from analysis and the possibilities afforded by longitudinal analysis. For example, how do the activity patterns and properties compare between users in 2009 and users in 2013? This is ongoing work within the A Population Approach to Ubicomp System Design project, where we are working with system developers on the practical application of our formal analysis in the design and redesign of several new apps. We are also investigating metrics of user engagement, tool support, and integration of this work with statistical and visualisation tools.
8 Related work
Our work is a contribution to the new software analytics described in [10], focusing on local methods and models, and user perspectives. It is also resonates with their prediction that by 2020 there will be more use of analytics for mobile apps and games. Recent work in analysis of user behaviours in systems, especially XBox games, is focused on understanding how features are used and how to drive users to use desirable features. For example, [11] investigates video game skills development for over 3 million users based on analysis of users’ TrueSkill rating [12]. Their statistical analysis is based on a single, abstract “skill score”, whereas our approach is based on reasoning about computation paths relating to in-app events and temporal property analysis of activity patterns. Our approach can be considered a form of run-time quantitative verification (by probabilistic model checking) as advocated by Calinescu et al. in [13]. Whereas they consider functional behaviour of service-based systems (e.g. power management) and software evolution triggered by a violation of correctness criteria because software does not meet the specification, or environment change, we address evolution based on behaviours users actually exhibit and how these behaviours relate to system requirements, which may include subtle aspects such as user goals and quality of experience. Perhaps of more relevance is the work on off-line runtime verification of logs in [14] that estimates the probability of a temporal property being satisfied by program executions (e.g. user traces). Their approach and results could help us determine how logging sampling in-app actions and app configuration affects analysis of user behaviour. Finally we note the very recent work of [5] on a similar approach and comment the major differences in Sect. 4. In addition they analyse REST architectures (each log entry corresponds to a web page access), whereas the mobile apps we are analysing are not RESTful, we can include more fine grained and contextual data in the logged user data.
9 Conclusions and Future Work
We have outlined our contribution to software analytics for user interactive systems: a novel approach to probabilistic modelling and reasoning over actual user behaviours, based on systematic and automated logging and reasoning about users. Logged user traces are computation paths from which we infer activity patterns, represented each by a discrete-time Markov chain (DTMC). A user meta model is deduced for each user, which represents users as mixtures over DTMCs. We encode the user metamodels in the probabilistic model checker PRISM and reason about the metamodel using probabilistic temporal logic properties to express hypotheses about user behaviours and relationships within and between the activity patterns. State-space size is independent of the size of population of users, and is related only to the number of distinct events that are logged.
We motivated and illustrated our approach by application to the Hungry Yoshi mobile iPhone game, which has involved several thousands of users worldwide. We showed how to encode some example questions posed by developers and evaluators in a probabilistic temporal logic, and obtained quantitative results for an example user metamodel. After considering our formal analysis of two activity patterns, we conclude the two activity patterns distinguish expert behaviour from ineffective behaviour and represent different strategies about how to play the game. While in this example the individual activity pattern DTMCs are small in number and size, in more complex settings it will be impossible to gain insight into behaviours informally, and in particular to insights into relationships between the activity patterns, so automated formal analysis of the UMM will be essential.
Further work will focus on gaining experience of practical application of our approach within redesign, and tying in with the other analytic methods we have at hand, for example visualisation. We will also combine the orthogonal concerns of user activity patterns and software configuration and structural variability. We will consider software configurations in use and distributions of software features (a feature [15, 16] is a component that adds new functionality). Properties to examine include: Which configurations and contexts are most popular for which types of users? Which are problematic? How are some particular configurations used and do they lead to longer or better user engagement? How does my setup compare to my friends? Are there configurations like my own that don’t crash so much and how are they used?
Acknowledgments. This research is supported by EPSRC Programme Grant A Population Approach to Ubicomp System Design (EP/J007617/1). The authors thank all members of the project, and Gethin Norman for fruitful discussions.
References
- [1] McMillan, D., Morrison, A., Brown, O., Hall, M., Chalmers, M.: Further into the Wild: Running Worldwide Trials of Mobile Systems. In Floréen, P., Krüger, A., Spasojevic, M., eds.: Proc. of Pervasive 2010. Volume 6030 of Lecture Notes in Computer Science., Springer (2010) 210–227
- [2] Hall, M., Bell, M., Morrison, A., Reeves, S., Sherwood, S., Chalmers, M.: Adapting ubicomp software and its evaluation. In: Proc. of EICS 2009, New York, NY, USA, ACM (2009) 143–148
- [3] Baier, C., Katoen, J.P.: Principles of Model Checking. The MIT Press (2008)
- [4] Kwiatkowska, M.Z., Norman, G., Parker, D.: Stochastic Model Checking. In Bernardo, M., Hillston, J., eds.: SFM. Volume 4486 of Lecture Notes in Computer Science., Springer (2007) 220–270
- [5] Ghezzi, C., Pezzè, M., Sama, M., Tamburrelli, G.: Mining Behavior Models from User-Intensive Web Applications. In: To appear in Proc. of ICSE’14. (2014)
- [6] Dempster, A.P., Laird, N.M., Rubin, D.B.: Maximum Likelihood from Incomplete Data via the EM Algorithm. Journal of the Royal Statistical Society. Series B (Methodological) 39(1) (1977) pp. 1–38
- [7] Higgs, M., Morrison, A., Girolami, M., Chalmers, M.: Analysing User Behaviour Through Dynamic Population Models. In: CHI ’13 Extended Abstracts on Human Factors in Computing Systems. CHI EA ’13, ACM (2013) 271–276
- [8] Kwiatkowska, M., Norman, G., Parker, D.: PRISM 4.0: Verification of probabilistic real-time systems. In Gopalakrishnan, G., Qadeer, S., eds.: Proc. 23rd International Conference on Computer Aided Verification (CAV’11). Volume 6806 of LNCS., Springer (2011) 585–591
- [9] Grunske, L.: Specification patterns for probabilistic quality properties. In Schäfer, W., Dwyer, M.B., Gruhn, V., eds.: ICSE, ACM (2008) 31–40
- [10] Menzies, T., Zimmermann, T.: Software Analytics: So What? IEEE Software 30(4) (2013) 31–37
- [11] Huang, J., Zimmermann, T., Nagappan, N., Harrison, C., Phillips, B.: Mastering the art of war: how patterns of gameplay influence skill in Halo. In: Proc. of the SIGCHI Conference on Human Factors in Computing Systems. CHI ’13, ACM (2013) 695–704
- [12] Herbrich, R., Minka, T., Graepel, T.: Trueskill™: A Bayesian skill rating system. Proc. of NIPS (2006) 569–576
- [13] Calinescu, R., Ghezzi, C., Kwiatkowska, M.Z., Mirandola, R.: Self-adaptive software needs quantitative verification at runtime. Commun. ACM 55(9) (2012) 69–77
- [14] Stoller, S.D., Bartocci, E., Seyster, J., Grosu, R., Havelund, K., Smolka, S.A., Zadok, E.: Runtime Verification with State Estimation. In: Proc. of RV 2011. Volume 7186 of Lecture Notes in Computer Science., Springer (2011) 193–207
- [15] Calder, M., Kolberg, M., Magill, E.H., Reiff-Marganiec, S.: Feature interaction: a critical review and considered forecast. Computer Networks 41(1) (2003) 115–141
- [16] Classen, A., Heymans, P., Schobbens, P.Y.: What’s in a Feature: A Requirements Engineering Perspective. In Fiadeiro, J.L., Inverardi, P., eds.: Proc. of FASE 2008. Volume 4961 of Lecture Notes in Computer Science., Springer (2008) 16–30