First time-dependent study of H2 and H orthopara chemistry in the diffuse interstellar medium: observations meet theoretical predictions111Partly based on observations collected at the European Organization for Astronomical Research in the Southern Hemisphere, Chile, as part of program 088.C-0351
Abstract
The chemistry in the diffuse interstellar medium initiates the gradual increase of molecular complexity during the life cycle of matter. A key molecule that enables build-up of new molecular bonds and new molecules via proton-donation is H. Its evolution is tightly related to molecular hydrogen and thought to be well understood. However, recent observations of ortho and para lines of H2 and H in the diffuse ISM showed a puzzling discrepancy in nuclear spin excitation temperatures and populations between these two key species. H, unlike H2, seems to be out of thermal equilibrium, contrary to the predictions of modern astrochemical models. We conduct the first time-dependent modeling of the para-fractions of H2 and H in the diffuse ISM and compare our results to a set of line-of-sight observations, including new measurements presented in this study. We isolate a set of key reactions for H and find that the destruction of the lowest rotational states of H by dissociative recombination largely control its ortho/para ratio. A plausible agreement with observations cannot be achieved unless a ratio larger than 1:5 for the destruction of and states of H is assumed. Additionally, an increased CR ionization rate to s-1 further improves the fit whereas variations of other individual physical parameters, such as density and chemical age, have only a minor effect on the predicted ortho/para ratios. Thus our study calls for new laboratory measurements of the dissociative recombination rate and branching ratio of the key ion H under interstellar conditions.
1 Introduction
H3+ plays a pivotal role in the gas-phase chemistry of the interstellar medium due to its very low proton affinity, allowing it to transfer a proton to many neutral atoms and molecules (exception being N and O2). The chemistry of H3+ is straightforward. The formation process via the ion-molecule reaction H + H2 -¿ H + H is well-established (e.g. Liszt, 2006). The destruction of H can occur via ion-molecule reactions or dissociative recombination (DR) with free electrons. Under typical conditions of different ISM environments H was long believed to exist below observable limits. Still, H3+ was observed in the interstellar medium by Geballe & Oka (1996) for the first time, followed by other detections (e.g. McCall et al., 1998; Geballe et al., 1999; McCall et al., 2002; Goto et al., 2008; Indriolo et al., 2007; Indriolo & McCall, 2012). These observations have also revealed several unexpected results, which are summarized below.
In the simple gas-phase chemistry of H3+ only three parameters can strongly affect its steady-state abundance: the dissociative recombination rate coefficients, the electron abundance, and the cosmic-ray (CR) ionization rate (McCall et al., 2003). The former two parameters are thought to be well constrained in diffuse interstellar clouds (Cardelli et al., 1996; McCall et al., 2003), which leaves the CR ionization rate as the only controlling parameter. McCall et al. (2003), Indriolo et al. (2007) and Indriolo & McCall (2012) observed absorption lines of H3+ toward several diffuse cloud sight lines, and inferred CR ionization ratios on the order of s-1, about an order of magnitude higher than the value inferred for dark prestellar cores ( s-1, see e.g. Webber, 1998; van der Tak & van Dishoeck, 2000; Caselli, 2003; van der Tak, 2006). If one relaxes the steady-state approximation, the density starts to play an important role in the H evolution (see e.g. Cecchi-Pestellini et al., 2009; Falgarone et al., 2013).
Furthermore, observations of the average excitation temperature derived from the two lowest rotational states of H3+, H) K (Indriolo et al., 2007; Indriolo & McCall, 2012). It differs significantly from that of the two lowest rotational states of H2, K (Rachford et al., 2002, 2009). Because the conversion between the two lowest nuclear spin states of H2 in collisions with free protons is very efficient, the H2 orthopara ratio is expected to be thermalized with the gas kinetic temperature. Hence, the excitation temperature derived from the relative intensities of H2 ortho and para levels are also expected to be an accurate measure of the gas kinetic temperature in the diffuse ISM ( K). Assuming that collisional thermalization between H and H2 is also efficient, in previous studies by McCall et al. (2003) and Gibb et al. (2010) the nuclear spin states of H were assumed to be in thermal equilibrium with the kinetic cloud temperature. However, in later studies the excitation temperatures of H2 and H3+directly derived from observations did not agree with each other, indicating that a large population of H is not thermalized with the diffuse ISM gas.
Crabtree et al. (2011) have investigated this discrepancy by comparing observations of the nuclear spin temperature of H3+ (subsequently refined by Indriolo & McCall, 2012) to that of H2 for a sample of diffuse interstellar clouds. Their results confirmed that the excitation temperature of H3+ and H2 do not agree. Crabtree et al. (2011) concluded that the H3+ ortho/para ratio is likely governed by a competition between the collisionally-driven thermalization of H3+ and the DR reactions with electrons. The thermalization reaction ortho/paraH + H2 orthopara H + H2 has recently been studied experimentally by Grussie et al. (2012). It was found that the reaction has indeed the expected thermal outcome.
From a theoretical point of view, there are more unknown factors related to the chemistry of H3+. Theoretical calculations have shown that the photodissociation of H3+ is not efficient in the diffuse interstellar medium (see e.g. van Dishoeck, 1987). In the absence of other abundant molecules like CO and H2O, this leaves DR as the only major destruction pathway for H3+. Recent theoretical calculations by dos Santos et al. (2007) predict the DR rate coefficient for paraH at low temperature to be an order of magnitude higher than that for orthoH. This claim has later been backed up by the plasma experiments of Varju et al. (2011). Meanwhile, other laboratory groups have observed a different dependence, with similar dissociation rates between the two nuclear spin states of H (see e.g. Kreckel et al., 2005; Tom et al., 2009; Kreckel et al., 2010).
In this paper we conduct the first time-dependent study of the orthopara chemistry of H in the diffuse interstellar medium. We isolate a set of key processes for the evolution of the ortho- and para-states of H, and we present new observational measurements to better test our model predictions. The paper is structured as follows. In Section 2 we discuss the new observations. In Section 3 we describe the chemical and physical models utilized in the analysis of the observations. Our results and the underlying chemistry is presented and discussed in Section 4, followed by conclusions given in Section 5.
2 Observations
Following the initial comparison of the H and H2 ortho/para ratios presented by Crabtree et al. (2011) we proposed new observations of H in eight diffuse cloud sight lines with measured H2 column densities. The intent of these new observations was to significantly expand the sample size from the five sight lines considered by Crabtree et al. (2011). Targeted sight lines were selected based on large observed H2 column densities ( cm-2 Rachford et al., 2002, 2009; Savage et al., 1977), and bright infrared background sources ( mag) to maximize the likelihood of H detections with relatively short ( hr) exposure times. Despite these considerations, H absorption lines were detected in only three of the eight targeted sight lines. As the new H detections are relevant to the current study, they are presented herein, whereas the non-detections will be presented in a future publication.
The sight lines toward HD 27778, HD 43384, and HD 41117 were observed on 2011 Nov 6, 2011 Dec 1, and 2012 Apr 1, respectively, using the Cryogenic High-resolution Infrared Echelle Spectrograph (CRIRES; Kaeufl et al., 2004) on UT1 at the Very Large Telescope. Observations were performed in service mode, and CRIRES was used with its 02 slit to provide a resolving power (resolution) of about 100,000 (3 km s-1), and a reference wavelength of 3715.0 nm to position the H ( m) transition on detector 3, and the ( m) and ( m) transitions on detector 1. The adaptive optics system was utilized in all cases to maximize starlight passing through the narrow slit. Spectra were obtained in an ABBA pattern with 10″ between the two nod positions and 3″ jitter width. Total integration times for the three targets were as follows: HD 27778: 34 min; HD 43384: 12 min; HD 41117: 12 min.
Raw data images were processed using the CRIRES pipeline version 2.2.1. Standard calibration techniques, including subtraction of dark frames, division by flat fields, interpolation over bad pixels, and correction for detector non-linearity effects, were utilized. Consecutive A and B nod position images were subtracted from each other to remove sky emission features. One-dimensional spectra were extracted from these images using the apall routine in iraf222http://iraf.noao.edu/, and any remaining bad pixels were interpolated over. Spectra were then imported to Igor Pro333http://www.wavemetrics.com/, and all spectra from each nod position were added together. Wavelength calibration of the summed A and summed B spectra was performed using atmospheric absorption lines (accurate to km s-1), after which the spectra from the A and B nod positions were averaged onto a common wavelength scale.444Combination of A and B spectra is done after wavelength calibration due to a slight (about one-half pixel) shift in wavelength along the dispersion direction between the two nod positions. In order to remove atmospheric absorption features, science target spectra were divided by spectra of telluric standard stars. Resulting spectra are shown in Figure 1.
Absorption features due to H were fit with Gaussian functions for the purpose of determining equivalent widths, velocity FWHM, and interstellar gas velocities. Equivalent widths were used to compute column densities in the lower state, and the para-H column density was then determined by taking a variance-weighted average of the values found from the and transitions. As we in this paper will discuss our results in terms of the paratototal ratio (para fraction), we here define these parameters for H2 and H3+ as:
All of the absorption line parameters and derived column densities are presented in Table 1, along with the inferred and excitation temperatures, . Also shown are H2 column densities, H2 para fractions (), and presented in Rachford et al. (2002, 2009).
The three new detections of H presented in this paper increase the total number of diffuse cloud sight lines with measurements of column densities of the ortho and para forms of both H and H2 from six to nine. Two of these sight lines—HD 27778 and HD 41117555Note that these sight lines are frequently referred to by the alternate identifiers 62 Tau and Ori, respectively.—were observed previously but H was not detected (McCall et al., 2002; Indriolo & McCall, 2012). Column densities in the (1,0) and (1,1) levels reported in this paper are consistent with the previously reported upper limits. The newly reported values of and follow the same trend shown by the six older data points in Crabtree et al. (2011) and Crabtree & McCall (2012). This continues to demonstrate that in diffuse clouds the excitation temperatures of H2 and H do not agree with each other, even when both species are observed in the same line of sight. This developing trend, and the lack of an adequate explanation from simple chemical models, is part of the reason for the present study.

| HD 27778aafootnotemark: | HD 41117bbfootnotemark: | HD 43384bbfootnotemark: | ||
|---|---|---|---|---|
| (km s-1) | 5.2 | 5.7 | 1.5 | |
| (km s-1) | 5.9 | 2.5 | 0.1 | |
| (km s-1) | 6.9 | 2.2 | 0.8 | |
| (km s-1) | 4.7 | 8.4 | 5.6 | |
| (km s-1) | 6.5 | 7.4 | 8.5 | |
| (km s-1) | 7.3 | 4.9 | 5.4 | |
| (10-6 m) | 0.930.14 | 1.110.23 | 0.490.11 | |
| (10-6 m) | 1.000.17 | 0.820.20 | 0.730.15 | |
| (10-6 m) | 0.910.21 | 0.560.15 | 0.550.13 | |
| (1013 cm-2) | 3.870.58 | 4.600.97 | 2.030.47 | |
| (1013 cm-2) | 2.530.42 | 2.070.52 | 1.850.37 | |
| (1013 cm-2) | 4.180.94 | 2.550.68 | 2.540.62 | |
| H | (1013 cm-2) | 3.960.22 | 3.221.45 | 2.220.36 |
| H | (1013 cm-2) | 2.530.42 | 2.070.52 | 1.850.37 |
| 0.610.04 | 0.610.12 | 0.550.06 | ||
| (K) | 294 | 2913 | 3811 | |
| H2 | 20.640.05 | 20.510.10 | 20.590.10 | |
| H2 | 20.270.10 | 20.220.10 | 20.540.18 | |
| 0.700.05 | 0.660.07 | 0.530.12 | ||
| (K) | 565 | 607 | 7415 |
3 Model
3.1 Physical model
We have utilized the gas-grain chemical model “ALCHEMIC” developed by Semenov et al. (2010), where a detailed description of the code and its performance is presented. Below we give a brief explanation of the code. In these low-density environments, surface interaction is not expected to play an important role in the chemistry. Never the less this is included in our model and explained in detail in Semenov et al. (2010).
To calculate UV ionization and dissociation rates, several tens of photoreaction rates are updated using the calculations of van Dishoeck et al. (2006). A UV photodesorption yield for surface species of 10-3 is assumed (see e.g. Öberg et al., 2009b, a). The self-shielding of H2 from photodissociation is calculated by Eq. (37) from Draine & Bertoldi (1996), assuming a total extinction of 0.5 mag with H cm-2, resulting in a H cm-2. The shielding of CO by dust grains, H2, and its self-shielding is calculated using the precomputed table of Lee et al. (1996, see Table 11).
In this work we are primarily concerned with reproducing observed ortho and paraabundances of H3+ and H2. We conduct a parametric study using our time-dependent chemical model. For this goal, gas density, DR and CR ionization rates, as well as initial ortho/para ratio of H2 and chemical age, are varied within the ranges typical of the diffuse ISM, and the modeled and values are compared with the observed values. There are still large uncertainties as to the initial abundances in diffuse clouds, concerning especially the depletion factor of metals and the degree of ionization (see e.g. Le Bourlot et al., 1995; Snow & McCall, 2006; Jenkins, 2009). To study the impact of different initial abundances we implement both the “low metal” and “high metal” abundances from Graedel et al. (1982) and Lee et al. (1998). Furthermore, we consider the neutral and fully ionized cases of initial abundances. Diffuse molecular clouds have typical densities of 10 - 100 cm-3 with typical extinction of mag (Snow & McCall, 2006). The CR ionization rate in the diffuse ISM is a matter of debate (see e.g. Indriolo et al., 2007, 2009; Rimmer et al., 2012; Indriolo & McCall, 2012). It is clear that the CR ionization rate plays a crucial role in the chemical evolution owing to its importance in the formation of H through the ionization of H2 and it also has a significant effect on the para-fractions of H2 and H. Therefore we consider a wide range of CR ionization rates between s-1. The lifetime of giant molecular clouds is typically in the range of several years (McKee & Ostriker, 2007), giving us an upper limit for the time scales of diffuse cloud evolution. Our cloud models are calculated within a time span of 106 years, but we also investigate the time effects on results for longer time spans of 107 years. As a “Standard” model (“S”) we consider a hydrogen gas density = 10 cm-3, = s = 0.5 mag, and temperatures K, adopting the H DR rates of McCall et al. (2004). The initial ortho/para ratio of H2 is still unknown for the ISM, therefore we investigate two values: 1:10, characteristic of low temperatures, and 3:1, the value characteristic for warm temperatures K (see e.g. Sternberg & Neufeld, 1999; Pagani et al., 2011).
3.2 Chemical network
We used a smaller version of the chemical network developed by Albertsson et al. (2013), which is based on the osu.2007 ratefile with recent updates to reaction rates, which we have modified such as only H-bearing reactions with H atoms, C atoms and molecules made of atoms are cloned. In this study we extended it to include the orthopara states of H2, H and H, and related nuclear spin-state exchange processes. Reaction rates for a small number of reactions have already been measured or theoretically predicted. For this, we have added rates from several sources (Gerlich, 1990; Walmsley et al., 2004; Flower et al., 2004; Pagani et al., 2009; Honvault et al., 2011), including reaction rates for the H + H2 system by Hugo et al. (2009). For any remaining reactions involving H2, H, or H with unknown rates, we extracted reactions containing these species and employed a separation scheme, similar to that from Sipilä et al. (2013), in order to generate ortho and paravariations of the reactions. We illustrate the process of our separation scheme with the following example:
where the left side is the original reaction, and the right shows the pathways resulting from the separation scheme. The reaction rate is the same as the original rate for the first pathway, while the reaction for para-H has two possible sets of products, and the reaction rate is divided between the two pathways, . This branching ratio is due to spin statistics (see e.g. Crabtree & McCall, 2013; Okumura et al., 2013). Contrary to Sipilä et al. (2013), we allow reactions without H3+ or H2+ as reactants to form not only para-H2, but also orthoH2 with an energy barrier of K. The final network consists of 1 300 species connected by 40 000 reactions. This networks includes gas-grain interactions and surface reactions. We assume that H2 is formed with a 3:1 ortho:para ratio, aligned with what is generally assumed in models and also supported by the first confirmation from laboratory experiments (Watanabe et al., 2010). However, the orthopara interconversion on dust surfaces are still highly uncertain (Chehrouri et al., 2011). In Table 2 we summarize the different models used to study the effects of physical and chemical parameters.
| Model | CR rate | Time | DR rates | Inital | |
|---|---|---|---|---|---|
| [cm-3] | [s-1] | [years] | [reference] | H2 o:p | |
| S | 10 | 10-16 | 106 | McCall et al. (2004) | 1:10 |
| N100 | 100 | 10-16 | 106 | McCall et al. (2004) | 1:10 |
| N1000 | 1000 | 10-16 | 106 | McCall et al. (2004) | 1:10 |
| C15 | 10 | 10-15 | 106 | McCall et al. (2004) | 1:10 |
| C17 | 10 | 10-17 | 106 | McCall et al. (2004) | 1:10 |
| T | 10 | 10-16 | 107 | McCall et al. (2004) | 1:10 |
| D | 10 | 10-16 | 106 | dos Santos et al. (2007) | 1:10 |
| O | 10 | 10-16 | 106 | McCall et al. (2004) | 3:1 |
| 2X | 10 | 10-16 | 106 | 2 McCall et al. (2004) | 1:10 |
3.2.1 H dissociative recombination
One of the crucial reactions for the hydrogen chemistry in the diffuse interstellar gas is the DR of H with free electrons:
| (6) |
The DR process is one of the dominant destruction processes for H in the environments considered here, it influences the ionization balance by removing the reactive H ion and yielding neutral fragments. Owing to its astrophysical relevance, the DR of H is a much-studied process, both experimentally and theoretically. The outcome of H DR studies has varied over the years, and to date there are more than 30 published experimental rate coefficients for this reaction. Historically, there were orders of magnitude discrepancies between different experimental approaches at times, with flowing and stationary afterglow experiments resulting in substantially lower rates than storage ring experiments, which have become the prevalent method for DR studies since the early nineties. However, the afterglow experiments have been re-evaluated recently (Glosík et al., 2009), and the inclusion of ternary collisions in the analysis has led to a good overall agreement between different methods concerning the absolute scale of the low-energy rate coefficient for H. A review on the early measurements and disagreements can be found in Larsson (2000); here we will focus on the current state-of-the-art and the best rate coefficient to use for our purpose.
The commonly accepted experimental value for the absolute DR rate is given as a thermal rate coefficient in McCall et al. (2004), as a function of temperature:
| (7) |
The underlying measurements were carried out using a supersonic expansion ion source at the CRYRING storage ring and confirmed over a wide range of relative energies by subsequent measurements at the Test Storage Ring (TSR) in Heidelberg (Kreckel et al., 2005, 2010). However, the latest of these studies (Kreckel et al., 2010; Petrignani et al., 2011) revealed that the expansion ion source delivered much hotter ions than previously assumed, and the best characterized measurements were carried out at 370 K (Petrignani et al., 2011). The implications for the rate coefficient at K are uncertain.
Theoretically, the DR of H has proven difficult to describe. The classical picture of direct DR that proceeds through a curve-crossing of a dissociative state does not apply for H, and thus initial studies predicted a very low rate coefficient. This picture has changed when more modern studies in full-dimensionality became available and identified the Jahn-Teller effect as the driving force behind H DR (Kokoouline et al., 2001; Kokoouline & Greene, 2003a, b). With these major advances, the more recent calculations of dos Santos et al. (2007) agree quite well with the storage ring measurements for the absolute recombination rate, while discrepancies remain for the detailed energy-dependence (Petrignani et al., 2011). We adopt rate coefficients converted to the Kooji formulation, by adjusting the coefficients for best agreement in our temperature range of 10100 K:
| (8) |
Deviations from the original fit in this temperature range are below 20 %.
The situation gets even more complicated when one considers the dependence of the DR rate on the nuclear spin of H. The calculations of dos Santos et al. (2007) predict that at K the DR rate is dominated by the para-H states and at 10 K the rate for H is more than an order of magnitude lower than for H. These theoretical values are supported by recent afterglow results that see a similar trend (Varju et al., 2011). It should be kept in mind, though, that the calculated rate coefficient at these temperatures depends on the precise position of Rydberg resonances that are difficult to predict, and the initial calculations actually showed the opposite trend (Kokoouline & Greene, 2003b).
The first measurements that showed a nuclear spin dependence of the H DR rate were carried out at the TSR (Kreckel et al., 2005), however, only a slight enhancement of the rate for paraH was seen. The same trend has been observed in more recent studies by Tom et al. (2009) and Kreckel et al. (2010). The caveat of these measurements is again the fact that the ions were probably not in their rotational ground states. More detailed studies with state-selected molecular ions are clearly desirable for this important reaction. For now, we implement both extremes in our model calculations, the almost exclusive dominance of the low-energy DR by para-H, as predicted by the calculations of dos Santos et al. (2007), and basically equal rate coefficients for ortho and paraH, as seen in the storage ring measurements.
3.3 Dominant pathways
First, to ease our detailed analysis of the chemical processes relevant for the evolution of H2 and H spin states, we identify the dominant pathways in their chemistry. For that we reduce our initially huge gas-grain chemical network with surface reaction to a much smaller set of reactions using our “Automatic Reduction Technique” (ART) tool (see, e.g., Semenov et al., 2006). The reduced network consists of only 20 species and 144 reactions, and is accurate within 10% in the studied parameter space for the abundances of H2 and H (see Table 2).
The dominant pathways include ionization by CR particles and UV photons as well as DR and ion-molecule reactions. In comparison to Crabtree et al. (2011), who considered a much simpler chemistry, we find additional pathways that, when combined, bear a significant effect on the resulting para-fraction values. Because of the importance that H+ plays for the H2 orthopara ratios, it becomes necessary to consider the photodissocation of H2+, a major formation pathway of H+. Equally important are the DR of the simple molecular ions made of H, C, O, which affects the rate of the H3+ DR reaction. We also find that, with the exception being S, elements heavier than oxygen do not have any impact on the hydrogen chemistry. We note that S+ does not bear any large significance in comparison to C+ for determining the time-dependent orthopara abundances of H2 and H and the effect on the total degree of ionization is at most 10%.
Much as Crabtree et al. (2011), we find that surface processes do not play a significant role in the chemistry of H2 and H. This is because we begin our chemical simulations with hydrogen already being essentially in molecular form and the densities being too low for any efficient surface chemistry to take place. The gas-phase formation of H2 proceeds via slow neutral-neutral collisions of H atoms or ion-molecule reactions like H3+ + O OH+ + H2, and is not efficient.
Aside from DR reactions, there is a small number of ion-molecule reactions that aid in the removal of H3+. The two most notable of the less effective destruction pathways is H3+ reacting with OH or O, forming H2O+ or OH+, respectively, and H2. As we show below, at gas hydrogen density of 10 cm-3 these reactions can slow down the increase in and causing small changes to occur with time.
Furthermore, we found inconsistencies in the main public astrochemical networks related to the reaction rates of the photodissociation of H3+. Because H3+ is expected to be in the ground state in the diffuse interstellar medium, a photon with an energy of almost 20 eV is required for it to be photo-dissociated (Talbi & Saxon, 1988). This essentially means that H3+ photodissociation is inactive under ISM conditions. Theoretical modeling agrees with this (see e.g. van Dishoeck, 1987; van Dishoeck et al., 2006). In the UMIST database (latest version UMIST 2012; McElroy et al., 2013), the correct photodissociation rates for H3+ are incorporated. However, this rate is seven orders of magnitude higher in other databases, such as KIDA666http://kida.obs.u-bordeaux1.fr/ and OSU777http://www.physics.ohio-state.edu/~eric/research.html. Because our network is based on the recent osu.2009 network, it had an incorrect rate for the H photodissociation on the order of s-1, which we have corrected in this study by adopting the corrected value of s-1 from van Dishoeck (1987).
4 Results
4.1 Parameter effects
Implementation of the chemical processes as well as properties of the environment, including density, temperature, and the choice of the chemical age, are the major actors for chemical kinetics modeling. Among these factors, we find that the adopted values of the DR rates have the greatest effect on modeled abundances of ortho and paraH, while the chemical age, the density, and the CR ionization rate are less important. In our models the orthopara chemistry for H2 is already at a quasi steady-state after years, which is shorter than our standard adopted chemical age of years. Hence, unless otherwise specified, we discuss only the time-dependent evolution of the H orthopara chemistry. We calculated the ”S” model using two initial abundances with ”high” and ”low” metal abundances, and found that there is a difference in abundances of key molecules. Considering an initially ionized medium (except for H, He, O, N) only shortens the time needed for para-fractions to reach their equilibrium values. More importantly, in both these cases, and remain unaffected and hence our conclusions are not affected by the choice of initial abundances beyond times years.

In Figure 2 we show the resulting and values for our models with varying density (models “N100” and “N1000”), CR ionization rate (models “C17” and “C15”), time (model “T”) and reaction rates for the H DR reactions (model “D”), compared to the ”Standard“ model (model “S”).
The “S” model does not agree with the trend observed towards diffuse clouds (see Figure 2), but is very similar to the distribution calculated by Crabtree et al. (2011) (see their Figure 8), where they considered only the H formation and its destruction by DR. Our models are also compared to thermalized distributions, calculated using energy levels from Lindsay & McCall (2001). The nascent distribution, where = 1/3 + 2/3 is also plotted. For this distribution we assume that H3+ is exclusively formed from reaction H2+ + H2 and we use the branching ratios adopted from nuclear spin selection rules of Quack (1977) and Oka (2004). Furthermore, we assume that the CR ionization of H2 does not affect the H2+ nuclear spin configuration.
We consider three CR ionization rates, and s-1 (models “S”, “C17” and “C15” respectivelly). The “C17” model decreases the values while increasing values, worsening the agreement compared to the “S” model. Meanwhile, the “C15” model significantly improves the fit such that predicted para-fractions go through the observed data points. Variations in the CR ionization rate affects the ionization degree, affecting the abundances and para-fractions of ions.
Although the diffuse interstellar clouds are likely clumpy, they are often assumed to be homogeneous in astrochemical models. We consider three gas densities typical of diffuse ISM, 10, 100 and 1000 cm-3 (model “S”, “N100” and “N1000” respectivelly). We find that results for model “S” with a hydrogen density of 10 cm-3 are closer to the observed values of . The reason for the higher para-H fraction with lower density is again the ionization degree of the medium, which is largely determined by H+ and C+. At lower densities the neutralization of the medium through DR reactions proceeds slower, causing a higher ionization degree, however it is not enough to affect the value.
While we can not predict column densities as our models have no spatial dimension, we can compare the ratios of calculated H / H2 abundances to the observed column densities, which should agree unless extreme clumpiness occurs. Doing this, for the final abundances at 1 Myr, our models predicts for temperatures 30 70 K abundances ratios H / H2 = for 10 cm-3 (model “S”), for 100 cm-3 (model “N100”) and for 1000 cm-3 (model “N1000”), while observed column density ratios are typically (Crabtree et al., 2011; Indriolo & McCall, 2012, and this study). This means that modeled abundances for the gas density 100 cm-3 agree better with the observed H / H2 ratios, while the p3 values still disagree. It also becomes clear that the temperature has a larger effect on abundances at 10 cm-3 than at 100 cm-3, considering the predicted wide range of abundances for the 10 cm-3 model. The effects of the CR ionization modeled in the “C17” and “C15” models also affects the H / H2 abundances ratios, and for the former we calculate H / H2 = and for the latter H / H2 = . This means that the “C15” model improves the agreement in the para-fraction distributions and the calculated HH2 abundance ratios are within reasonable agreement to observed column densities.
4.1.1 Time-dependence
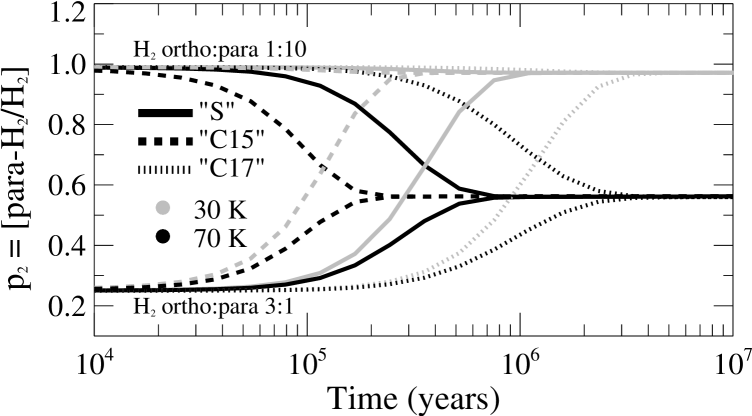
In Figure 3 we show the evolution of values for models “S”, “C15” and “C17” as a function of time for two separate temperatures, 30 K and 70 K, and considering two initial H2 ortho/para ratio, 3:1 (equilibrium ratio) and 1:10 (ratio of colder environments). At 30 K the values do not change significantly between models “S”, “C15” and “C17”, as they are close to the thermalized value already from the beginning. The “S” model reaches its 30 K steady-state value after years, while the 70 K value requires only years. However, in the “C17” model it takes longer, years at both 30 and 70 K, to reach the same steady-state values, as opposed to years for the “C15” model. This means that the results are strongly time-dependent, and the steady-state values have not changed, but merely the process of reaching the steady-state values is slowed down. The variation in CR ionization rate affects the production of H+, the essential thermalization agent of H2 and this further affects the time it takes to reach the thermalized ortho/para ratio. The calculated fractions become independent of the modeling assumptions on time scales years.
Contrary to the H2 evolution, the modeled orthopara H abundances have not reached steady-state by the chemical age of 106 years. Therefore, we study how evolves in the “S” model at later times up to 107 years (model “T”, see Figure 2). In general, the values increase with temperature and the temperature distribution slowly approaches the nascent distribution. However, this process appears to require an unrealistic amount of time exceeding 108 years for models “N100” and “N1000”. It is clear that even after only years the distribution is showing an appreciable difference to its value after 106 years.
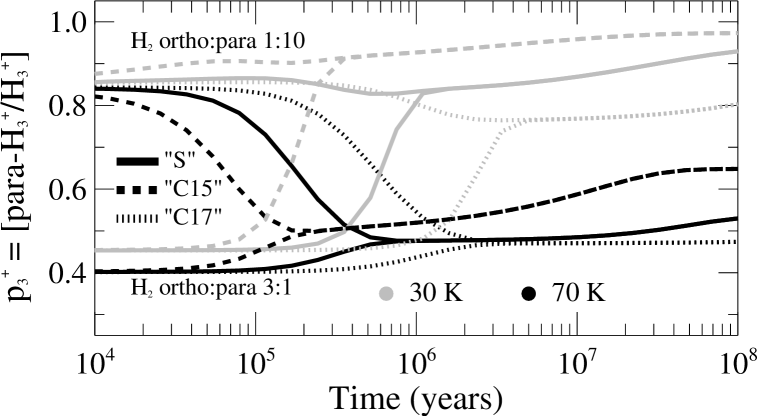
This becomes much clearer in Figure 4 where the time evolution of is shown for the “S”, “C15” and “C17” models up to 108 years. We can see that 108 years are necessary in order for the “C15” model to reach steady-state while the other models needs even longer time scales as the values are slowly increasing with time until they reach steady-state values of at 30 K and at 70 K. This steady increase in values is due to the slow redistribution of hydrogen from molecular into atomic form (H and H+). We can conclude that it is clear that steady-state models are not appropriate in modeling the values of diffuse clouds.
4.1.2 Influence of DR rate coefficient
The total rate and branching ratios for the DR of (1,0) and (1,1)H3+ greatly affects the modeled values (see Figure 2). In model “D” we compare the -values of H3+ and H2 for the chemical models adopting a branching ratio of 1:15 for the ortho:para H DR rates, as predicted by dos Santos et al. (2007). There are clear differences between the various models and the observed values, with the largest discrepancy arising at temperatures K, which are typical representative temperatures of the diffuse ISM (Snow & McCall, 2006). The H DR process with a preferred destruction of H3+ results in values that are lower than the thermalized distribution at temperatures K. The values continue to decrease with time. As we adjust the DR branching ratio for (1,0) and (1,1)H towards unity, the overall values increase, most notably at low temperatures, and approximately at a ratio of the time dependence is reversed, and the values begin to slowly increase with time. The key conclusion is that while the total DR rate coefficient does not play a significant role as long as the branching ratio is 1:5, a DR branching ratio approaching unity for and H is necessary in order to reproduce the observed distributions. Furthermore, the H / H2 ratios in the “D” model are not significantly affected by variations in the DR branching ratio, the H / H2 values are similar to those predicted for the “S” model.

It is clear that the increased DR rate of orthoH improves the fit to observations, but the question remains if a higher total DR rate can also affect results, while the relative rate between and H remains the same. In Figure 5 we compare the results of increasing the total DR rate in the “S” model by a factor 2 (dotted line, model “2X”) which significantly improves the fit. Because the value is largely determined by the ratio between thermalization and DR processes, an increase in the DR rate can also be considered the same effect as if the thermalization process is slowed down, as was discussed by Crabtree et al. (2011) (see their Figure 6).
4.2 Best-fit model
A high total DR rate will cause the time effect to be more significant, hence we have also calculated a model at years. The additional longer time scale improves our fit and we find that the resulting distribution of para-fractions is similar to what is predicted in the “2X” model. Furthermore, the total H abundance decreases further, and at years H / H2 = , which is closer to the observed values.
Because the H abundance is also strongly affected, the H / H2 ratio decreases by a similar factor of and for the same increase in the total DR rate, respectively. The H / H2 ratio drops to values similar to the observed values of . It means that an increased total DR rate also has the added benefit of improving the agreement to the calculations of the H column densities. By combining the effects of an increased DR rate and increased chemical age (model “2X + T”) we achieve a distribution that is approaching the observed distribution and where H / H2 = is largely similar to the observed column densities.
A higher CR ionization rate (model “C15” with = 10-15 s-1) was shown to have a positive effect on improving the fit to observations. Combining the effect of the increased DR rate with an increased CR ionization rate (“2X + C15”) further helps to improve the agreement with observations. We find that the best fit to observations is achieved with the “2X + C15” model where predicted and values clearly go through the observation data points. The calculated H / H2 = is somewhat higher due to the increased CR ionization rate, but similar to that predicted for the “C15” model.
4.3 Other molecules
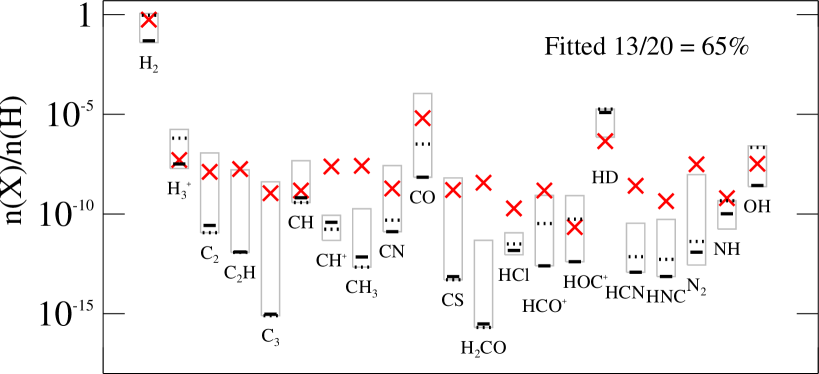
While we have been concentrating on the abundances of H and H2, other molecules have also been observed in diffuse clouds and will be affected by the variations of model parameters. In Figure 6 the range of calculated abundances from the models in Table 2 are compared to a compilation of observations in diffuse clouds from Snow & McCall (2006).
The calculated abundances cover a wide range that shows an agreement with several observed molecules (grey lines), especially CH, CO, OH, H2, H and HD. Amongst the molecules difficult to fit we find molecules such as CH+, HCN, HNC, HCO+. If we consider only the best-fit model “2X+C15” we see that we underpredict abundances by many orders of magnitude (see gray lines of Figure 6), however the calculated H abundances at K are in agreement with observed values.
HCl shows a underprediction of abundances by approximately 2 orders of magnitude compared to observations, likely due to the very limited Cl-based chemistry in our network which makes our predicted HCl abundances very uncertain.
Although CH+ is a simple ion, it has for long been recognised as a problematic molecule to explain in the diffuse ISM (see e.g. Duley et al., 1992; Federman et al., 1996; Pan & Padoan, 2009). Its expected slow formation through radiative association mechanism C+ + H CH+ + or C+ + H2 CH followed by photodissociation while being rapidly destroyed through reactions with H, H2 and e- is causing models to underpredict abundances by two orders of magnitude compared to observations. A possible solution to explain this discrepancy is finding a physical processes that would allow the endothermic reaction C+ + H2 CH+ + H to be effective and drive the production of CH+, such as shocks or turbulence (see e.g. Draine & Katz, 1986; Falgarone et al., 2005).
In the diffuse ISM, lacking efficient surface chemistry, H2CO is formed through the reaction CH3 + O H2CO + H. The underproduction of H2CO should therefore be able to be traced through the CH3 formation, which begins with CH+ and the subsequent formation of CH and CH through hydrogenation by reacting with H2. As we can see from Figure 6, CH+ is similarly underproduced as CH3 and H2CO, and it is likely that the underproduction is related to that of CH+, which is mainly formed through H reacting with C atoms. Since we can show a good agreement to H observations, we can conclude that C atoms must be underproduced in chemical models. However, because atomic C has not been observed, this can not be tested.
For species such as HCN, HNC and N2, light hydrocarbons first need to be formed, making these species late-time and hence strongly dependent on the chemical age and calculated abundances are very uncertain.
The abundances of these species may also be affected by other processes and parameters such as the clumpiness of the environments, initial abundances and the chemistry of molecules in excited states (see e.g. Spaans, 1996; Price et al., 2003; Bethell et al., 2007; Agúndez et al., 2010; Oka, 2013; Agúndez & Wakelam, 2013).
5 Conclusions
We present the results of three new sight lines towards diffuse clouds, where both H and H2 have been observed in their ortho and para forms. The new observations follow the same trend as found by Crabtree et al. (2011), lying between the nascent and thermalized distribution. We come to the conclusion that H is not fully thermalized as the thermalization by collisions with H2 is competing with destruction of H by dissociative recombination.
To study this, we conducted the first time-dependent modeling of the nuclear spin-states of H2 and H3+ in the diffuse interstellar medium, and compared our results to the observed values, including the new measurements.
We found that the DR of H is a key process that governs the values. Our model indicates that a branching ratio of between the - and - H dissociation is needed to achieve an agreement with the observations. An increased CR ionization rate to 10-15 s-1 also has a significant effect on the values and brings the calculated values much closer to the observed values. The remaining studied parameters, initial H2 ortho/para ratio, , chemical age and total DR rates will increase the pace at which the values approach the nascent distribution by a smaller, but significant amount.
However, increasing the CR ionization rate to s-1 causes difficulties with reproducing observed abundances of other molecules, whereas many molecules are underproduced by our models. This is the same problem that has been raised before in the discussion of H in diffuse clouds, but here we can also show that the high CR ionization rate is an essential ingredient in order to achieve an agreement with the para-fractions of H.
We conclude that the best fit to observations is achieved for the “2X+C15” model with a density of 10 cm-3, CR ionization rate 10-15 s-1, a 1:1 DR branching ratio, a time scale of years and a total DR rate a factor of 2 larger than that derived by (McCall et al., 2004), or an equivalent reduction of thermalization rates (see Figure 6 of Crabtree et al., 2011). With this model, we find that our predicted H / H2 values match that derived from the observed column densities within an order of magnitude (where the largest impact is due to the adopted density and CR ionization rate).
These results warrant a more detailed study with a better treatment of the clumpy structure of diffuse clouds. Furthermore, better understanding of the CR ionization rate, and its possible variation within the diffuse cloud, and chemical ages need to be better constrained for future studies (e.g. Rimmer et al., 2012). It is also evident that the H DR process is vital in order to better understand the orthopara hydrogen chemistry in the diffuse ISM. For that, one has to bring in agreement the laboratory results on the DR of H obtained with various experimental setups, such as the storage ring experiments (Kreckel et al., 2005; Tom et al., 2009; Kreckel et al., 2010), and the afterglow experiments (e.g. Gougousi et al., 1995; Laubé et al., 1998; Plašil et al., 2002; Glosík et al., 2009). Therefore, we highly recommend new accurate studies of the H DR reactions, in order to both determine the absolute DR rate as well as the nuclear spin dependence for the lowest rotational states.
| Reaction | Error | |||||
|---|---|---|---|---|---|---|
| H + CR | H+ + e- | 2.00 | ||||
| oH2 + CR | H+ + H + e- | 2.00∗ | ||||
| pH2 + CR | H+ + H + e- | 2.00∗ | ||||
| oH2 + CR | oH2+ + e- | 2.00∗ | ||||
| pH2 + CR | pH2+ + e- | 2.00∗ | ||||
| oH2 + CR | 2H | 2.00∗ | ||||
| pH2 + CR | 2H | 2.00∗ | ||||
| He + CR | He+ + e- | 2.00 | ||||
| C + CR | C+ + e- | 2.00 | ||||
| O + CR | O+ + e- | 2.00 | ||||
| S + h | S+ + e- | 2.00 | ||||
| OH + h | O + H | 2.00 | ||||
| C + h | C+ + e- | 2.00 | ||||
| H + h | H+ + e- | 2.00 | ||||
| He + h | He+ + e- | 2.00 | ||||
| O + h | O+ + e- | 2.00 | ||||
| oH2 + h | 2H | 2.00∗ | ||||
| pH2 + h | 2H | 2.00∗ | ||||
| oH2 + h | H+ + H + e- | 2.00∗ | ||||
| pH2 + h | H+ + H + e- | 2.00∗ | ||||
| oH2 + h | oH2+ + e- | 2.00∗ | ||||
| pH2 + h | pH2+ + e- | 2.00∗ | ||||
| C + UV | C+ + e- | 2.00 | ||||
| OH + UV | OH+ + e- | 2.00 | ||||
| OH + UV | O + H | 2.00 | ||||
| OH+ + UV | H+ + O | 2.00 | ||||
| S + UV | S+ + e- | 2.00 | ||||
| oH2 + UV | 2H | 2.00∗ | ||||
| pH2 + UV | 2H | 2.00∗ | ||||
| oH2+ + UV | H+ + H | 2.00∗ | ||||
| pH2+ + UV | H+ + H | 2.00∗ | ||||
| C+ + S | S+ + C | 2.00 | ||||
| H+ + O | O+ + H | 1.50 | ||||
| H+ + OH | OH+ + H | 2.00 | ||||
| H+ + S | S+ + H | 2.00 | ||||
| oH2+ + H | H+ + oH2 | 1.25∗ | ||||
| pH2+ + H | H+ + pH2 | 1.25∗ | ||||
| pH2+ + oH2 | pH3+ + H | 2.00 | ||||
| oH2+ + O | OH+ + H | 2.00∗ | ||||
| pH2+ + O | OH+ + H | 2.00∗ | ||||
| oH2+ + OH | H2O+ + H | 2.00∗ | ||||
| pH2+ + OH | H2O+ + H | 2.00∗ | ||||
| oH2+ + OH | OH+ + oH2 | 2.00∗ | ||||
| pH2+ + OH | OH+ + pH2 | 2.00∗ | ||||
| oH3+ + O | OH+ + oH2 | 1.41∗ | ||||
| pH3+ + O | OH+ + oH2 | 1.41∗ | ||||
| pH3+ + O | OH+ + pH2 | 1.41∗ | ||||
| oH3+ + OH | H2O+ + oH2 | 2.00∗ | ||||
| pH3+ + OH | H2O+ + oH2 | 2.00∗ | ||||
| pH3+ + OH | H2O+ + pH2 | 2.00∗ | ||||
| He+ + H | H+ + He | 1.25 | ||||
| He+ + oH2 | oH2+ + He | 2.00∗ | ||||
| He+ + pH2 | oH2+ + He | 2.00∗ | ||||
| He+ + pH2 | pH2+ + He | 2.00∗ | ||||
| He+ + oH2 | H+ + H + He | 2.00∗ | ||||
| He+ + pH2 | H+ + H + He | 2.00∗ | ||||
| He+ + OH | O+ + H + He | 2.00 | ||||
| O+ + H | H+ + O | 1.50 | ||||
| O+ + oH2 | OH+ + H | 1.25∗ | ||||
| O+ + pH2 | OH+ + H | 1.25∗ | ||||
| O+ + OH | OH+ + O | 2.00 | ||||
| OH+ + oH2 | H2O+ + H | 1.25∗ | ||||
| OH+ + pH2 | H2O+ + H | 1.25∗ | ||||
| OH+ + OH | H2O+ + O | 2.00 | ||||
| OH+ + S | S+ + OH | 2.00 | ||||
| H+ + H | oH2+ | 2.00∗ | ||||
| H+ + H | pH2+ | 2.00∗ | ||||
| H + OH | O + oH2 | 2.00∗ | ||||
| H + OH | O + pH2 | 2.00∗ | ||||
| oH2 + O | OH + H | 3.16∗ | ||||
| pH2 + O | OH + H | 3.16∗ | ||||
| H + O | OH | 10.0 | ||||
| oH2+ + e- | 2H | 2.00∗ | ||||
| pH2+ + e- | 2H | 2.00∗ | ||||
| H2O+ + e- | OH + H | 1.25 | ||||
| H2O+ + e- | O + H + H | 1.25 | ||||
| H2O+ + e- | O + oH2 | 1.25∗ | ||||
| H2O+ + e- | O + pH2 | 1.25∗ | ||||
| oH3+ + e- | oH2 + H | see Section 3.2.1 | ||||
| pH3+ + e- | oH2 + H | see Section 3.2.1 | ||||
| pH3+ + e- | pH2 + H | see Section 3.2.1 | ||||
| oH3+ + e- | 3H | see Section 3.2.1 | ||||
| pH3+ + e- | 3H | see Section 3.2.1 | ||||
| OH+ + e- | O + H | 1.25 | ||||
| C+ + e- | C | 1.50 | ||||
| H+ + e- | H | 2.00 | ||||
| He+ + e- | He | 2.00 | ||||
| O+ + e- | O | 2.00 | ||||
| S+ + e- | S | 2.00 | ||||
| oH3+ + O | H2O+ + H | 1.41∗ | ||||
| pH3+ + O | H2O+ + H | 1.41∗ | ||||
| H + H | oH2 | 2.00∗ | ||||
| H + H | pH2 | 2.00∗ | ||||
| H+ + oH2 | oH2+ + H | 2.00 | ||||
| H+ + pH2 | oH2+ + H | 2.00 | ||||
| H+ + pH2 | pH2+ + H | 2.00 | ||||
| oH3+ + H | pH2+ + oH2 | 2.00∗ | ||||
| pH3+ + H | pH2+ + oH2 | 2.00∗ | ||||
| pH3+ + H | pH2+ + pH2 | 2.00∗ | ||||
| C+ + H | H+ + C | 2.00 | ||||
| S+ + H | H+ + S | 2.00 | ||||
| H+ + C | C+ + H | 2.00 | ||||
| pH3+ + oH2 | pH3+ + 2H | 2.00 | ||||
| He+ + oH2 | He+ + 2H | 2.00∗ | ||||
References
- Agúndez et al. (2010) Agúndez, M., Goicoechea, J. R., Cernicharo, J., Faure, A., & Roueff, E. 2010, ApJ, 713, 662
- Agúndez & Wakelam (2013) Agúndez, M. & Wakelam, V. 2013, Chemical Reviews, 113, 8710
- Albertsson et al. (2013) Albertsson, T., Semenov, D. A., Vasyunin, A. I., Henning, T., & Herbst, E. 2013, ApJS, 207, 27
- Bethell et al. (2007) Bethell, T. J., Zweibel, E. G., & Li, P. S. 2007, ApJ, 667, 275
- Cardelli et al. (1996) Cardelli, J. A., Meyer, D. M., Jura, M., & Savage, B. D. 1996, ApJ, 467, 334
- Caselli (2003) Caselli, P. 2003, Ap&SS, 285, 619
- Cecchi-Pestellini et al. (2009) Cecchi-Pestellini, C., Williams, D. A., Viti, S., & Casu, S. 2009, ApJ, 706, 1429
- Chehrouri et al. (2011) Chehrouri, M., Fillion, J.-H., Chaabouni, H., et al. 2011, Physical Chemistry Chemical Physics (Incorporating Faraday Transactions), 13, 2172
- Crabtree et al. (2011) Crabtree, K. N., Indriolo, N., Kreckel, H., Tom, B. A., & McCall, B. J. 2011, ApJ, 729, 15
- Crabtree & McCall (2012) Crabtree, K. N. & McCall, B. J. 2012, Philosophical Transactions of the Royal Society A: Mathematical, Physical and Engineering Sciences, 370, 5055
- Crabtree & McCall (2013) Crabtree, K. N. & McCall, B. J. 2013, The Journal of Physical Chemistry A, 117, 9950
- dos Santos et al. (2007) dos Santos, S. F., Kokoouline, V., & Greene, C. H. 2007, The Journal of Chemical Physics, 127, 124309
- Draine & Bertoldi (1996) Draine, B. T. & Bertoldi, F. 1996, ApJ, 468, 269
- Draine & Katz (1986) Draine, B. T. & Katz, N. 1986, ApJ, 310, 392
- Duley et al. (1992) Duley, W. W., Hartquist, T. W., Sternberg, A., Wagenblast, R., & Williams, D. A. 1992, MNRAS, 255, 463
- Falgarone et al. (2013) Falgarone, E., Godard, B., Pineaue des Forêts, G., & Gerin, M. 2013, in IAU Symposium, Vol. 292, IAU Symposium, ed. T. Wong & J. Ott, 223–226
- Falgarone et al. (2005) Falgarone, E., Verstraete, L., Pineau Des Forêts, G., & Hily-Blant, P. 2005, A&A, 433, 997
- Federman et al. (1996) Federman, S. R., Rawlings, J. M. C., Taylor, S. D., & Williams, D. A. 1996, MNRAS, 279, L41
- Flower et al. (2004) Flower, D. R., Pineau des Forêts, G., & Walmsley, C. M. 2004, A&A, 427, 887
- Geballe et al. (1999) Geballe, T. R., McCall, B. J., Hinkle, K. H., & Oka, T. 1999, ApJ, 510, 251
- Geballe & Oka (1996) Geballe, T. R. & Oka, T. 1996, Nature, 384, 334
- Gerlich (1990) Gerlich, D. 1990, J. Chem. Phys., 92, 2377
- Gibb et al. (2010) Gibb, E. L., Brittain, S. D., Rettig, T. W., et al. 2010, ApJ, 715, 757
- Glosík et al. (2009) Glosík, J., Plašil, R., Korolov, I., et al. 2009, Phys. Rev. A, 79, 052707
- Goto et al. (2008) Goto, M., Usuda, T., Nagata, T., et al. 2008, ApJ, 688, 306
- Gougousi et al. (1995) Gougousi, T., Johnsen, R., & Golde, M. F. 1995, International Journal of Mass Spectrometry and Ion Processes, 149, 131
- Graedel et al. (1982) Graedel, T. E., Langer, W. D., & Frerking, M. A. 1982, ApJS, 48, 321
- Grussie et al. (2012) Grussie, F., Berg, M. H., Crabtree, K. N., et al. 2012, ApJ, 759, 21
- Honvault et al. (2011) Honvault, P., Jorfi, M., González-Lezana, T., Faure, A., & Pagani, L. 2011, Physical Review Letters, 107, 023201
- Hugo et al. (2009) Hugo, E., Asvany, O., & Schlemmer, S. 2009, J. Chem. Phys., 130, 164302
- Indriolo et al. (2009) Indriolo, N., Fields, B. D., & McCall, B. J. 2009, ApJ, 694, 257
- Indriolo et al. (2007) Indriolo, N., Geballe, T. R., Oka, T., & McCall, B. J. 2007, ApJ, 671, 1736
- Indriolo & McCall (2012) Indriolo, N. & McCall, B. J. 2012, ApJ, 745, 91
- Jenkins (2009) Jenkins, E. B. 2009, ApJ, 700, 1299
- Kaeufl et al. (2004) Kaeufl, H.-U., Ballester, P., Biereichel, P., et al. 2004, in Society of Photo-Optical Instrumentation Engineers (SPIE) Conference Series, Vol. 5492, Society of Photo-Optical Instrumentation Engineers (SPIE) Conference Series, ed. A. F. M. Moorwood & M. Iye, 1218–1227
- Kokoouline & Greene (2003a) Kokoouline, V. & Greene, C. H. 2003a, Physical Review Letters, 90, 133201
- Kokoouline & Greene (2003b) Kokoouline, V. & Greene, C. H. 2003b, Phys. Rev. A, 68, 012703
- Kokoouline et al. (2001) Kokoouline, V., Greene, C. H., & Esry, B. D. 2001, Nature, 412, 891
- Kreckel et al. (2005) Kreckel, H., Motsch, M., Mikosch, J., et al. 2005, Physical Review Letters, 95, 263201
- Kreckel et al. (2010) Kreckel, H., Novotný, O., Crabtree, K. N., et al. 2010, Phys. Rev. A, 82, 042715
- Larsson (2000) Larsson, M. 2000, in Phil. Trans. R. Soc. Lond. A, Vol. 358, Astronomy, physics and chemistry of H+3, 2433–2444
- Laubé et al. (1998) Laubé, S., LePadellec, A., Sidko, O., et al. 1998, Journal of Physics B Atomic Molecular Physics, 31, 2111
- Le Bourlot et al. (1995) Le Bourlot, J., Pineau des Forets, G., & Roueff, E. 1995, A&A, 297, 251
- Lee et al. (1996) Lee, H.-H., Herbst, E., Pineau des Forets, G., Roueff, E., & Le Bourlot, J. 1996, A&A, 311, 690
- Lee et al. (1998) Lee, H.-H., Roueff, E., Pineau des Forets, G., et al. 1998, A&A, 334, 1047
- Lindsay & McCall (2001) Lindsay, C. M. & McCall, B. J. 2001, Journal of Molecular Spectroscopy, 210, 60
- Liszt (2006) Liszt, H. S. 2006, Royal Society of London Philosophical Transactions Series A, 364, 3049
- McCall et al. (1998) McCall, B. J., Geballe, T. R., Hinkle, K. H., & Oka, T. 1998, Science, 279, 1910
- McCall et al. (2002) McCall, B. J., Hinkle, K. H., Geballe, T. R., et al. 2002, ApJ, 567, 391
- McCall et al. (2004) McCall, B. J., Huneycutt, A. J., Saykally, R. J., et al. 2004, Phys. Rev. A, 70, 052716
- McCall et al. (2003) McCall, B. J., Huneycutt, A. J., Saykally, R. J., et al. 2003, Nature, 422, 500
- McElroy et al. (2013) McElroy, D., Walsh, C., Markwick, A. J., et al. 2013, A&A, 550, A36
- McKee & Ostriker (2007) McKee, C. F. & Ostriker, E. C. 2007, ARA&A, 45, 565
- Öberg et al. (2009a) Öberg, K. I., Linnartz, H., Visser, R., & van Dishoeck, E. F. 2009a, ApJ, 693, 1209
- Öberg et al. (2009b) Öberg, K. I., van Dishoeck, E. F., & Linnartz, H. 2009b, A&A, 496, 281
- Oka (2004) Oka, T. 2004, Journal of Molecular Spectroscopy, 228, 635
- Oka (2013) Oka, T. 2013, Chemical Reviews, 113, 8738
- Okumura et al. (2013) Okumura, M., McCall, B. J., & Geballe, T. R. 2013, The Journal of Physical Chemistry A, 117, 9305
- Pagani et al. (2011) Pagani, L., Roueff, E., & Lesaffre, P. 2011, ApJ, 739, L35
- Pagani et al. (2009) Pagani, L., Vastel, C., Hugo, E., et al. 2009, A&A, 494, 623
- Pan & Padoan (2009) Pan, L. & Padoan, P. 2009, ApJ, 692, 594
- Petrignani et al. (2011) Petrignani, A., Altevogt, S., Berg, M. H., et al. 2011, Phys. Rev. A, 83, 032711
- Plašil et al. (2002) Plašil, R., Glosík, J., Poterya, V., et al. 2002, International Journal of Mass Spectrometry, 218, 105
- Price et al. (2003) Price, R. J., Viti, S., & Williams, D. A. 2003, MNRAS, 343, 1257
- Quack (1977) Quack, M. 1977, Molecular Physics, 34, 477
- Rachford et al. (2009) Rachford, B. L., Snow, T. P., Destree, J. D., et al. 2009, ApJS, 180, 125
- Rachford et al. (2002) Rachford, B. L., Snow, T. P., Tumlinson, J., et al. 2002, ApJ, 577, 221
- Rimmer et al. (2012) Rimmer, P. B., Herbst, E., Morata, O., & Roueff, E. 2012, A&A, 537, A7
- Savage et al. (1977) Savage, B. D., Bohlin, R. C., Drake, J. F., & Budich, W. 1977, ApJ, 216, 291
- Semenov et al. (2010) Semenov, D., Hersant, F., Wakelam, V., et al. 2010, A&A, 522, A42
- Semenov et al. (2006) Semenov, D., Wiebe, D., & Henning, T. 2006, ApJ, 647, L57
- Sipilä et al. (2013) Sipilä, O., Caselli, P., & Harju, J. 2013, A&A, 554, A92
- Snow & McCall (2006) Snow, T. P. & McCall, B. J. 2006, ARA&A, 44, 367
- Spaans (1996) Spaans, M. 1996, A&A, 307, 271
- Sternberg & Neufeld (1999) Sternberg, A. & Neufeld, D. A. 1999, ApJ, 516, 371
- Talbi & Saxon (1988) Talbi, D. & Saxon, R. P. 1988, J. Chem. Phys., 89, 2235
- Tom et al. (2009) Tom, B. A., Zhaunerchyk, V., Wiczer, M. B., et al. 2009, J. Chem. Phys., 130, 031101
- van der Tak (2006) van der Tak, F. F. S. 2006, Royal Society of London Philosophical Transactions Series A, 364, 3101
- van der Tak & van Dishoeck (2000) van der Tak, F. F. S. & van Dishoeck, E. F. 2000, A&A, 358, L79
- van Dishoeck (1987) van Dishoeck, E. F. 1987, in IAU Symposium, Vol. 120, Astrochemistry, ed. M. S. Vardya & S. P. Tarafdar, 51–63
- van Dishoeck et al. (2006) van Dishoeck, E. F., Jonkheid, B., & van Hemert, M. C. 2006, Faraday Discussions, 133, 231
- Varju et al. (2011) Varju, J., Hejduk, M., Dohnal, P., et al. 2011, Physical Review Letters, 106, 203201
- Walmsley et al. (2004) Walmsley, C. M., Flower, D. R., & Pineau des Forêts, G. 2004, A&A, 418, 1035
- Watanabe et al. (2010) Watanabe, N., Kimura, Y., Kouchi, A., et al. 2010, ApJ, 714, L233
- Webber (1998) Webber, W. R. 1998, ApJ, 506, 329