Evidence of very low metallicity and high ionization state in a strongly lensed, star-forming dwarf galaxy at z 3.417††thanks: Based on Large Binocular Telescope (LBT) observations
Abstract
We investigate the gas-phase metallicity and Lyman Continuum (LyC) escape fraction of a strongly gravitationally lensed, extreme emission-line galaxy at , , recently discovered by the CANDELS team. We derive ionization and metallicity sensitive emission-line ratios from H+K band LBT/LUCI medium resolution spectroscopy. shows high ionization conditions, as evidenced by its enhanced [O iii]/[O ii] and [O iii]/H ratios. Consistently, strong-line methods based on the available line ratios suggest that is an extremely metal-poor galaxy, with a metallicity of 12(O/H)7.44 ( 0.05 , placing it among the most metal-poor star-forming galaxies at 3 discovered so far. In combination with its low stellar mass (2108 M⊙) and high star formation rate (5 M⊙ yr-1), the metallicity of is consistent with the extrapolation to low masses of the mass-metallicity relation traced by Lyman-break galaxies at 3, but it is 0.55 dex lower than predicted by the fundamental metallicity relation at 2.5. These observations suggest the picture of a rapidly growing galaxy, possibly fed by the massive accretion of pristine gas. Additionally, deep LBT/LBC in the UGR bands are used to derive a limit to the LyC escape fraction, thus allowing us to explore for the first time the regime of sub- galaxies at 3. We find a 1 upper limit to the escape fraction of 23%, which adds a new observational constraint to recent theoretical models predicting that sub- galaxies at high- have high escape fractions and thus are the responsible for the reioization of the Universe.
Subject headings:
gravitational lensing: strong – galaxies : evolution – galaxies : high redshift – galaxies : abundances – galaxies : starburst – galaxies : fundamental parameters1. Introduction
Recently, van der Wel et al. (2013, hereafter vdW13) presented the serendipitous discovery of the first strong galaxy lens at 1, . This quadrupole lens system was found in the COSMOS field covered by the CANDELS (Grogin et al., 2011; Koekemoer et al., 2011) survey. Using Hubble Space Telescope (HST) near-infrared (NIR) imaging from CANDELS and NIR spectroscopy from the Large Binocular Telescope (LBT), the authors reported a record lens redshift 1.53 0.09 and a strongly magnified (40x) source at redshift 3.417 0.001 (hereafter ). While the lens is a quiescent and relatively massive galaxy, the magnified source was found to be a low-mass (M 108 M⊙), extreme emission-line galaxy (EELG) with unusually high rest-frame [O iii] 5007Å equivalent width (Å).
The scarcity of strong galaxy lenses at high redshift makes the discovery of especially remarkable. Strikingly enough, the probability to find a EELG being lensed by another galaxy appears to be very low, unless these galaxies become significantly more abundant at high- (vdW13). Consistently, a large number of low-mass EELGs at 2 have started to emerge from deep surveys (e.g. van der Wel et al., 2011; Atek et al., 2011; Guaita et al., 2013; Maseda et al., 2013, 2014) and recent observational evidences point to their ubiquitousness at 5-7 (Smit et al., 2013). Low-mass galaxies with extreme nebular content at lower redshift are mostly chemically unevolved systems, characterized by their compacteness, high specific star formation rates (SFR), high ionization and low metallicities, which make them lie offset from the main sequence of galaxies in fundamental scaling relations between mass, metallicity and SFR (e.g. Amorín et al., 2010; Atek et al., 2011; Nakajima & Ouchi, 2013; Ly et al., 2014; Amorín et al., 2014b). At high redshift, however, the full characterization of these properties in intrinsically faint galaxies requires a enormous observational effort (e.g. Erb et al., 2010; Maseda et al., 2013) and detailed studies are mostly restricted to those sources being subject of strong magnification by gravitational lensing (e.g. Fosbury et al., 2003; Richard et al., 2011; Christensen et al., 2012; Brammer et al., 2012; Belli et al., 2013; Wuyts et al., 2012).
The aim of this Letter is to fully characterize the lensed EELG at presented by vdW13. This unique galaxy will serve to investigate two key issues. Using the deepest available LBT photometry and spectroscopy we will first derive robust estimates of the ionization and metallicity properties of through strong emission line ratios. This provide additional hints on the evolutionary stage of the galaxy and allows to add new constrains to the low-mass end of the mass-metallicity-SFR relation at 3.4. Finally, will offer the opportunity to derive, for the first time, a limit to the Lyman Continuum (LyC) escape fraction at in the sub- regime, as suggested by Vanzella et al. (2012).
| () | 150.07697 | 3.417 | |
|---|---|---|---|
| () | 2.36076 | [O ii] 3727,3729/H | 0.30 |
| -17.80.3 | [O iii] 4959/H | 1.441.35 | |
| [O iii] 5007/H | 4.471.25 | ||
| M⋆ [M⊙] | [Ne iii] 3868/H | 0.20 | |
| SFR [M⊙ yr-1] | 52 |
-
Notes: -band absolute magnitude, stellar reddening, star formation rate and stellar mass were derived from the SED fitting after correction for magnification (van der Wel et al., 2013). Line fluxes are given relative to F(H)=1.
2. Spectroscopic data and measurements
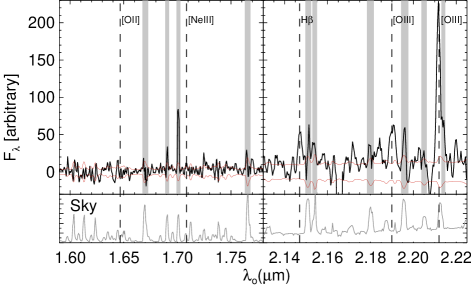
In order to derive line ratios for , we re-analyse the LBT/LUCI NIR spectrum presented by vdW13 and shown in Fig. 1. It consists of a 3-hour sequence of individual, dithered 120s exposures using the HK grism in a 1 wide slit and seeing 0.6. The spectrum was calibrated in wavelength and corrected by telluric absorption, but an absolute flux calibration was not possible (see vdW13). Full details on the reduction procedure are discussed in a forthcoming paper Maseda et al. (2014).
Alternatively, we determine a relative flux calibration between the spectra coming from the two grisms, and , after computing the integral flux of the two spectral ranges and their corresponding colour ()spec. Then, we compare ()spec and the analogue colour, ()phot, derived from the NEWFIRM Medium Band Survey (NMBS) multiwavelength catalogue (Whitaker et al., 2011). We find the difference between the two measurements 10%, so we conclude that uncertainties due to flux calibration in the derived flux ratios involving lines in the blue and red part of the spectrum are not significant.
Integrated fluxes and uncertainties for the three emission lines detected in the spectrum, namely H, and [O iii] 4958,5007Å, were measured using the IRAF task splot, by summing all the pixels of the emission line after a linear subtraction of the continuum. Uncertainties are derived following Amorín et al. (2010). We do not detect any line above 3 in the band spectrum. However, it is still possible to place stringent upper limits for [O ii] and [Ne iii] emission lines as 5, where is the integral rms noise of the spectrum over the total velocity width expected for the line. For the latter we assume the average width of the detected [O iii] lines (13Å).
Emission line ratios are computed after de-reddening the derived fluxes and upper limits using the Calzetti et al. (2000) extinction law. Apart of H, no other Balmer lines are detected in the spectrum due to sensitivity limits. Thus, based on the stellar reddening derived by vdW13, , we assume here ( uncertainty in ), consistently with the mean found for low-mass galaxies of similar EW[O iii] in Amorín et al. (2012, 2014a, 2014b). Clearly, using a higher extinction we derive even more conservative upper limits in metallicity. However, we note that a factor of 2 higher in extinction should not significantly affect our results.
3. Emission line and metallicity properties
In Table 1 we present the emission-line ratios and upper limits relative to H derived for , along with other physical properties taken from vdW13. The available line ratios are used in Fig. 2 to study the ionization and metallicity properties of through different diagnostic diagrams. In particular, the [O iii]/H and [O ii]/H line ratios suggest that is a high excitation, low-metallicity galaxy. Consistently, the remarkably low [O ii]/[O iii] ratio suggests an unusually high ionization. This is confirmed by the high ionization parameter, cm s-1, derived from the ionization-sensitive ratio [O ii]/[O iii] and adopting the calibration based on photoionization models by Levesque & Richardson (2014). Being higher than those found in normal galaxies, the derived is only comparable to those found in other EELGs (e.g. Nakajima & Ouchi, 2013; Ly et al., 2014; Amorín et al., 2014a, b).
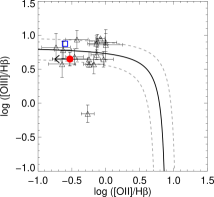
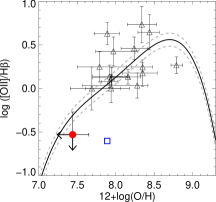
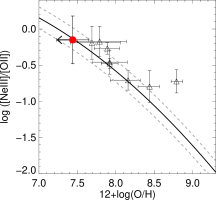
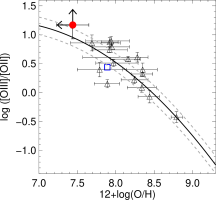
Strong telluric absorption makes it impossible to detect the faint sensitive auroral line [O iii]4363Å, precluding a direct determination of the oxygen abundance. Alternatively, we use the set of collisionally excited emission lines available for to derive its metallicity following a strong-line method based on the (([O ii][O iii)]/H) parameter, which shows a well-known bi-valued relation with . In particular, here we use the calibration and the method proposed and explained in detail by Maiolino et al. (2008). The use of this calibration give us the possibility of comparing our results with other LBGs at similar redshift (e.g. Troncoso et al., 2014).
In short, this method combines the calibration of and other nebular line ratios as a function of metallicity, as shown in Fig. 2. In the low metallicity regime ( 0.5) these relations are calibrated using local galaxies with direct () metallicities, while at higher they are based on photoionization models. This method has the advantage that at least two of the relations involved increase monotonically with , so they can remove the degeneracy in the relation. In particular, shows a remarkably low [O ii] upper limit, which makes any diagnostic based on such line, e.g. [O ii]/H vs. or [O iii]/[O ii] vs. in Fig. 2, almost conclusive about this object being extremely metal-poor. In practice, we solve the calibrations shown in Fig. 2 simultaneously and iteratively. An uncertainty of a factor of 2 in the adopted E(B-V)gas has been propagated to the error bars shown in Fig. 2. Finally, the best metallicity limit that satisfy the various emission-line ratios is by adopting the lower branch, resulting in an upper limit in metallicity 12(O/H)7.440.2 at 68% confidence level.
4. Discussion
4.1. The low-mass end of the mass metallicity relation at z3.4
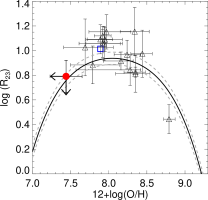
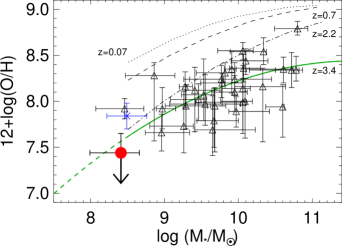
At redshift 2-3, where massive galaxies are rapidly assembling most of their present-day stellar mass (Hopkins & Beacom, 2006), the mass-metallicity relation (MZR) traced by luminous LBGs shows significant evolution (Erb et al., 2006; Maiolino et al., 2008; Mannucci et al., 2009; Troncoso et al., 2014). However, due to the challenge that measuring metallicities represents and poor statistics, the shape and normalization of the MZR at 3 are still poorly constrained, especially in its low-mass end. Thus it is particularly interesting to study the position of in the MZR.
In Figure 3 we use our metallicity limit and the stellar mass111Stellar masses have been derived following Finkelstein et al. (2012) by fitting models accounting for nebular (line plus continuum) emission to the lens-subtracted SED of the source in four HST bands, which correspond to rest-frame UV. Photometry at longer wavelengths (optical rest-frame) were not included as source plus lens emission could not be deblended. However, we note that the sum of the best-model luminosities in the optical (rest-frame) for lens and source appears consistent, being only slightly lower than the total observed luminosities after de-magnification (see Fig.3 in vdWel13). derived by vdWel13 to show the good agreement found between the position of and the extrapolation to low stellar masses of the MZR traced by more massive LBGs at 3. Compared to the other few galaxies of similar or slightly higher masses and redshift, the upper limit in metallicity of is 0.5 dex lower.
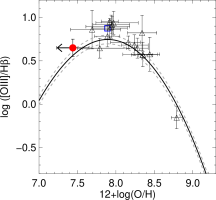
The scatter and normalization of the MZR at low- have been associated to the star formation activity and to the presence of intense gas flows in a tight relation between mass, metallicity and SFR, the so-called “Fundamental Metallicity Relation” (FMR, Mannucci et al., 2010). According to the FMR, at a given stellar mass, galaxies with higher SFR do have lower metallicities (see also Pérez-Montero et al., 2013). In contrast to the MZR, the FMR has been found to persist in galaxies out to redshift 2.5 (Mannucci et al., 2011; Belli et al., 2013). However, at 3 most LBGs studied so far, e.g. those in the AMAZE and LSD samples, are found to be more metal-poor than predicted by the FMR. This may suggest a change in the mechanisms giving origin to the FMR or a strong selection effect at these redshifts (Troncoso et al., 2014). Alternatively, it may suggest that metallicity calibrations based on local galaxies could not apply to high- galaxies due to their comparatively higher excitation/ionization conditions (Kewley et al., 2013). Also, recent studies on local galaxies using integral field spectroscopy have questioned the validity of the FMR as due to aperture biases (Sánchez et al., 2013).
In Figure. 3 we reproduce the results by Troncoso et al. (2014) for the FMR and include the position of using the extrapolation of the FMR to low stellar masses by Mannucci et al. (2011). Clearly, the metallicity of is at least 0.55 dex lower than predicted by the FMR.
The very low metallicity, high specific SFR ( 10-8 yr-1) and extremely high EWs of are indicative of a rapidly growing galaxy in an early stage of its evolution. The offset position found in the MZR and FMR by at least 1 dex and 0.5 dex, respectively, compared to the local relations suggests the action of massive gas flows (e.g. Dayal et al., 2013). One interesting possibility is that the recent star formation in is being fed by massive accretion of pristine gas in the cold-gas flows mode, as predicted by cosmological simulations as the main mode of build-up galaxies at these redshifts (e.g. Dekel et al., 2009) and supported by observational evidences in some low-metallicity starbursts (Cresci et al., 2010; Sánchez Almeida et al., 2014).

4.2. The first estimation of Lyman Continuum escape fraction in the very low luminosity regime
The discovery of also offer the great opportunity to derive one of the first limits to the LyC escape fraction at in a regime of very low intrinsic luminosity ( 0.05), as suggested by Vanzella et al. (2012). The photometry of this object has been derived by Boutsia et al. (2014) from deep LBC data in the filters used in that work to search for LBGs at . This lensed galaxy has AB magnitudes , and an upper limit at 1. Note that this galaxy was not selected as an LBG candidate in Boutsia et al. (2014) due to its color , which is slightly redder than the typical color cut adopted. This is due to the fact that, as shown in vdW13, the SED of this galaxy is contaminated by the lens galaxy, an elliptical at .
Using the LBC photometry alone, we can derive a limit to the LyC escape fraction for the lensed galaxy, adopting the same technique already used in Boutsia et al. (2011). To get rid of the light contamination by the elliptical , we have checked the photometry in the ACS band , which is the closest HST band to our filter. The total magnitude of the lens+source system is , equal to our band magnitude. Thus we can safely assume that the contribution by the lens is corresponding to and the corrected magnitude of is . Adopting the upper limit in the band as an estimate for the maximum flux emitted by the lensed source and using the corrected band flux, we derive the relative escape fraction simply by
| (1) |
As in Boutsia et al. (2011), we adopt a value of 3 as an estimate for the intrinsic ratio . Following Prochaska et al. (2009) we derive a correction for the IGM transmission of at the redshift of the source, . We thus obtain an upper limit to the escape fraction of 23.2% at 1 confidence level. While this limit is not so stringent with respect to other estimates in the literature at z=3 (e.g. Boutsia et al., 2011; Vanzella et al., 2010; Mostardi et al., 2013), it is nonetheless important since we are probing an intrinsic luminosity regime still unexplored before this work. The source magnitude corrected for lensing is , corresponding to an absolute magnitude of or equivalently to , assuming a typical value . This is equivalent to a depth of 32.9 magnitudes in the band, after correcting our upper limit for the magnification factor.
A number of theoretical models (e.g. Nakajima & Ouchi, 2013; Paardekooper et al., 2013; Ferrara & Loeb, 2013; Dijkstra et al., 2014) are investigating the processes involved during the end of the so-called “Dark Ages”. The main-stream under all these models is that the sources responsible for re-ionizing the Universe are dwarf galaxies (sub-) at . Some of these works are also assuming a LyC escape fractions greater than 30-50% even at lower redshifts (e.g. Nakajima & Ouchi, 2013; Dijkstra et al., 2014).
Due to IGM absorption increasing with redshift, the LyC escape fraction can only be directly measured up to . For this reason our limit on the from an ultra-faint galaxy provides an interesting input to reionization model predictions, under the assumption that faint galaxies such as are representative of the whole faint galaxy population at . In fact, our stringent 23% limit is at the lowest boundary of the range % which, according to recent observational evidence (Finkelstein et al., 2012; Grazian et al., 2012), allows star-forming galaxies to keep the IGM ionized at .
Our current results for highlight the strength of strong lensing techniques to study the properties of low-mass star-forming galaxies at 3. If, as expected, analogs of are ubiquitous at higher redshifts, forthcoming data from the CANDELS survey and the HST Frontier Fields Initiative and its spectroscopic follow-ups, will likely provide a statistically significant number of such systems, needed to derive more stringent limits to the escape fraction of LyC photons by ultra-faint galaxies and to study in larger detail the mechanisms driving the early phases of galaxy formation.
References
- Amorín et al. (2010) Amorín, R. O., Pérez-Montero, E., & Vílchez, J. M. 2010, ApJ, 715, L128
- Amorín et al. (2012) Amorín, R., Pérez-Montero, E., Vílchez, J. M., & Papaderos, P. 2012, ApJ, 749, 185
- Amorín et al. (2014a) Amorín, R., Pérez-Montero, E., Contini, T., et al. 2014, arXiv:1403.3441
- Amorín et al. (2014b) Amorín, R., Sommariva, V., Castellano, M., et al. 2014, arXiv:1403.3692
- Atek et al. (2011) Atek, H., Siana, B., Scarlata, C., et al. 2011, ApJ, 743, 121
- Belli et al. (2013) Belli, S., Newman, A. B., & Ellis, R. S. 2013, arXiv:1311.3317
- Boutsia et al. (2011) Boutsia, K., Grazian, A., Giallongo, E., et al. 2011, ApJ, 736, 41
- Boutsia et al. (2014) Boutsia, K. et al. 2014, A& A, in press
- Brammer et al. (2012) Brammer, G. B., Sánchez-Janssen, R., Labbé, I., et al. 2012, ApJ, 758, L17
- Calzetti et al. (2000) Calzetti, D., Armus, L., Bohlin, R. C., et al. 2000, ApJ, 533, 682
- Christensen et al. (2012) Christensen, L., Richard, J., Hjorth, J., et al. 2012, MNRAS, 427, 1953
- Cresci et al. (2010) Cresci, G., Mannucci, F., Maiolino, R., et al. 2010, Nature, 467, 811
- Dayal et al. (2013) Dayal, P., Ferrara, A., & Dunlop, J. S. 2013, MNRAS, 430, 2891
- Dekel et al. (2009) Dekel, A., Birnboim, Y., Engel, G., et al. 2009, Nature, 457, 451
- Dijkstra et al. (2014) Dijkstra, M., Wyithe, S., Haiman, Z., Mesinger, A., & Pentericci, L. 2014, arXiv:1401.7676
- Erb et al. (2006) Erb, D. K., Shapley, A. E., Pettini, M., et al. 2006, ApJ, 644, 813
- Erb et al. (2010) Erb, D. K., Pettini, M., Shapley, A. E., et al. 2010, ApJ, 719, 1168
- Ferrara & Loeb (2013) Ferrara, A. & Loeb, A. 2013, MNRAS, 431, 2826
- Fosbury et al. (2003) Fosbury, R. A. E., Villar-Martín, M., Humphrey, A., et al. 2003, ApJ, 596, 797
- Finkelstein et al. (2012) Finkelstein, S. L., Papovich, C., Ryan, R. E., et al. 2012, ApJ, 758, 93
- Grazian et al. (2012) Grazian, A., Castellano, M., Fontana, A., et al. 2012, A&A, 547, A51
- Grogin et al. (2011) Grogin, N. A., Kocevski, D. D., Faber, S. M., et al. 2011, ApJS, 197, 35
- Guaita et al. (2013) Guaita, L., Francke, H., Gawiser, E., et al. 2013, A&A, 551, A93
- Hopkins & Beacom (2006) Hopkins, A. M., & Beacom, J. F. 2006, ApJ, 651, 142
- Kewley et al. (2013) Kewley, L. J., Dopita, M. A., Leitherer, C., et al. 2013, ApJ, 774, 100
- Koekemoer et al. (2011) Koekemoer, A. M., Faber, S. M., Ferguson, H. C., et al. 2011, ApJS, 197, 36
- Levesque & Richardson (2014) Levesque, E. M., & Richardson, M. L. A. 2014, ApJ, 780, 100
- Ly et al. (2014) Ly, C., Malkan, M. A., Nagao, T., et al. 2014, ApJ, 780, 122
- Maiolino et al. (2008) Maiolino, R., Nagao, T., Grazian, A., et al. 2008, A&A, 488, 463
- Mannucci et al. (2009) Mannucci, F., Cresci, G., Maiolino, R., et al. 2009, MNRAS, 398, 1915
- Mannucci et al. (2010) Mannucci, F., Cresci, G., Maiolino, R., Marconi, A., & Gnerucci, A. 2010, MNRAS, 408, 2115
- Mannucci et al. (2011) Mannucci, F., Salvaterra, R., & Campisi, M. A. 2011, MNRAS, 414, 1263
- Maseda et al. (2013) Maseda, M. V., van der Wel, A., da Cunha, E., et al. 2013, ApJ, 778, L22
- Maseda et al. (2014) Maseda, M., et al. ApJ, submitted
- Mostardi et al. (2013) Mostardi, R. E. et al. 2013, ApJ, 779, 65
- Nagao et al. (2006) Nagao, T., Maiolino, R., & Marconi, A. 2006, A&A, 459, 85
- Nakajima & Ouchi (2013) Nakajima, K., & Ouchi, M. 2013, arXiv:1309.0207
- Paardekooper et al. (2013) Paardekooper, J-P. et al. 2013, MNRAS, 429L, 94
- Pérez-Montero et al. (2013) Pérez-Montero, E., Contini, T., Lamareille, F., et al. 2013, A&A, 549, A25
- Prochaska et al. (2009) Prochaska, J. X., Worseck, G., & O’Meara, J. M. 2009, ApJ, 705, L113
- Richard et al. (2011) Richard, J., Jones, T., Ellis, R., et al. 2011, MNRAS, 413, 643
- Sánchez et al. (2013) Sánchez, S. F., Rosales-Ortega, F. F., Jungwiert, B., et al. 2013, A&A, 554, A58
- Sánchez Almeida et al. (2014) Sánchez Almeida, J., Morales-Luis, A. B., Muñoz-Tuñón, C., et al. 2014, ApJ, 783, 45
- Smit et al. (2013) Smit, R., Bouwens, R. J., Labbe, I., et al. 2013, arXiv:1307.5847
- Troncoso et al. (2014) Troncoso, P., Maiolino, R., Sommariva, V., et al. 2014, A&A, 563, A58
- van der Wel et al. (2011) van der Wel, A., Straughn, A. N., Rix, H.-W., et al. 2011, ApJ, 742, 111
- van der Wel et al. (2013) van der Wel, A., van de Ven, G., Maseda, M., et al. 2013, ApJ, 777, L17
- Vanzella et al. (2010) Vanzella, E. et al. 2010, ApJ, 725, 1011
- Vanzella et al. (2012) Vanzella, E. et al. 2012, MNRAS, 424L, 54
- Whitaker et al. (2011) Whitaker, K. E., Labbé, I., van Dokkum, P. G., et al. 2011, ApJ, 735, 86
- Wuyts et al. (2012) Wuyts, E., Rigby, J. R., Gladders, M. D., et al. 2012, ApJ, 745, 86