On the origin of bursts in blue compact dwarf galaxies: clues from kinematics and stellar populations
Abstract
Blue compact dwarf galaxies (BCDs) form stars at, for their sizes, extraordinarily high rates. In this paper, we study what triggers this starburst and what is the fate of the galaxy once its gas fuel is exhausted. We select four BCDs with smooth outer regions, indicating them as possible progenitors of dwarf elliptical galaxies. We have obtained photometric and spectroscopic data with the FORS and ISAAC instruments on the VLT. We analyse their infra-red spectra using a full spectrum fitting technique which yields the kinematics of their stars and ionized gas together with their stellar population characteristics. We find that the stellar velocity to velocity dispersion ratio () of our BCDs is of the order of 1.5, similar to that of dwarf elliptical galaxies. Thus, those objects do not require significant (if any) loss of angular momentum to fade into early type dwarfs. This finding is in discordance with previous studies, which however compared the stellar kinematics of dwarf elliptical galaxies with the gaseous kinematics of star forming dwarfs. The stellar velocity fields of our objects are very disturbed and the star-formation regions are often kinematically decoupled from the rest of the galaxy. These regions can be more or less metal rich with respect to the galactic body, and sometimes they are long lived. These characteristics prevent us from pinpointing a unique trigger of the star formation, even within the same galaxy. Gas impacts, mergers, and in-spiraling gas clumps are all possible star-formation ignitors for our targets.
keywords:
galaxies: dwarf, galaxies: evolution, galaxies: formation, galaxies: kinematics and dynamics, galaxies: stellar content, galaxies: star formation, galaxies: starburst1 Introduction
One of the key questions occupying astrophysicists today is how star formation proceeds in galaxies. What triggers star formation and what ceases it? The reason for this interest is twofold: firstly, observations of stellar light carry most of the information about the Universe, and secondly, the furthest and thus the oldest observable galaxies are actively forming stars.
The near-by blue compact galaxies are the closest approximation of these early days. They have low metallicities and form stars at, for their sizes, extraordinarily high rates. Blue compact dwarf (BCD) galaxies, with sizes of less than 2 kpc and mostly centrally concentrated star formation (Hunter & Elmegreen, 2006), are also locally abundant and thus ideal to study the star-formation processes in detail. Their metallicities range from half to 1/30th of the solar value (Kunth et al., 1988). This class of galaxies can be divided further, depending on the type of galactic body hosting the burst: E-BCDs and I-BCDs, for bursts in smooth dwarf ellipticals or in irregular bodies, respectively, or by the location of the burst: “n” for a nuclear concentrated burst or “i” for pockets of star formation distributed all over the galactic body. For example, iE-BCD will stand for a BCD with a smooth elliptical body and irregularly distributed pockets of star formation (Loose & Thuan, 1986).
| Name | RA DEC | VHelio | Distance | Inclination | D d25 | MHI | MHI/LB | SFRHI | Ngal | |||
|---|---|---|---|---|---|---|---|---|---|---|---|---|
| J2000 | (km s-1) | (Mpc) | (deg) | (arcsec) | (kpc) | (108 M⊙) | (M⊙/L⊙) | (M⊙/yr) | 12+log(O/H) | |||
| Mk324 | J232632.82+181559.0 | 1600 | 24.4 | 38 | 2923 | 3.42.7 | 3.28 | 0.50 | 0.065 | 8.500.20 | 0.09 | 8 |
| Mk900 | J212959.64+022451.5 | 1155 | 18.0 | 43 | 4436 | 3.83.1 | 1.55 | 0.21 | 0.088 | 8.740.20 | 0.38 | 1 |
| UM038 | J002751.56+032922.6 | 1378 | 20.3 | 40 | 3224 | 3.12.4 | 2.90 | 0.72 | 0.038 | 8.150.20 | 0.12 | 3 |
| UM323 | J012646.56-003845.9 | 1915 | 26.7 | 43 | 2416 | 3.12.1 | 4.23 | 1.03 | 0.111 | 7.700.20 | 0.24 | 10 |
While star formation in dwarf galaxies (like dwarf irregulars, dIrrs) is not unusual, it is the intensity and the concentration of the bursts in the BCDs that makes them special. The BCDs are usually more compact than the dIrrs and experience massive bursts of star formation with high specific star-formation rates (the star-formation within the scale length, Hunter & Elmegreen 2004). This, combined with their typical gas content of about 50 percent of their mass or more (Zhao et al., 2013), results in gas exhaustion times of less than 1 Gyr (Gil de Paz et al., 2003). Hence, we must be witnessing an extraordinary process, possibly transforming these galaxies into early type dwarfs.
Dwarf galaxies are not efficient at transforming their gas into stars. The reasons are that, on one side, the gas density is lower in dwarfs, and on the other, that their shallow gravitational potentials allow even a few supernova explosions to heat the gas, ceasing further condensation into stars in almost the full galactic body. These observationally proven and theoretically backed facts (Bigiel et al., 2010; Hunter et al., 2012; Schroyen et al., 2013) are in contradiction with the observed bursts in BCDs. A possible solution to this problem can be offered by sequential triggering of star-formation (Gerola et al., 1980), cloud impact (Gordon & Gottesman, 1981), mergers (Bekki, 2008), tidal effects (van Zee et al., 1998). Based on the disturbed Hα velocity fields and irregular optical morphologies of the BCDs, many observational studies support that the burst of star formation is triggered by dwarf galaxy mergers or gas accretion (e.g. Östlin et al., 2004) .
Here, we will try to distinguish between different burst-triggering mechanisms by comparing the stellar, ionized gas and neutral gas kinematical data of a sample of blue compact dwarfs. We will also study their stellar population properties and try to anticipate the possible outcome of a BCD when the burst is over. Our paper is organized as follows: in Sect. 2 we will present the data and describe the analysis tools, in Sect. 3 we will present our results which will be followed by discussions (Sect. 4) and conclusions (Sect. 5).
2 Data & Analyses
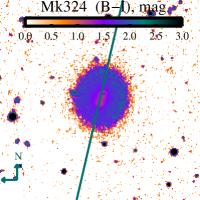
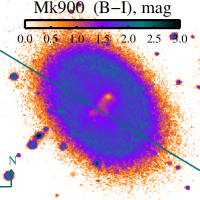
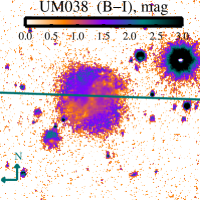
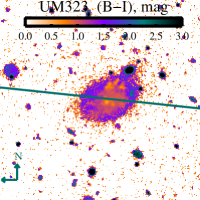
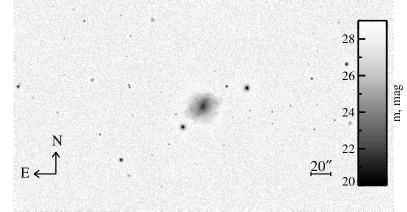
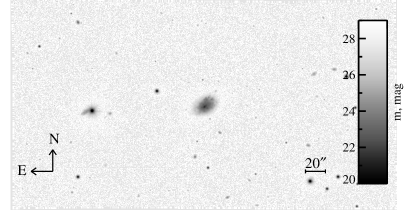
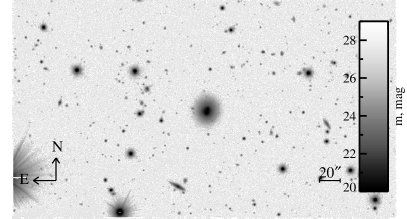
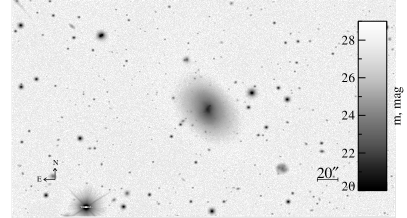
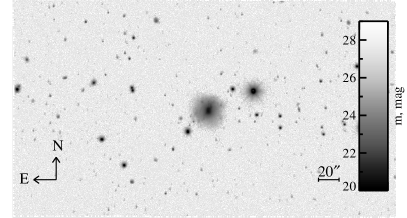
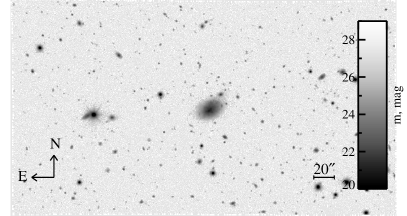
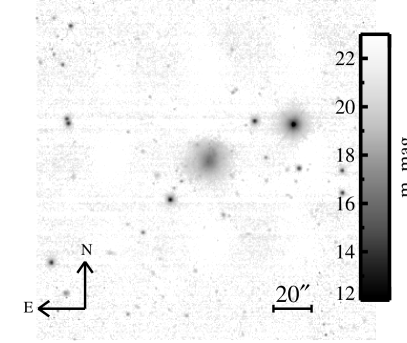
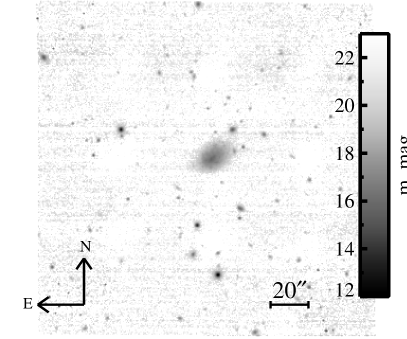
To investigate the resemblance between dwarf ellipticals and BCDs we selected four E-BCDs from the sample of van Zee et al. (2001). The basic characteristics of these objects are described in Table LABEL:table:sample and their () images are displayed in Fig. 1. Since their bodies have a smooth appearance of an early type dwarf, one may expect that if the gas is removed/exhausted and the burst fades they may look like dwarf ellipticals. Their -band magnitudes (Table 3.4) are similar to the luminosities of recent spectroscopical studies of early type dwarfs (De Rijcke et al., 2003; Lisker et al., 2006; Chilingarian et al., 2007; Koleva et al., 2009a; Toloba et al., 2011, to name a few), albeit at the low end. Thus, a comparison between different morphological types is possible.
2.1 Data
We were awarded 26 hours of VLT time to perform spectroscopy and photometry on this sample. In the fall of 2003 we obtained -band images with the ISAAC and -, -band images and long-slit spectra using FORS2. Details about the instrumental setup and the exposure times are listed in Table 2 and Table 3.
2.1.1 Photometry
The standard data reduction steps for the - and -images were performed using midas111http://www.eso.org/sci/software/esomidas/. First a master bias was subtracted and the images were divided by the normalized master twilight flatfield obtained a few days from the observations. The sky was computed using the fit/flat_sky procedure. This procedure consists of manually selecting clear sky regions, fitting them with 2 dimensional polynomials (in this case with degrees of 1,1), averaging this region employing - clipping (with = 2), and finally subtracting it from the original image. Then, the individual exposures were median averaged, performing cosmics rejection. Finally, the images were extinction-corrected and flux-calibrated using the photometric standard stars observed during the same nights as the objects, and reduced with the same procedure.
The basic data reduction for the -band images was done with the ESO pipeline. Background subtraction was done in a 3-step procedure. In the first step, the background is subtracted from each individual image by using a running mean on each pixel. From the background subtracted images a stacked image is created, which is used to create an object mask. In the second step the object mask is used on all individual input images to compute, for each image, a clean background using a - clipping procedure. The background subtracted images were co-added. It turned out that there remained some large scale pattern background (which we attribute to the detector). In a third step we computed a ‘smooth’ background by again applying the object mask to the co-added image and using a high-order polynomial to fit the remaining background. We used the median zero point provided by ESO (25.062 mag) which we cross-checked with our observations of standard stars.
| FORS2 VLT-U4 | |
|---|---|
| CCDs, MIT/LL mosaic# | CCID20-14-5-3 |
| # of pixels | 2 40962068 chips |
| pixel size [m2] | 1515 |
| image scale [arcsec pix-1] | 0.126 |
| readout noise [e- pix-1] | 2.7 / 2.9 |
| gain [ADU (e-)-1] | 0.8 / 0.7 |
| Imaging, Program 072.B-0108(B) | |
| Filter | B_BESS / I_BESS |
| Spectroscopy, Program 072.B-0108(A) | |
| grism | GRIS_1028z |
| slit width [arcsec] | 0.7 |
| spectral range [Å] | 7700 – 9300 |
| FWHM [Å] | |
| [km s-1] | |
| dispersion [Å pix-1] | 0.42 |
| ISAAC VLT-UT3 | |
| Program 072.B-0108(C) | |
| Rockwell Hawaii Hg:Cd:Te arrey | |
| # of pixels | 10241024 |
| pixel size [m2] | 18.518.5 |
| image scale [arcsec pix-1] | 0.1484 |
| readout noise [e- pix-1] | 11 |
| gain [e- ADU-1] | 4.5 |
| filter | J |
| filter [m] | 1.25 |
| filter FWHM [m] | 0.29 |
| Object | Filter | Exposure, s | PA, deg | note |
|---|---|---|---|---|
| Mk324 | 538 | - | - | |
| 627 | - | - | ||
| 1230 | - | - | ||
| GRIS_1028z | 51400 | 77 | minor | |
| GRIS_1028z | 101400 | 167 | major | |
| Mk900 | 538 | - | - | |
| 627 | - | - | ||
| 830 | - | - | ||
| GRIS_1028z | 71314 | 178 | minor | |
| GRIS_1028z | 101314 | 59 | major | |
| Um038 | 538 | - | - | |
| 627 | - | - | ||
| 830 | - | - | ||
| GRIS_1028z | 61400 | 178 | minor | |
| GRIS_1028z | 101400 | 88 | major | |
| Um323 | 538 | - | - | |
| 627 | - | - | ||
| 830 | - | - | ||
| GRIS_1028z | 61400 | 174 | minor | |
| GRIS_1028z | 131400 | 84 | major |
2.1.2 Spectroscopy
The spectroscopic observations were performed in the wavelength range 7700–9300 Å with a reciprocal instrumental resolution () of 5000. The slit aperture was set to 0.7″ and the seeing varied between 0.51-1.44″. We performed a standard data reduction, consisting of bias subtraction, flat-fielding and wavelength calibration with the midas software package. The precision of the wavelength calibrations was checked with ULySS, using the HD201381 (G8III) calibration star observed during our run against the CFLIB interpolator (Wu et al., 2011). This interpolator is a function, which returns a stellar spectrum for a given temperature, gravity and metallicity. We found that the precision of the wavelength calibration is 2 km s-1(1/10th of the original pixel size), while the instrumental velocity dispersion is around 272km s-1 (corrected for the model resolution, see Sect. 2.2.2 for more details), across the full wavelength range. We then used the dispersion relation to derive and subtract a two-dimensional model for the sky background prior to the wavelength calibration, using the method proposed by Kelson (2003). Given the very strong and, fortunately, also curved sky emission lines in this wavelength region, this method provided us with significantly smaller sky residuals than the standard sky subtraction algorithms implemented in e.g. midas.
2.2 Analyses
2.2.1 Photometry
After a careful removal of the sky background, we interpolate over all stars superposed onto the galaxy images. We use a custom computer code to derive the photometric characteristics of the galaxies in the sample. Given an estimate for the galaxy center, the code fits the galaxy’s isophotes with ellipses whose center, axis ratio, and position angle are free parameters (De Rijcke et al., 2003). The deviations of the isophotes from a pure elliptic shape were quantified by expanding the intensity variation along an isophotal ellipse in a fourth order Fourier series. This allows for an accurate determination of the center of the outer isophotes which can be used as an estimate for the ”true” center of the galaxy. Around this center, we used circular isophotes to estimate the total luminosity and the circular half-light radius of each galaxy. Given the irregular nature of these galaxies, such a model-independent way of representing their photometric properties seems appropriate.
The images (Fig. 1) were produced in the following way: prior to the subtraction, we first trimmed the images to 27.2 mag, such that all the values above 27.2 were set to 27.2. The later value is the photometric zero point of Mk324 -band image.
2.2.2 Spectroscopy
We derive the radial distribution of the kinematics and stellar population properties of our sample by means of full spectrum fitting. We use ULySS222http://ulyss.univ-lyon1.fr (Koleva et al., 2009b), a flexible, freely available package, which minimizes the difference between a target spectrum (observations) and interpolated models (templates), using the following expression:
| (1) |
The observations () and the templates () are logarithmically rebinned to the same constant step in velocity prior to the minimization, , where is the wavelength in Angstroms. The multiplicative polynomial (of a degree ) absorbs differences between the model and the observations, resulting from a bad (absent) flux calibration and poor knowledge of the extinction law, while the additive polynomial (, of a degree ) can be used when a hot (featureless) component is expected in the spectrum. We tested an inclusion of in our fits and we concluded that such a component is absent, confirming the adequacy of the sky subtraction. The line-of-sight velocity distribution (LOSVD) is characterized by the object’s radial velocity or the shift of the lines () and their broadening (). In principle, higher orders of the LOSVD can be used, but in our case the quality of the spectra is not sufficient to attempt fitting of the lines’ kurtosis (for symmetric departures from a Gaussian) and skewness (departures from symmetry).
Here we use four different representations of this equation.
-
•
To derive the instrumental broadening (see further) we minimize a spectrum of a star against an interpolator of an empirical spectral stellar library (TGM component in ULySS) as in Wu et al. (2011); Prugniel et al. (2011); Koleva & Vazdekis (2012). In this way we determine the best fitted temperature, gravity, and metallicity (), together with the instrumental broadening. We assume that the physical broadening in the stellar lines is negligible, thus the derived dispersion is a result only of the instrumental dispersion minus the template broadening (squared). Hence, Eq.5 degenerates to:
(2) -
•
To derive the instrumental dispersion of the models (see further) we fit only the LOSVD between two stars. Then we have:
(3) -
•
When we use ULySS to get the kinematical and stellar population properties of our galaxies, represents a single stellar population (SSP) from an interpolated grid of population synthesis models. Here, the SSP is a function of the age () and the metallicity () of the model and we use:
(4) -
•
To derive the gas kinematics, the components () are Gaussians (), whose individual broadenings () and positions () are adjusted during the fit, or:
(5)
The CaT (calcium triplet) region and the CaT index in particular, are usually used as a tracer of the dynamical state of the old stellar population in early type systems (Delisle & Hardy, 1992). However, for relatively young and metal-poor systems, with SSP-equivalent ages below 3 Gyr and metallicities below -0.5 dex, this region can provide valuable information about the underlying stellar population (Vazdekis et al., 2003).
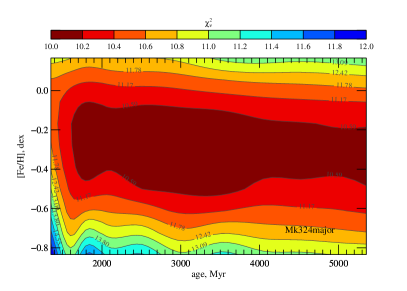
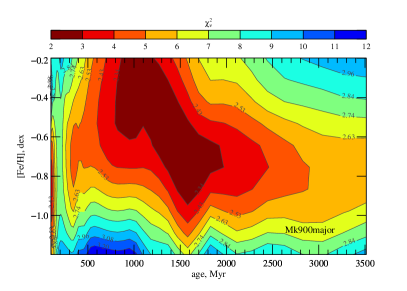
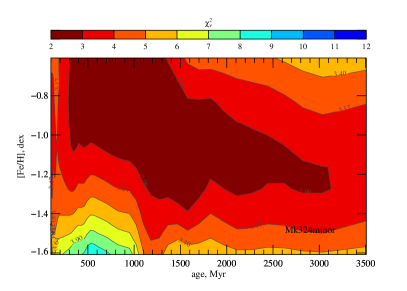
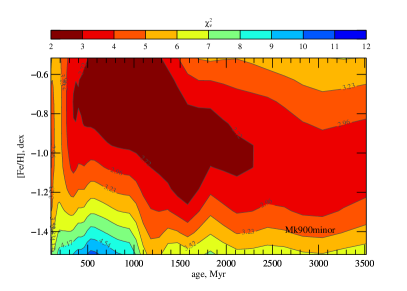
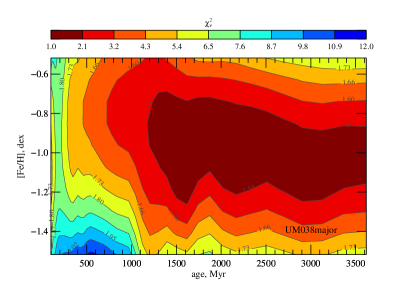
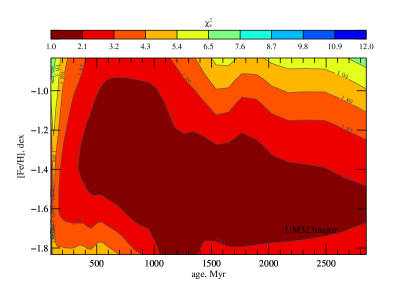
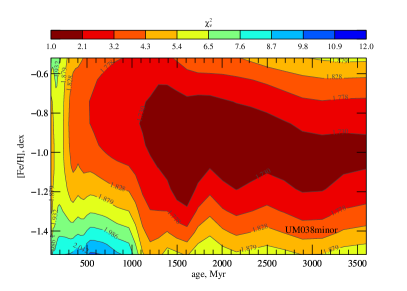
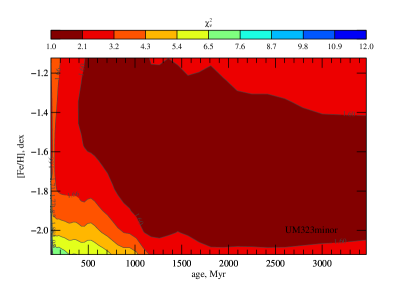
However, the constraints on the ages and metallicities we can obtain from observations do not necessarily comply with theoretical expectations. The latter are derived from very high signal-to-noise stellar population models and do not include the effects of template mismatch. To investigate to what degree the region we fit can constrain the ages and metallicities of galaxies, we extracted one arcsec wide, 1D spectra at the luminosity peaks of the galaxies and we constructed -maps (See Fig. 13). The signal-to-noise ratio (S/N) at the luminosity peak is around 25. We find that, in most cases, we cannot recover ages higher than 1.2 to 1.5 Gyr and the precision of the metallicity is around 0.2 dex. Even at this relatively high S/N the age resolution we get is lower than predicted from theory. This is expected not only because of the intrinsic imperfectness of the data, but also because of the template-mismatch since our knowledge of the stellar evolution in this spectral region is less advanced than in the optical.
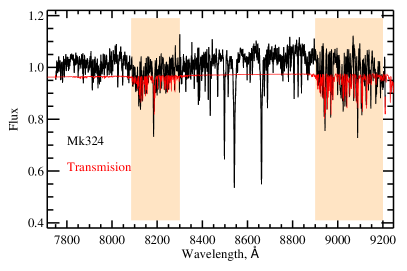
Prior to the fitting we exclude the regions which are strongly affected by the telluric absorption. We computed the atmospheric transmission using the ESO web tool for sky modeling333http://www.eso.org/observing/etc/bin/gen/form?INS.MODE=swspectr+INS.NAME=SKYCALC for our resolution, wavelength coverage and for average sky conditions. The result of the transmission curve can be seen on Fig. 2. From this figure it is clear that the regions between Å and from Å onwards are strongly affected by tellurics and we excluded them from our fits. However, we kept the region around [Siii]at 9068.6 Å, since this emission line is the strongest in our spectra.
Throughout this paper we use the Pegase.HR population synthesis models (Le Borgne et al., 2004) in combination with the CFLIB empirical spectral library (Valdes et al., 2004; Wu et al., 2011) as templates. Our choice of models was driven by the fact that CFLIB contains a reasonable number of stars (1273) covering well the primary atmospheric parameters (effective temperature, gravity and metallicity), and has a high enough spectral resolution (R5000) to allow us to determine the stellar population parameters and the velocity dispersions of our galaxies. To be able to compute the physical dispersion of our galaxies we need to add the template dispersion and subtract the instrumental broadening, quadratically. In Wu et al. (2011) the precise spectral resolution of CFLIB was assessed, but only for the optical spectral range ( Å Å). Here, we aim to derive the spectral resolution in the CaT region. First, we selected a solar-analog star444A star with atmospheric parameters similar to the Sun. from the CFLIB library - HD010307. We fitted (using Eq. 3) its spectrum against an observation of the Sun, from the HyperLeda database with R=10000 ( km s-1) in the region 8400-8900Å. This region is free from telluric lines and has prominent spectral features. We find a velocity dispersion of km s-1, which translates to a resolution of km s-1, when corrected for the template broadening. However, the produced final stellar population models can have slightly higher broadening since the individual stellar spectra are interpolated and added. To check this, we extract a solar analogue from the CFLIB interpolator and again fit it against the same observations of the Sun. We derive a total broadening of 19 km s-1, consistent with the value derived from individual star fitting. We use this value throughout the paper.
3 Results
The results of our photometric analyses are presented in Table 3.4. In young populations, the -band (around 440 nm) is typically dominated by A-type main sequence stars (hot stars), while the - and -bands are dominated (after the first 0.5 Gyr of the star formation) by (cold) red-giant branch stars. The () colour maps are sensitive to young ages but also to metallicity and gravity. In other words, the () colour images can show us the locus of the young population, but can also include effects from the dwarf-to-giant ratio and varying metallicity. Regions where are dominated by horizontal branch stars and young stars on the main sequence. Hence, these values on the colour images indicate possible young populations with ages less than 1 Gyr.
We do not discuss the () images since they are much noisier and do not bring new information. The () images are more sensitive to the metallicity of the RGB. We compute an average () colour of 4.5 with little variations around this value. However, we have spectra which are more sensitive to smaller metallicity changes.
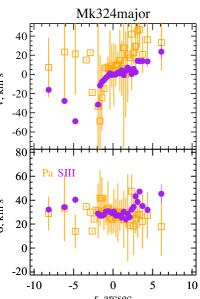
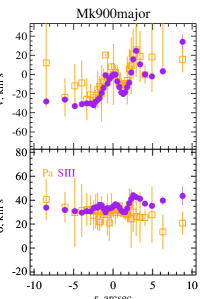
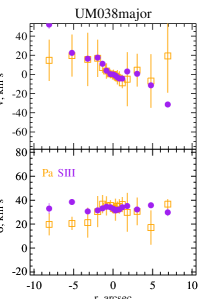
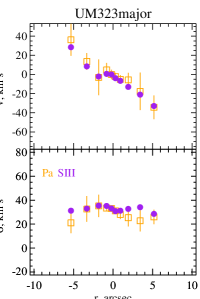
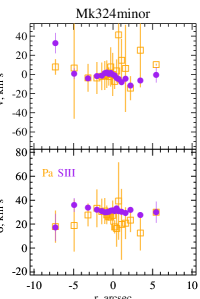
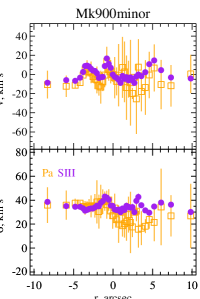
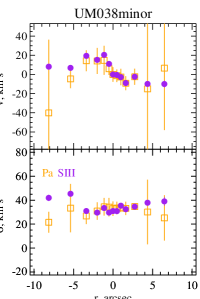
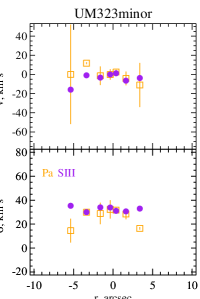
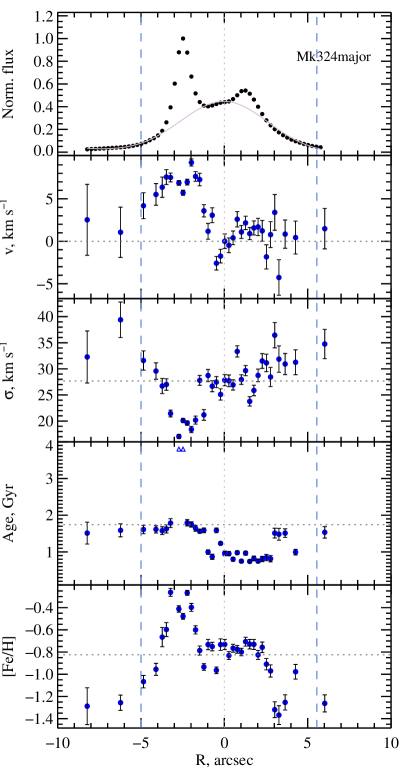
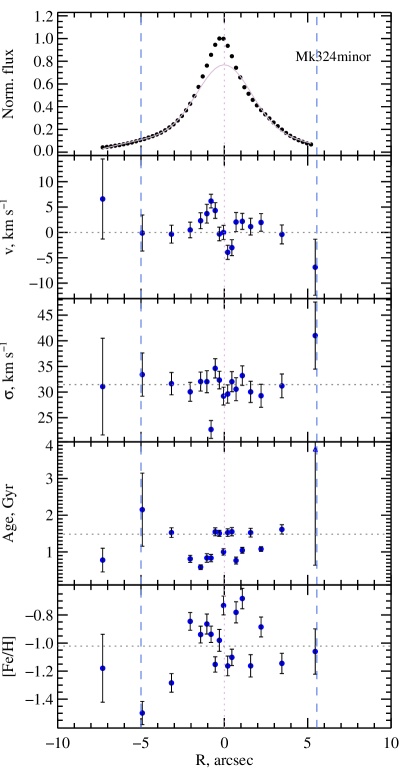
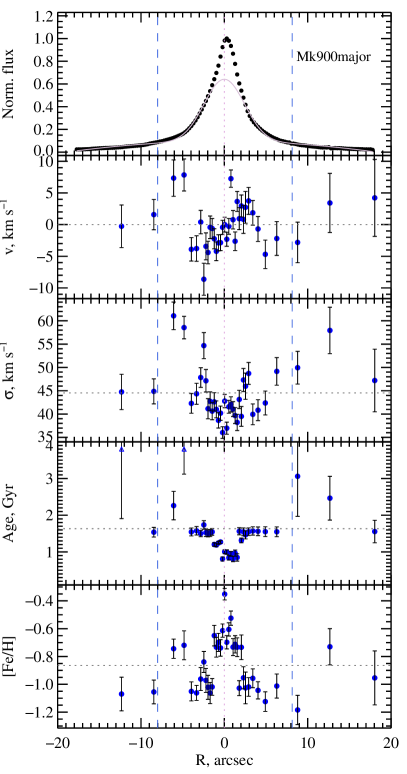
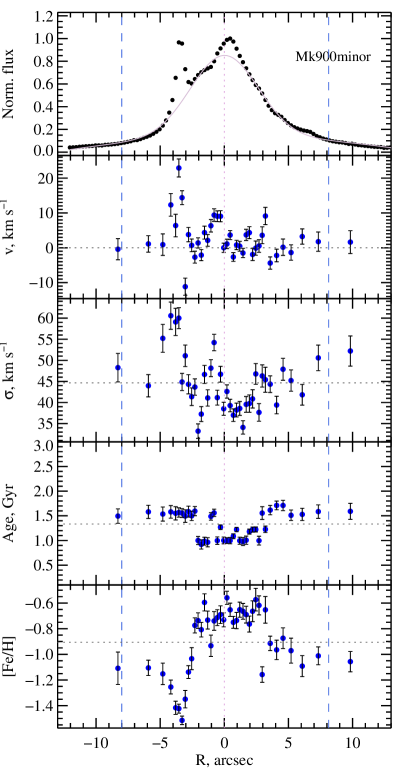
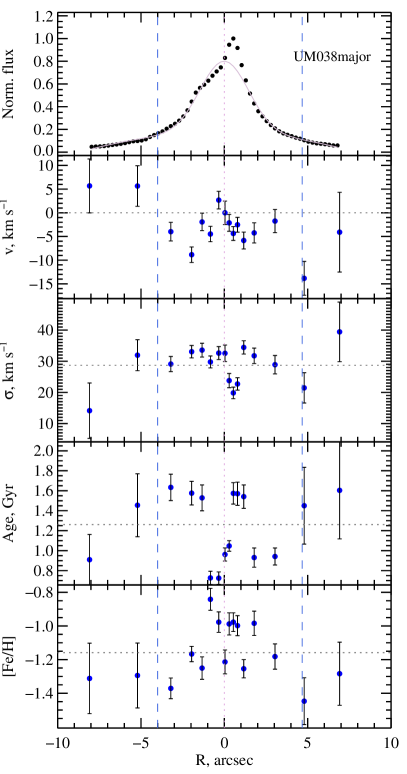
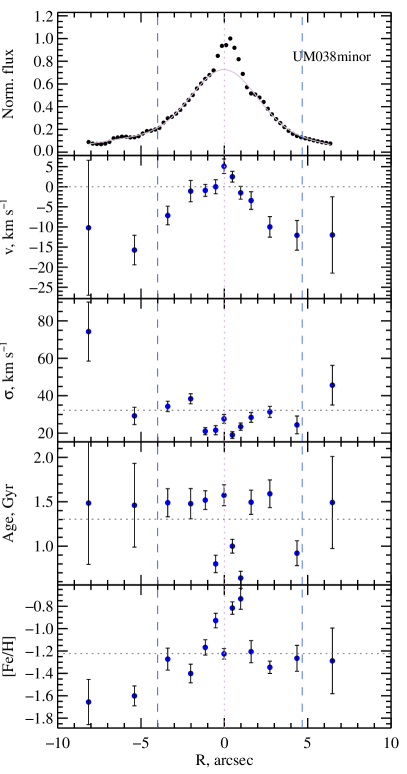
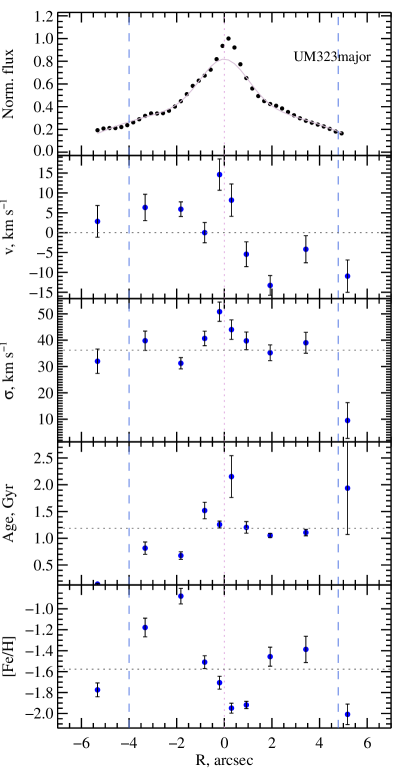
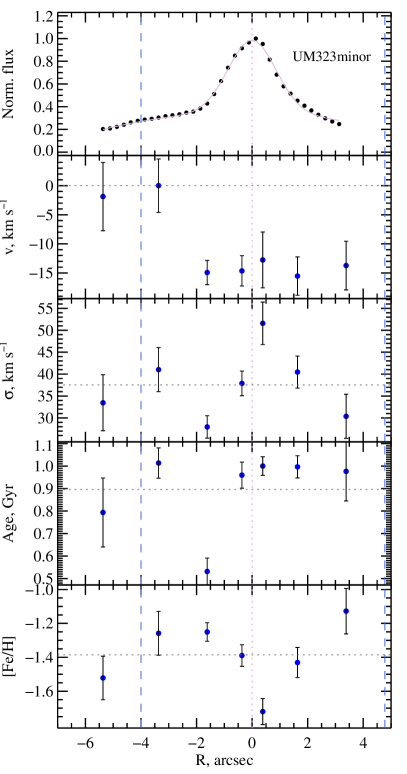
The spectroscopic results from our major and minor axis analyses are presented in Fig. 3 – Fig. 5. The mean values of the stellar parameters (velocity, velocity dispersion, ages and metallicities) are reported in Table 3.4. The data were binned to a S/N of 20. The size of the pixels is around 0.25 arcsec, but the seeing during our observations was around 1 arcsec. Hence, results below 1 arcsec are not independent.
Before discussing the kinematics of the stars we should remember that dwarf galaxies have close to exponential surface brightness profiles and (if isotropic) are expected to reach their maximum velocity at about 2 their effective radius (Prugniel & Simien, 2003). Thus, their reported stellar maximum velocities are only lower limits for the maximum rotation.
A second caveat comes from the fact that since these galaxies are star-forming, it is somewhat tricky to identify the center of the main stellar body. Our galaxies experience mostly off-centered star formation, which seems to have a large influence on their kinematical profiles. To identify the centre of the stellar body we fitted a Gaussian to the luminosity profile through the slit, excluding the main star-formation regions, identified with the help of the () images (Fig. 1).
Finally, the last warning is about the stellar population properties of the galaxies. Though we could measure SSP-equivalent ages and metallicities, they are uncertain especially for ages more than a few Gyr, where the CaT region does not change significantly with time anymore. In other words, the stellar populations with measured ages above 1 Gyr can be anywhere between 1 and 13 Gyr old.
We find that our galaxies have ages between 1 and 4 Gyr and metallicities between 1.6 and 0.4 dex. Their stellar population profiles are rather flat up to one effective radius, but again, as for the kinematics, these profiles are not easily described with a simple linear law. From the -maps (Fig. 13), we see that the determination of the age is not straightforward and the parameter space is basically flat between 1 and 3 Gyr. Due to the age-metallicity degeneracy (Worthey, 1999), also the determination of metallicity is insecure within 0.2 dex. Thus gradients smaller than this value will be difficult to detect.
The velocity dispersions of the four galaxies are roughly between 30 and 40 km s-1. From our 8 profiles of 4 galaxies we do not detect significant rotation, moreover their velocity fields are significantly disturbed. Hence, the v/ stellar ratio is close to 1. However, the star formation region (corresponding to the flux peaks) sometimes seems to have rotation, and in general disturbs the global galactic kinematics.
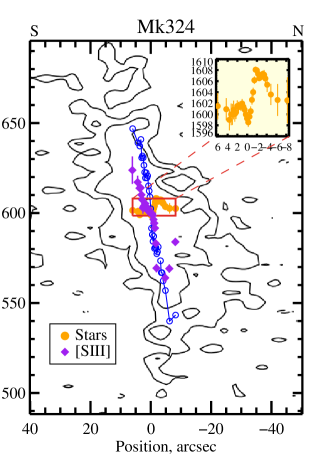
3.1 Mk 324
A good example in this respect is Mk 324 (Fig. 3, left panel), where the bright, star-formation region, between 4 and 1 arcsec along the major axis seems to be almost completely kinematically decoupled from the rest of the galaxy – it has lower velocity dispersion and even a solid body rotation profile. The other, less prominent star-formation region around 2 arcsec also has a lower velocity dispersion. From the colour maps (Fig. 1) we do not see a significant young population. Martínez-Delgado et al. (2007) studied the Hα emission of this galaxy using Fabry-Perot observations. Assuming an instantaneous burst, the authors concluded that 95 per cent of the Hα emission comes from 4 Myr old stars. To check our data sensitivity to such young populations we performed several simulations, mixing different mass fractions of a 10 Myr and a 8 Gyr old population, including all observational effects. Based on these tests, we conclude that the mass fraction of young stars in Mk324 should be less than 1 per cent.
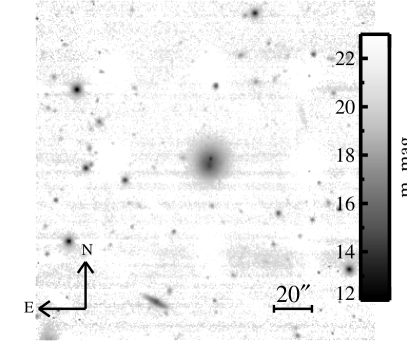
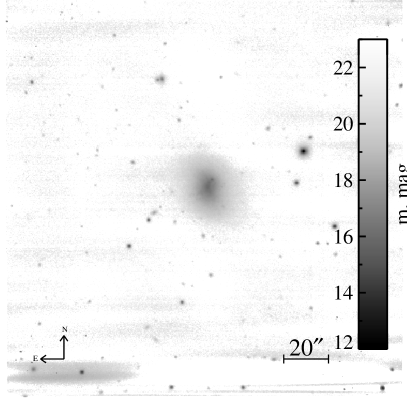
Moreover, it is worth noticing that the individual band images (see Sect. A) are showing a pronounced burst, even visible in the -band image (Fig. 11). From our spectroscopic analysis we see that the regions of star formation seem to have significantly higher metallicity, dex versus the dex of the galactic body. Their SSP-equivalent ages are also older (more than 2-3 Gyr), confirming what we see on the images. We can conclude that we have a relatively long lived burst, kinematically decoupled from the rest of the galaxy, which is massive enough to keep the produced metals and to self-enrich. Mk324 is part of a group with 8 members. The closest companion is PGC5065954 (with -band SDSS apparent magnitude of 16.7 mag), NE, at around 2 Mpc. The orientation of the burst region is perpendicular to this direction. Thus, this star formation activity is unlikely sustained from constant companion disturbance.
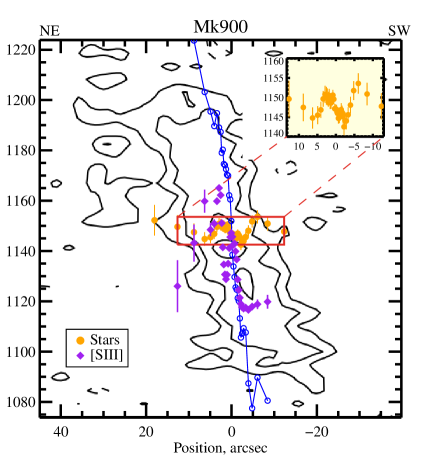
3.2 Mk 900
According to the HyperLeda grouping algorithm, MK900 (NGC7077) has no known companions. Mk900 is the other BCD from our sample with central star formation. Looking into detail at the () image (Fig. 1) we see that the peak of the luminosity of the major axis profile (Fig.4) is actually a region of recent star formation, which is a bit shifted with respect to the centre of the outer isophotes. This star-formation region has lower velocity dispersion and rotates at about 5 km s-1, it has also younger ages (less than 1 Gyr) and higher metallicity (0.7 dex) than the rest of the galaxy, which has a mean age of around 1.7 Gyr and metallicty around 1 dex. The -band image is much smoother than in the case of Mk 324, but we can see peaks of luminosity in this region. The central disk rotation is also visible in the minor axis profile (Fig. 4), as well as the disturbance in the velocity and sigma at 4 arcsec, where another knot of star formation is observed. This knot seems to have somewhat lower metallicity (1.4 dex) than the galactic body.
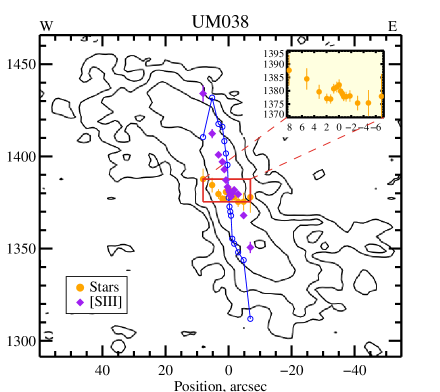
3.3 UM038
For UM038, it seems that the star-formation follows a twisted structure, almost like spiral arms. These structures are most probably produced by differential rotation, which is also noticeable on the Hi maps (see Fig. 7), but only outside 10-20 arcsec (inside this radius the gas and stars rotate like a solid body, see Section 4.2). Spiral-like structures are observed in rotating simulated dwarf galaxies, but they are not stable (Schroyen et al., 2013). UM038 is part of a small group together with another 2 galaxies. They are both to the east, north-east of UM038 and at a projected distance of more than 0.2 Mpc. The major axis of UM038 (Fig. 5) displays, again, an off-centered peak of luminosity associated with disklike rotation and a drop in velocity dispersion. The same structure has slightly higher metallicities ( dex) and younger ages (below 1 Gyr), but this change is not significant. The images in the three bands show the star-formation structure, which seems to become smoother with increasing wavelength. Disk rotation is also visible in the minor axis data (Fig. 5). The velocity profile indicates an offset kinematic center with respect to the slit position, or the luminosity center of the galaxy. This is deduced from the negative velocities going up until the center and then decreasing again. If the minor axis slit was aligned with the center of the rotating disk we would have measured zero rotation, but in this case we have a ’’-like velocity profile. This is at odds with the ionized gas rotation (see further), which is an indication of a misalignment of the stellar and gas rotation axes. The peak of luminosity is at about 0.5 arcsec and this region has slightly lower age and higher metallicity, the star formation there probably appeared at the same time as at the less prominent peak on the negative side of the galaxy, which has basically the same age and metallicity. From Fig. 5 we can see that the maximum velocity we observe in this galaxy is about 10 km s-1, while its velocity dispersion is around 30 km s-1. Hence, its . Its lower limit of the age is 1.5 Gyr and its mean metallicity is dex.
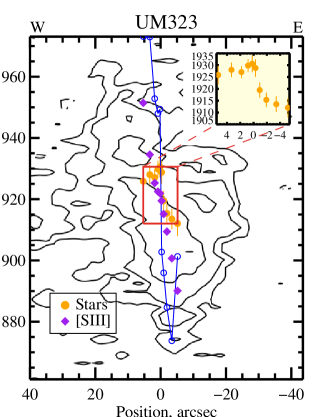
3.4 UM323
The star-formation pockets (hottest parts) of UM323 are forming a crown-like structure which is shifted to the NW with respect to the center of the outer isophotes of the galaxy. The red object at the north, north-west end of UM323, is a galaxy at a redshift of 0.484555http://skyserver.sdss3.org/dr9/en/tools/explore/obj.asp?id=1237663783133118504. The body of UM323 is very regular with a colour of 1.5. The most luminous region along the UM323 major axis (Fig. 6) displays a more turbulent character with a slight increase in velocity dispersion. The ages and metallicities are spread around 1.1 Gyr and 1.6 dex. Its minor axis (Fig. 6) peak of luminosity seems to be shifted from the center with about 3-4 arcsec. The star-forming knot has a velocity difference with the main part of the galaxy of 15 km s-1. Nothing spectacular happens with the ages and metallicities, but we have only 2 points of the main galaxy to compare to.
UM323 is part of a bigger group of galaxies (45 in total). The closest neighboring galaxies are SDSSJ012838.55-004030.8 (SE) and RGK2003]J012616.22-002 (W) with the same radial velocities and at projected distances of more than 0.7 Mpc. In principle these could have interacted with UM323.
| name | MB | Re() | MI | Re() | ||||
|---|---|---|---|---|---|---|---|---|
| (mag) | (mag) | (arcsec) | (kpc) | (mag) | (mag) | (arcsec) | (kpc) | |
| Mk324 | 15.59 | -16.35 | 3.24 | 0.38 | 14.00 | -17.94 | 5.55 | 0.66 |
| Mk900 | 14.59 | -16.69 | 6.90 | 0.60 | 13.11 | -18.17 | 8.14 | 0.71 |
| UM038 | 15.91 | -15.63 | 4.66 | 0.46 | 14.80 | -16.74 | 4.67 | 0.46 |
| UM323 | 16.12 | -16.01 | 4.48 | 0.58 | 15.09 | -17.04 | 4.78 | 0.62 |
3.5 Ionized gas
We identify emission lines of hydrogen, oxygen and sulphur in the observed wavelength region. The [Oi] (8446.4 Å) is rather weak in our spectra, while [Siii] at 9068.6 Å is prominent. The strength of the Paschen lines can vary and it is strongest at the peak of luminosity (the most prominent star-formation regions). After subtracting the stellar continuum we fit the Paschen lines series from Pa9 to Pa17 with wavelengths from 9229.0658 Å to 8467.2989 Å respectively 666For reference, the full list is Pa9 (9229.0658 Å), Pa10 (9014.9596 Å), Pa11 (8862.8316 Å),Pa12 (8750.5203 Å), Pa13 (8665.0656 Å), Pa14 (8598.4381 Å), Pa15 (8545.4289 Å), Pa16 (8502.5287 Å), Pa17 (8467.2989 Å), air wavelengths, as well as [Siii] at 9068.6 Å. We masked these lines during the stellar component fitting, and we fit them a posteriori with independent Gaussians. The results from the individual Pa lines were averaged (removing the outliers). Finally, the center of the profile was shifted in accordance with the main stellar body. Though we wished to investigate any possible differences between the heliocentric velocities of the stars and the gas, we found that the literature values will agree within only 0.5 Å, which is 17km s-1at 8500 Å. The thus produced profiles are presented in Fig.12.
The dispersion of the emission lines is around 30 km s-1and their rotation is of the same order of magnitude as the Hi gas (see next Section). The Pa and [Siii] kinematical profiles agree well with each other, though the results from the Pa lines are more noisy. This is due to the lower intensity of these lines and the limited quality of the data (sky lines, medium S/N), which can propagate errors in the fitting process, like fitting spikes instead of the lines.
The wiggles in the velocity field of Mk 900 (both major and minor axes) coincide with the similar ”wiggles” in the stellar velocity profile. This is an indication that the kinematically separate structures are also present in the gas. For Mk 324 the Pa lines show similar profiles as the stars. The [Siii] line could not be nicely fitted at the strongest burst, because it was either absent (among the noise) or very weak, for the rest [Siii] and Pa emissions follow the general shape of the stars, rotating in a solid body fashion around the center of the minor axis. On the major axis of UM038, the ionized gas displays weak rotation (about 10 km s-1) and one can see the slight flattening at the center, possibly produced by averaging a solid body like rotation. The ionized gas along the minor axis rotates with an amplitude of about 40 km s-1, which is at odds with the offset center for the stellar rotation. In other words, according to the stellar kinematics, our slit must have been offset from the rotation axis (the stars are only approaching us). It means that the rotation axes of the stars and the gas in UM038 do not coincide. In UM323 the gas does not rotate along the minor axis while it clearly rotates along the major axis. We will discuss the similarities and the differences between the stellar and gas dynamics in the following section.
4 Discussions
4.1 Asymmetric drift correction
The observed velocities of galaxies are slowed down with respect to the circular velocity by asymmetric drift when significant dispersion is present. Stars which move on non-circular orbits will spend more time on their apogalacticon, where they have the slowest rotation. Binney & Tremaine (2008) derived the following correction:
| (6) |
Starting from the above formula, we followed Hinz et al. (2001) and derived a simplified formula to correct for the asymmetric drift:
| (7) |
where is the stellar velocity corrected for asymmetric drift, is the azimutal velocity (observed velocity, , corrected for inclination, ), is the radius normalized to the exponential scale length, and is the observed velocity dispersion () corrected for inclination. To derive the scale length of our galaxies we divide the effective radius by 1.678 (Prugniel & Simien, 1997, for exponential profiles). The approximations we use to derive Eq. 7 are the following: (1) the spatial density of stars is assumed to be exponential (as in spiral galaxies); (2) we neglect , which is correct only for relaxed objects, while our objects may not be relaxed yet; (3) looking at the Hi velocity fields (Fig.7) we assume solid body rotation, thus ; (4) finally, no change of the radial velocity dispersion along the radius is imposed by neglecting the term.
The velocity profiles corrected for inclination and asymmetric drift are shown on Fig. 7 with blue circles. Though these corrected velocities are more in line with the Hi velocities, it is clear that the stars are over-corrected since they have higher velocities at a given radius than the Hi gas. This is not surprising since the correction was oversimplified to make it computable.
4.2 Stellar vs. Gas kinematics
One could expect that stars and gas in a galaxy have similar kinematical characteristics, since the former are a product of the latter. However, nature proves to be more complex than this (see for example Östlin et al., 2004). Strong stellar and supernova winds can disturb the gas around a star-formation region, or the stars could be preferentially formed from low angular momentum gas, that fell towards the center of the galaxy (Elmegreen et al., 2012a). External factors also disturb the galactic dynamics, such factors may include mergers or ram-pressure stripping. The latter tends to sweep the gas off the galaxy but does not have much effect on its stars, while the former can be a rather violent event for the host galaxy, combined with star formation and producing irregularities in the gas and stellar kinematics (Verbeke et al., in prep.; Cloet-Osselaer et al., 2014).
Nevertheless, when comparing different classes of dwarf galaxies and investigating the possible connection between them, the gaseous kinematics of star-forming dwarfs (dIrrs, BCDs) are often compared to the stellar kinematics of quiescent dwarfs, like dwarf ellipticals (dEs, e.g. van Zee et al., 2001). The reason for this is obvious - dEs contain little if any gas, while accessing the stellar population characteristics of dIrr or BCD galaxies is challenging because of the overpowering gas and young stars emission.
Here, however, we derived the stellar and ionized gas kinematics of four BCDs and we compare them (Fig. 7) with Hi kinematics from the literature (van Zee et al., 2001). We selected the (mirrored) major axes which are the same as the one chosen from the van Zee et al. positional angles (PA) for maximum Hi rotation (their fig. 12). We smoothed our values with a boxcar running average with a width of two. Thus, we could suppress some local “jumps” resulting from the observational errors, and we can follow the overall behavior.
Despite the relatively different photometric appearances of our galaxies they all seem to follow the same kinematic patterns. The stellar body seems not to rotate or rotates only with a few km s-1. All of the stellar velocities experience central disturbances, indicating a presence of a disk-like structure. The ionized gas mostly follows the Hi, except for the center, where it is following the central stellar disks. In the case of Mk 900 the ionized gas velocity field, seems to have the same pattern as the stars, but with higher amplitudes. The stellar velocities corrected for asymmetric drift () are more consistent with the Hi rotation, but once again they are clearly over-corrected as they will indicate a stellar body rotating faster than the neutral gas.
These observations lead us to speculate that the stellar burst must be triggered by a process which can change/disturb the stellar and gas kinematics, such as an in-falling gas cloud or in-spiraling star formation clumps (see Sect. 4.3). However, some of the star-forming regions have a significantly higher metallicity than the galaxy body, a peculiar rotation velocity, and a higher age indicating that they can remain stable for several Gyr, thus hinting at the presence of dark matter associated with these regions.
4.3 Burst triggering mechanisms
The unusually high star-formation rates in BCDs have been contributed to several processes, including: in-spiraling gas clumps (Elmegreen et al., 2012b), cloud impact(s) (Gordon & Gottesman, 1981), mergers (Bekki, 2008), tidal effects (van Zee et al., 1998). Though Mk324 and UM323 have relatively close companions and interactions cannot be fully excluded it is nevertheless unlikely given that these objects are relatively faint and small (see Sect. 2.2.1 and Fig. 9).
Relatively massive star-formation regions in the galaxies can lose or change their angular momentum by torques with the other galactic components (Elmegreen et al., 2012b) and spiral into the center of the galaxy in analogy to the high- formation of bulges (Elmegreen et al., 2009). This process could explain several of the (unusual) characteristics of BCDs like the high star-formation rate, the dense stellar and gaseous cores (compared to dwarf irregulars) and the differential rotation observed in some BCDs. However, in our sample we have mostly solid body rotation for the Hi and ionized gas, and the stars corrected for asymmetric drift (see Fig. 7 and van Zee et al. 2001) wich makes friction unlikely (Goerdt et al., 2010), except in the outer parts of UM038. On the other side, the bursts in most of the galaxies seem to be relatively longly lived ( Gyr), which can be explained by rejuvenating in-spiraling clumps (Elmegreen et al., 2012b). This process could also explain the star formation regions with both higher and lower metallicities in comparison to the rest of the galaxy, since the metal abundance will depend on the original birthplace of the clumps (assuming chemical inhomogeneity of these galaxies).
Another plausible mechanism, which could explain the star burst in the 4 galaxies in our sample, is an impact with a gas cloud. We run self-consistent, N-body/SPH simulations of impacts between a dwarf galaxy and a gas cloud (Verbeke et al., in prep.). We chose the gas clouds with masses and densities in accordance with observations of high velocity clouds (Wakker & van Woerden, 1997, for a review). We find that such events can indeed trigger a burst of star formation, enhancing the normal star formation level by a factor of ten. Our simulations can also produce star formation regions with different metallicities, depending on whether the star formation material is simply compressed by the incoming gas cloud or if it is the new gas which forms the stars. They could also explain bursts living for about a Gyr, because of the self-induced nature of the star formation - the winds of new stars and supernovæ expel but also compress the gas, provoking new star formation in these condense regions (Gerola et al., 1980). However, having regions with star formation lasting more than a Gyr - which are self-enriched, and have peculiar kinematics - seem to require a presence of dark matter substructures (Cloet-Osselaer et al., 2014).
Another difficulty assuming such a scenario is coming from the relatively special conditions for producing a burst. The burst ignition depends a lot on the properties of the gas cloud and the host galaxy, like the density of the gas cloud, the trajectory, and the mass of the host dwarf galaxy. On the other side, BCDs are also relatively rare, about 100 times less than other dwarfs with -band magnitude around mag. (Sánchez Almeida et al., 2008, their fig. 6).
4.4 Dynamical masses
Making the assumption that our galaxies are dark matter dominated and that they lie in a spherically symmetric dark matter potential, we can estimate their dynamical masses using the drift corrected velocities from the previous section:
| (8) |
where is the gravitational constant ( pc M), is the inclination and asymmetric drift corrected maximum velocity at radius .
Because our galaxies are not thin disks for which the asymmetric drift correction approximations are not fully valid and because we do observe very little stellar rotation, we also estimate the masses from the velocity dispersion of the stars, which is significant. We use the following formula:
| (9) |
as in Walker et al. (2009), where is 580 M⊙/pc/(km s-1)2, is the mean stellar velocity dispersion (see Sect. 3) and is the effective radius. Both sets of estimated masses are reported in Table 4.4. The two masses are consistent within a factor of 1.3. It is worth noticing that the discrepancy between the two estimations comes from the fact that these galaxies are probably not relaxed, which is also visible from the disturbed Hi (van Zee et al., 2001), and we cannot use the Virial theorem.
We also compute the dynamical ratio using the -derived dynamical masses and the -band luminosities (Table 3.4). Our galaxies lie between 0.8 (M⊙/L⊙) and 2.4 (M⊙/L⊙).
Using the stellar mass-to-light ratio (derived from the stellar population parameters) and the dynamical mass-to-light ratio we can estimate the . We find it to be more than two and conclude that if our objects are relaxed they are dark matter dominated in the inner Reff. van Zee et al. (2001) also estimated the dynamical masses of these objects from the Hi velocity fields, which reach several times further than our stellar velocity profiles. The masses reported by these authors are about an order of magnitude higher than ours because they trace the solid body rotation curves further outwards than us.
4.5 Comparison with early type dwarfs
Our sample was chosen for its resemblance to dwarf elliptical galaxies as a possible end product of the BCDs after the gas is exhausted/removed and the burst is quenched. In this section we will investigate if such a transition is possible.
We derived the spatial SSP-equivalent ages and metallicities of our sample of BCDs. While these values are typical for star forming dwarfs with low metallicities and relatively young ages, we anticipate that these are not young objects and that the bulk of their stellar mass was formed a long time ago (extended stellar halo is visible in our and band images, Fig. 10,11). Though we could not perform star formation history analysis, due to the limited wavelength range, we anticipate that if their gas is removed and star formation ceased, only after 1-2 Gyr of passive evolution their stellar populations will be identical to early type dwarfs, as shown from other observational studies (Weisz et al., 2011; Sánchez Almeida et al., 2008; Koleva et al., 2013).
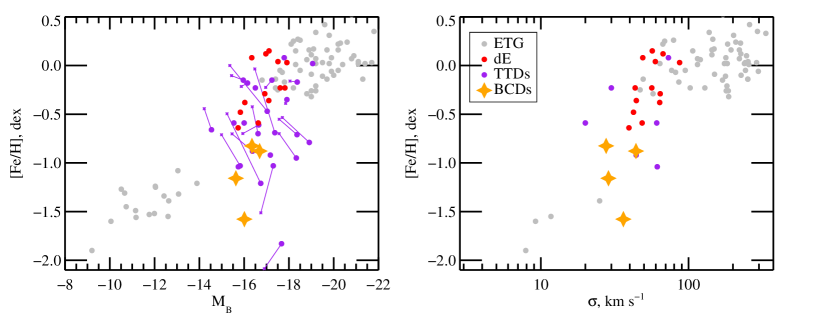
The final metallicity of a stellar system, or how much metals are going to be produced and kept in a galaxy, depends on its total mass, density, geometric configuration, and star formation history. Thus, the mass-metallicity relation can in principle indicate the evolutionary stage of a stellar system and its star formation modes (e.g. Tremonti et al., 2004). To check if our sample of BCDs had similar star formation histories as other early type galaxies (ETGs) we place them on the mass-metallicity relations. Fig. 8 shows the relation between the metallicities of these objects as a function of their velocity dispersion and -band magnitudes. The data for dwarf ellipticals and transition type dwarfs are taken from Koleva et al. (2009a, 2013), where the metallicities are the SSP-equivalent central metallicities of the objects. Since the star formation regions of our BCDs do not coincide with the geometrical center of the galaxy we took the mean metallicities, they are reported in Table 3.4 and indicated on their radial profile plots (Fig. 3–Fig. 6). Our sample seems to occupy the same locus as the transition type galaxies in the metallicity-velocity dispersion plane, while the BCDs -band luminosities are slightly too bright for their metallicities than the quiescent dwarfs. Since these BCDs are forming stars at extraordinary rates (around M⊙/yr van Zee et al. 2001), their -band magnitudes are understandably higher for their metallicities. Thus, in this case, the velocity dispersion is probably a better indicator for the enclosed total mass of the system (though our galaxies may not be dynamically relaxed).
Another ground of comparison is the dynamics of dwarf elliptical and blue compact dwarf galaxies. While their difference in the v/ values were long considered as an obstacle (e.g. van Zee et al., 2001), we have shown here that when using the stellar rotations and velocity dispersions values our galaxies have (v/), which is perfectly in the range of dwarf elliptical galaxies, that lie between (v/)⋆ 0.1 and 2.5 (Toloba et al., 2011). Moreover, it has been found that the surface brightness profile of Virgo cluster BCDs is similar to the surface brightness profile of some of the dEs there (Meyer et al., 2013), which may suggest similar gravitational potentials. Moreover, Lelli et al. (2013) found that the velocity gradient (velocity as a function of the radius) in BCDs and dEs is similar and reflects the distribution of the central total mass.
Our BCDs, though being selected to look as regular as possible and resemble dEs, have very disturbed velocity fields. Mk324 is the best example where the body is relaxed and regular while the blue clump to the NW of the galaxy has very different kinematics - this structure seems to be kinematically decoupled from the rest of the galaxy, with a much smaller velocity dispersion and even a velocity gradient of a few km s-1. The embedded structure we observe in the stellar rotational curves of our targets are also present in high resolution observations of dEs especially if 3D observations are available (Geha et al., 2005; Chilingarian et al., 2007; Ryś et al., 2013). We expect, however, most of these substructures to disappear with the ceasing of the star formation and the relaxation of the systems.
5 Conclusions
We have selected four blue compact dwarf galaxies with relaxed and regular outer regions, resembling dwarf elliptical galaxies. They are part of a sample of 6 BCDs observed from van Zee et al. (2001) in the radio domain. We have obtained , and images and long-slit data along their kinematical major and minor axes (van Zee et al., 2001). The spectroscopic data were obtained near the CaT region to ensure more relaxed kinematical profiles and milder age sensitivity. From the photometric data we have obtained total magnitudes and half light radii. They span a range of mag and their -band effective radii are of the order of 0.5 kpc. Their () colours in the star formation regions are close to , typical for young population. The bodies of the galaxies have () colours around 1.5. Most of the strongest star formation regions are also detected in the -band images, indicating that the burst is not a recent event.
We analysed the spectroscopic data using ULySS - a full spectrum fitting package together with Pegase.HR/CFLIB population synthesis models. The CaT region is not very sensitive to the age of a stellar system, but can still deliver reliable ages and metallicities, providing that these quantities are below a few Gyr and dex, respectively. We found population ages around 1 Gyr to dominate the light. The metallicities of these stars are 1/10th of the solar value.
The velocity profiles of our galaxies are complex, with disk-like rotation in the regions of active star formation. These are also often associated with drops in the velocity dispersion.
Considering all the observed properties we conclude that there is no unique mechanism which triggers the bursts, even in the same galaxy. In some cases (Mk324 and Mk900) the cold dynamical structure, the relatively high metallicity and the long life span of star formation region point towards mergers (Bekki, 2008; Cloet-Osselaer et al., 2014). In other cases (UM038), when differential rotation is detected, the burst can be explained with in-spiraling gas clumps (Elmegreen et al., 2012b). Finally, cloud impacts (Gordon & Gottesman, 1981; Verbeke et al., in prep.) are possible ignitors when the metallicity of the star-formation region is low, the velocity field is disturbed and the life span of the burst is relatively short.
When including the effect of asymmetric drift our stellar velocity curves coincide with the velocities curves of the ionized gas (Pa and [Siii] lines) and the Hi data from van Zee et al. (2001). The velocity profiles show a rapid increase in the inner 1 kpc of the galaxies in a solid body fashion, indicating dense cores. Otherwise, our values of the stellar ()⋆ are spread between 0.4 to 2.8, so they are in the range of those for dwarf elliptical galaxies (Toloba et al., 2011). When placed on the metallicity-velocity dispersion relation our BCDs occupy similar regions for a given as the transition type dwarfs, which in turn are on their way of becoming dwarf ellipticals (Koleva et al., 2013).
Finally, we computed the dynamical masses of our galaxies inside the effective radii and we obtain values of the order of a few M⊙.
Acknowledgments
MK is a postdoctoral fellow of the Fund for Scientific Research- Flanders, Belgium (FWO11/PDO/147) and Marie Curie (Grant PIEF- GA-2010- 271780). We acknowledge the use of SDSS DR7 (the full acknowledgment can be found on http://www.sdss.org/collaboration/credits.html) and the HyperLeda database (Paturel et al. 2003, http://leda.univ-lyon1.fr). The publication is supported by the Austrian Science Fund (FWF). RB acknowledges financial support from the CHARM framework (Contemporary physical challenges in Heliospheric and AstRophysical Models), a phase VII Interuniversity Attraction Pole (IAP) programme organised by BELSPO, the BELgian federal Science Policy Office.
References
- Bekki (2008) Bekki K., 2008, MNRAS, 388, L10
- Bigiel et al. (2010) Bigiel F., Leroy A., Walter F., Blitz L., Brinks E., de Blok W. J. G., Madore B., 2010, AJ, 140, 1194
- Binney & Tremaine (2008) Binney J., Tremaine S., 2008, Galactic Dynamics: Second Edition. Princeton University Press
- Chilingarian et al. (2007) Chilingarian I. V., Prugniel P., Sil’Chenko O. K., Afanasiev V. L., 2007, MNRAS, 376, 1033
- Cloet-Osselaer et al. (2014) Cloet-Osselaer A., de Rijcke S., Vandenbroucke B., Schroyen J., Koleva M., 2014, MNRAS, submitted
- De Rijcke et al. (2003) De Rijcke S., Dejonghe H., Zeilinger W. W., Hau G. K. T., 2003, A&A, 400, 119
- Delisle & Hardy (1992) Delisle S., Hardy E., 1992, AJ, 103, 711
- Elmegreen et al. (2009) Elmegreen B. G., Elmegreen D. M., Fernandez M. X., Lemonias J. J., 2009, ApJ, 692, 12
- Elmegreen et al. (2012a) Elmegreen B. G., Zhang H.-X., Hunter D. A., 2012a, ApJ, 747, 105
- Elmegreen et al. (2012b) —, 2012b, ApJ, 747, 105
- Geha et al. (2005) Geha M., Guhathakurta P., van der Marel R. P., 2005, AJ, 129, 2617
- Gerola et al. (1980) Gerola H., Seiden P. E., Schulman L. S., 1980, ApJ, 242, 517
- Gil de Paz et al. (2003) Gil de Paz A., Madore B. F., Pevunova O., 2003, ApJS, 147, 29
- Goerdt et al. (2010) Goerdt T., Moore B., Read J. I., Stadel J., 2010, ApJ, 725, 1707
- Gordon & Gottesman (1981) Gordon D., Gottesman S. T., 1981, AJ, 86, 161
- Hinz et al. (2001) Hinz J. L., Rix H.-W., Bernstein G. M., 2001, AJ, 121, 683
- Hunter & Elmegreen (2004) Hunter D. A., Elmegreen B. G., 2004, AJ, 128, 2170
- Hunter & Elmegreen (2006) —, 2006, ApJS, 162, 49
- Hunter et al. (2012) Hunter D. A., Ficut-Vicas D., Ashley T., Brinks E., Cigan P., Elmegreen B. G., Heesen V., Herrmann K. A., Johnson M., Oh S.-H., Rupen M. P., Schruba A., Simpson C. E., Walter F., Westpfahl D. J., Young L. M., Zhang H.-X., 2012, AJ, 144, 134
- Kelson (2003) Kelson D. D., 2003, PASP, 115, 688
- Koleva et al. (2013) Koleva M., Bouchard A., Prugniel P., De Rijcke S., Vauglin I., 2013, MNRAS, 428, 2949
- Koleva et al. (2009a) Koleva M., de Rijcke S., Prugniel P., Zeilinger W. W., Michielsen D., 2009a, MNRAS, 396, 2133
- Koleva et al. (2009b) Koleva M., Prugniel P., Bouchard A., Wu Y., 2009b, A&A, 501, 1269
- Koleva et al. (2011) Koleva M., Prugniel P., de Rijcke S., Zeilinger W. W., 2011, MNRAS, 417, 1643
- Koleva & Vazdekis (2012) Koleva M., Vazdekis A., 2012, A&A, 538, A143
- Kunth et al. (1988) Kunth D., Maurogordato S., Vigroux L., 1988, A&A, 204, 10
- Le Borgne et al. (2004) Le Borgne D., Rocca-Volmerange B., Prugniel P., Lançon A., Fioc M., Soubiran C., 2004, A&A, 425, 881
- Lelli et al. (2013) Lelli F., Fraternali F., Verheijen M., 2013, ArXiv e-prints
- Lisker et al. (2006) Lisker T., Glatt K., Westera P., Grebel E. K., 2006, AJ, 132, 2432
- Loose & Thuan (1986) Loose H.-H., Thuan T. X., 1986, in Star-forming Dwarf Galaxies and Related Objects, Kunth D., Thuan T. X., Tran Thanh Van J., Lequeux J., Audouze J., eds., pp. 73–88
- Martínez-Delgado et al. (2007) Martínez-Delgado I., Tenorio-Tagle G., Muñoz-Tuñón C., Moiseev A. V., Cairós L. M., 2007, AJ, 133, 2892
- Meyer et al. (2013) Meyer H. T., Lisker T., Janz J., Papaderos P., 2013, ArXiv e-prints
- Östlin et al. (2004) Östlin G., Cumming R. J., Amram P., Bergvall N., Kunth D., Márquez I., Masegosa J., Zackrisson E., 2004, A&A, 419, L43
- Paturel et al. (2003) Paturel G., Petit C., Prugniel P., Theureau G., Rousseau J., Brouty M., Dubois P., Cambrésy L., 2003, A&A, 412, 45
- Prugniel & Simien (1997) Prugniel P., Simien F., 1997, A&A, 321, 111
- Prugniel & Simien (2003) —, 2003, Ap&SS, 284, 603
- Prugniel et al. (2011) Prugniel P., Vauglin I., Koleva M., 2011, A&A, 531, A165
- Ryś et al. (2013) Ryś A., Falcón-Barroso J., van de Ven G., 2013, MNRAS, 428, 2980
- Sánchez Almeida et al. (2008) Sánchez Almeida J., Muñoz-Tuñón C., Amorín R., Aguerri J. A., Sánchez-Janssen R., Tenorio-Tagle G., 2008, ApJ, 685, 194
- Schroyen et al. (2013) Schroyen J., De Rijcke S., Koleva M., Cloet-Osselaer A., Vandenbroucke B., 2013, MNRAS, 434, 888
- Toloba et al. (2011) Toloba E., Boselli A., Cenarro A. J., Peletier R. F., Gorgas J., Gil de Paz A., Muñoz-Mateos J. C., 2011, A&A, 526, A114
- Tremonti et al. (2004) Tremonti C. A., Heckman T. M., Kauffmann G., Brinchmann J., Charlot S., White S. D. M., Seibert M., Peng E. W., Schlegel D. J., Uomoto A., Fukugita M., Brinkmann J., 2004, ApJ, 613, 898
- Valdes et al. (2004) Valdes F., Gupta R., Rose J. A., Singh H. P., Bell D. J., 2004, ApJS, 152, 251
- van Zee et al. (2001) van Zee L., Salzer J. J., Skillman E. D., 2001, AJ, 122, 121
- van Zee et al. (1998) van Zee L., Skillman E. D., Salzer J. J., 1998, AJ, 116, 1186
- Vazdekis et al. (2003) Vazdekis A., Cenarro A. J., Gorgas J., Cardiel N., Peletier R. F., 2003, MNRAS, 340, 1317
- Verbeke et al. (in prep.) Verbeke R., de Rijcke S., Koleva M., Cloet-Osselaer A., Vandenbroucke B., in prep.
- Wakker & van Woerden (1997) Wakker B. P., van Woerden H., 1997, ARA&A, 35, 217
- Walker et al. (2009) Walker M. G., Mateo M., Olszewski E. W., Peñarrubia J., Wyn Evans N., Gilmore G., 2009, ApJ, 704, 1274
- Weisz et al. (2011) Weisz D. R., Dalcanton J. J., Williams B. F., Gilbert K. M., Skillman E. D., Seth A. C., Dolphin A. E., McQuinn K. B. W., Gogarten S. M., Holtzman J., Rosema K., Cole A., Karachentsev I. D., Zaritsky D., 2011, ApJ, 739, 5
- Worthey (1999) Worthey G., 1999, in Astronomical Society of the Pacific Conference Series, Vol. 192, Spectrophotometric Dating of Stars and Galaxies, Hubeny I., Heap S., Cornett R., eds., p. 283
- Wu et al. (2011) Wu Y., Singh H. P., Prugniel P., Gupta R., Koleva M., 2011, A&A, 525, A71
- Zhao et al. (2013) Zhao Y., Gao Y., Gu Q., 2013, ApJ, 764, 44
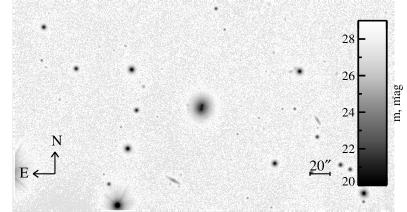
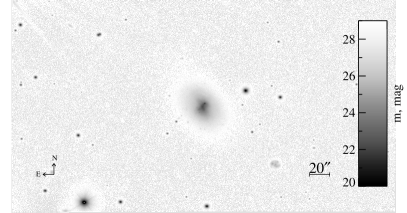
Appendix A Photometry
In this appendix we present the photometric images of our 4 targets in -band, -band and -band. We plot the full field-of-view of the instruments (for the and images) to appreciate the relative isolation of the objects. The -band images are mosaics, produced using a fast pixel-shift algorithm and weight-maps.
Appendix B Additional figures
In this section we present the derived kinematical properties of the minor and major axes of our galaxies (Fig. 12). The data were obtained by fitting independent Gaussians to the Paschen (Pa) and [Siii] emission lines. The results from the different line fits agree.
Here, we also attach the -maps at the most prominent star-formation regions (Fig.13) at the minor and major axes for each of the galaxies. These maps illustrate the age and metallicity sensitivity of our spectra. It is clear that we have little information for stellar ages older than 2 Gyr. The metallicities are usually better constrained with an average uncertainty of 0.2 dex.