The available-enthalpy (flow-exergy) cycle.
Part-II: applications to idealized baroclinic waves.
Abstract
The local available-enthalpy cycle proposed in Part I
of this paper is applied to document energetics
of three numerical simulations, representing life cycles of idealized
baroclinic waves.
An improved temporal numerical scheme
defined in Part I is used in this study, together with
the Arpege-IFS model using a T42 triangular truncation.
A N and hPa dry unstable jet is constructed with
the most unstable mode at zonal wave number 8. Energetic
impacts of both horizontal and vertical diffusion
schemes are determined separately.
The role of ageostrophic winds within the Ekman layer
is investigated, leading to an explanation for
large observed values for the dissipation terms
and to a new formulation of the potential-energy conversions.
The magnitudes of these new conversion terms are
compared with those of the usual barotropic and
baroclinic conversions.
A new version for the available-enthalpy
cycle is proposed. It is suitable for open
systems and it includes explicitly the potential-energy
component as a transitional reservoir.
Finally, some results from Intensive Observing Period 15
of the Fronts and Atlantic Storm-Track EXperiment
(FASTEX) are
compared with those from the idealized diabatic experiment.
Copy of a CNRM-Note submitted in two parts in April 2001 to the Quarterly Journal of the Royal Meteorological Society.
Published in Vol.129, Issue 593, Part-I (2445–2466) Part-II (2467–2494), July 2003, Part B.
Part-I: http://onlinelibrary.wiley.com/doi/10.1256/qj.01.62/abstract
Part-II: http://onlinelibrary.wiley.com/doi/10.1256/qj.01.63/abstract
Comments and corrections are added in footnotes.
1 Introduction.
In the first part of this paper (Marquet, 2003, hereafter referred to as Part I), a local and exact available-enthalpy cycle has been proposed. It is designed to clear up the difficulties encountered with previous limited-area applications and, on the global stage, it must lead to the generally accepted results, including conventional baroclinic and barotropic instabilities.
The main local results of Part I are briefly recalled in section 2 and other global results are derived. Adiabatic and diabatic simulations of a life cycle of idealized baroclinic waves are described in section 3. The properties of the new cycle are examined in section 4, based on global and local applications. The temporal scheme defined in Part I is used with a time interval of 3 hours. It is explained how Ekman dissipation and ageostrophic circulations can account for observed large values for dissipation and conversion terms with potential energy in the boundary layer. A new version for the available-enthalpy cycle, suitable for open systems, is proposed in section 5. It includes the potential-energy component as a transitional reservoir in the Lorenz cycle, located between available-enthalpy and kinetic-energy reservoirs. Some results from Intensive Observing Period (IOP15) of Fronts and Atlantic Storm-Track EXperiment (FASTEX) are compared with the diabatic idealized experiment in section 6, with final conclusions presented in section 7.
2 The limited area available enthalpy cycle.
It is explained in Part I that the budget equations for the available enthalpy are derived by computing the time derivation of the six components , , , , and (all symbols are defined in Appendix-A of Part I). As a result, the available-enthalpy cycle is given by (36) and by Fig. 5(b) in Part I.
The global version of (36) in Part I is given by (1)-(3). These equations for , and the total energy TOT are obtained when the whole limited-area domain is considered and by integration from the top pressure to the bottom value .
| (1) | |||||
| (2) | |||||
| (3) |
Boundary terms , , and all vanish for , constant, and for a domain surrounding the whole Earth. These assumptions have been retained in the study of Lorenz (1955, hereafter L55) where the total energy is a constant for a pure adiabatic model if is equal to zero. However and are generally non-zero in numerical simulations because the total energy is not rigorously conserved. Indeed, horizontal spectral schemes are applied on a truncated spectral space, leading to approximations and errors. There are other errors due to time or vertical differencing schemes and interpolation methods. The validation of adiabatic and frictionless versions of the cycle (36) of Part I will be obtained by taking and if the residuals are both small in comparison with the physical tendencies generated by diabatic processes (i.e. and ).
3 Numerical simulations of baroclinic waves.
The concepts of local energetics will be illustrated by a study of available-enthalpy diagnostics for life-cycle experiments of idealized baroclinic waves. Energy computations every h will be undertaken for three different numerical simulations with the same basic state used as a common starting point. This basic state is obtained by suppressing orography and by setting the humidity to a very small value (but non zero to avoid numerical problems in the physics package). The constant surface pressure is equal to hPa. The French Arpege111 The name “Arpege” means “Action de Recherche Petite Echelle et Grande Echelle” in French (this means “Large-scale and Small-scale Research Program”). It is the French counterpart of the ECMWF-IFS model. It share the same dynamic core since 1988, but with a specific physics package. Arpege is often used with a variable grid mesh, based on the stretched and titled pole grid option. numerical model (Courtier et al., 1991) is used with a triangular truncation at total wave number , with irregularly spaced hybrid levels and an Eulerian semi-implicit leapfrog time step of s.
The first adiabatic experiment (EXP-A) is subject only to weak numerical dissipation or generation created by the Asselin filter, truncation errors or approximate time or vertical differencing schemes. There are no explicit horizontal and vertical diffusion schemes. This adiabatic and frictionless simulation will serve as a validation for the new energetic analysis, leading to a quasi-conservative total energy and giving expected small values for dissipation and generation terms expressed as residuals (including the numerical errors). Nevertheless, the last days of this simulation are somewhat unrealistic due to an accumulation of small-scale noisy features associated with high total wavenumber. As a consequence only the growing stage will be considered for (EXP-A), namely for the first days.
The second experiment (EXP-H) is also adiabatic and frictionless but with an additional horizontal diffusion scheme to avoid the accumulation of energy in the high wave number. The stage of decay of the baroclinic wave is more realistic than for EXP-A. The e-folding time of the horizontal diffusion scheme is h for the vorticity and temperature, h for the divergence.
Height 0 5 50 100 250 500 750 1000 1500 2000 3000 4000 L-mix 0 2 15 24 37 44 45 43 38 32 24 19
The third diabatic experiment (EXP-HV) includes the same horizontal diffusion as for EXP-H, but with a vertical diffusion scheme added. As a result, ageostrophic circulations appear in the planetary boundary layer and a crude representation of friction is obtained inducing large dissipation and generation terms. The vertical diffusion scheme is based on a local exchange coefficient method described in Louis (1979) and Louis et al. (1981), with a uniform roughness length of mm and a prescribed vertical profile for the mixing length depicted in Table 1.
3.1 The dry basic state.
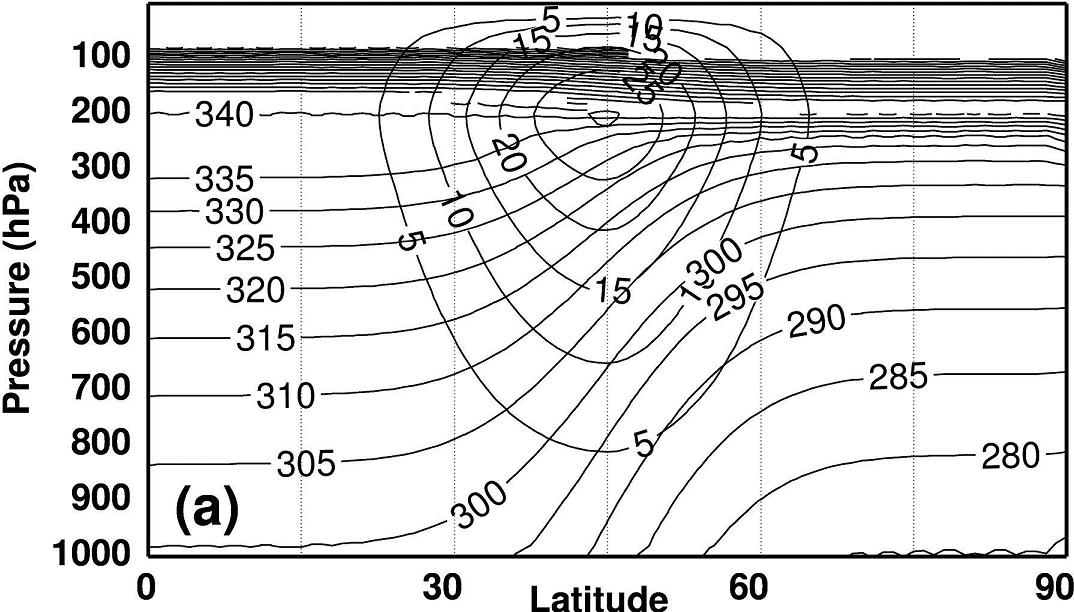
The dry basic zonal flow is constructed following the approach chosen by C. Freydier when the variable resolution version of Arpege-IFS model (Courtier et al., 1991) was validated. This has been performed by taking an analytic formulation for the zonally symmetric temperature . The geopotential is then computed for each pressure level by integrating the hydrostatic equation with at the surface. The balanced zonal flow is finally obtained by setting the zonal and meridional wind tendencies to zero. The meridional wind is also set to zero and all the variables () are zonally symmetric (see the Appendix). The result for the basic state is depicted on Fig. 1(a) where a baroclinic zone is centred at N, with a stationary jet of m s-1 at hPa.
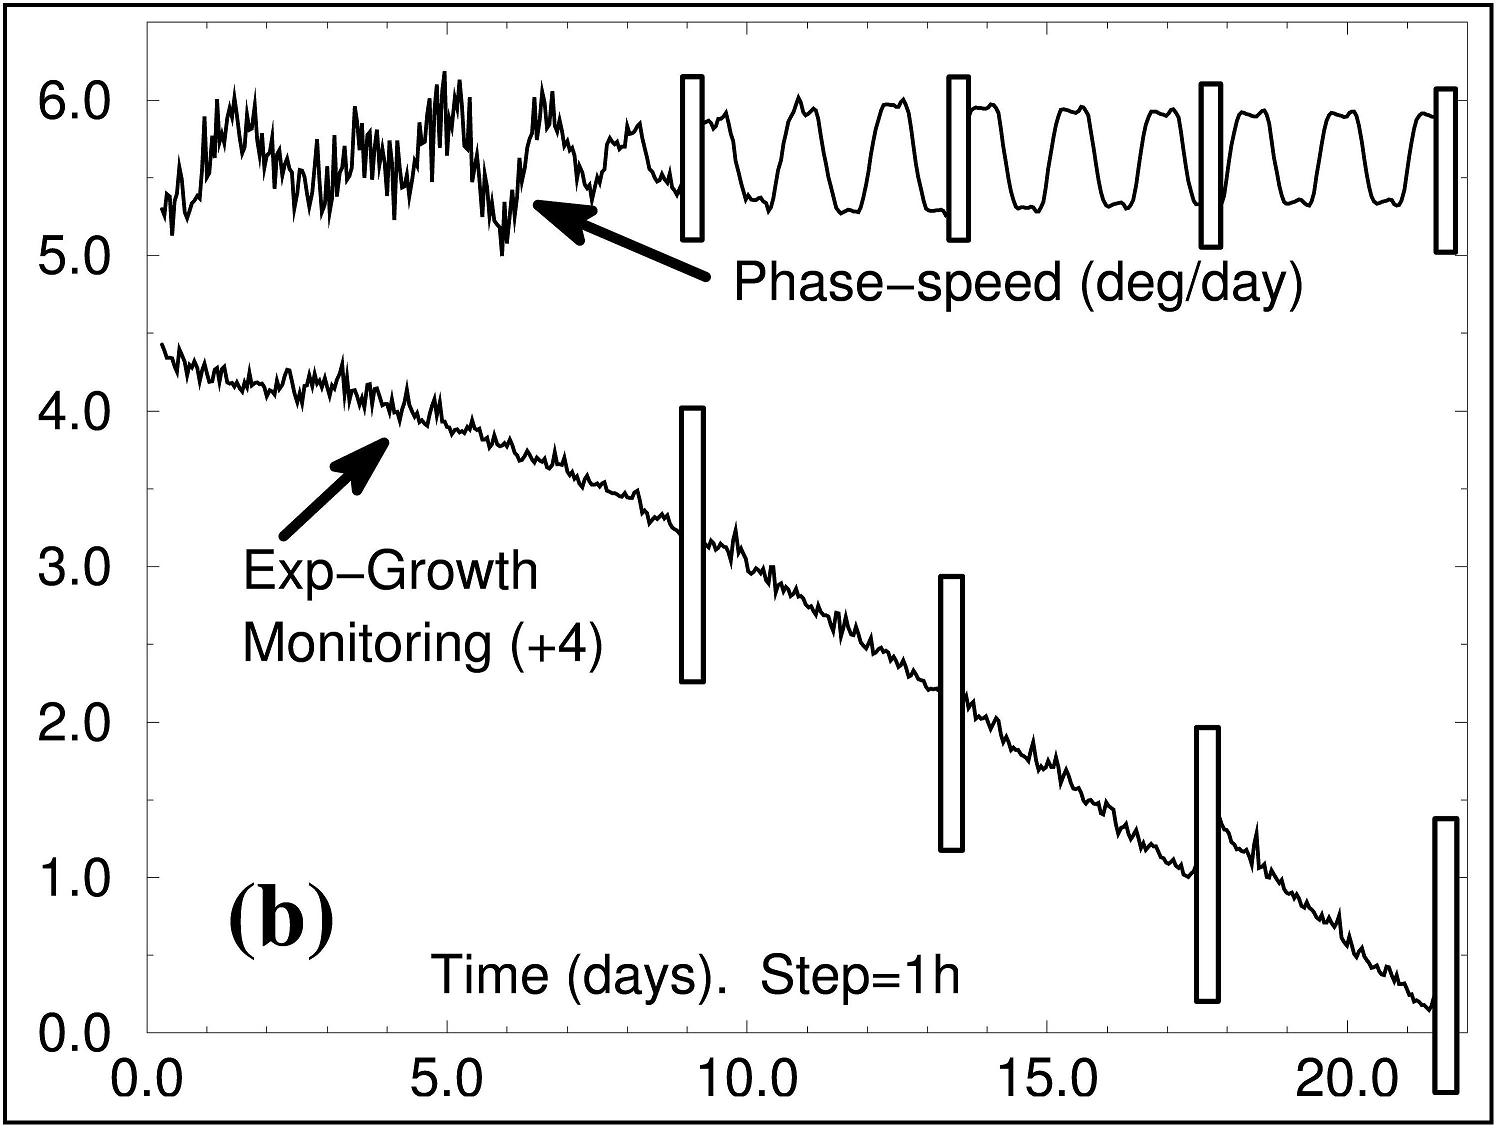
Three simulations EXP-A, EXP-H and EXP-HV are made in order to investigate the life cycle of baroclinic waves. The French Arpege model is used with the same initial state for the three simulations. It is a zonal basic flow with a superimposed most unstable normal mode at zonal wavenumber , determined by use of the method of Thorncroft and Hoskins (1990, hereafter TH90). A small random initial perturbation is added to the surface pressure of the basic flow. The nonlinear growth of the perturbation amplitude is followed during the integration of the model until it is exponential to within a specified accuracy. The relative changes in growth rate and the phase speed are computed every hour according to Simmons and Hoskins (1976). The results are shown in Fig. 1(b) where the relative change in growth rate from one hour to another reaches at day and where the phase speed is close to degrees (day)-1 after averaging time oscillations. Note that, according to TH90, the perturbation amplitudes are reduced together for , , and by a common factor when they become too large. At the end of the simulation, the mode is normalized so that the surface-pressure perturbation is hPa, with a common global damping for , , and .
3.2 Baroclinic developments
The surface pressure and temperature at hPa at day are shown in Figs. 2 (a) and (b) for the adiabatic simulation EXP-H. The same fields are presented in Figs. 2 (c) and (d) for the diabatic simulation EXP-HV.
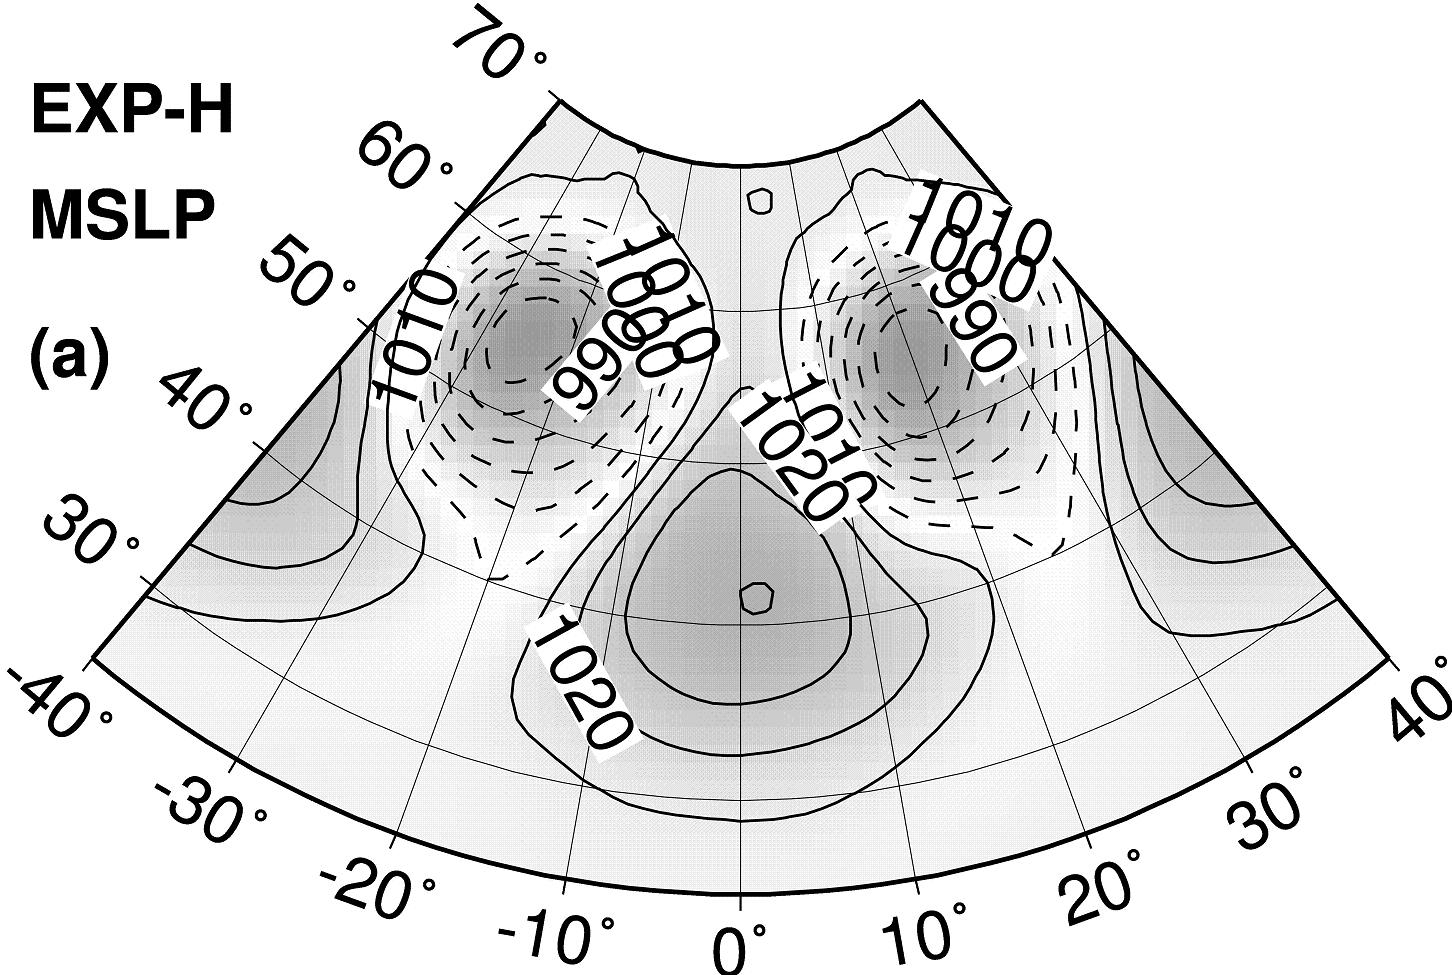
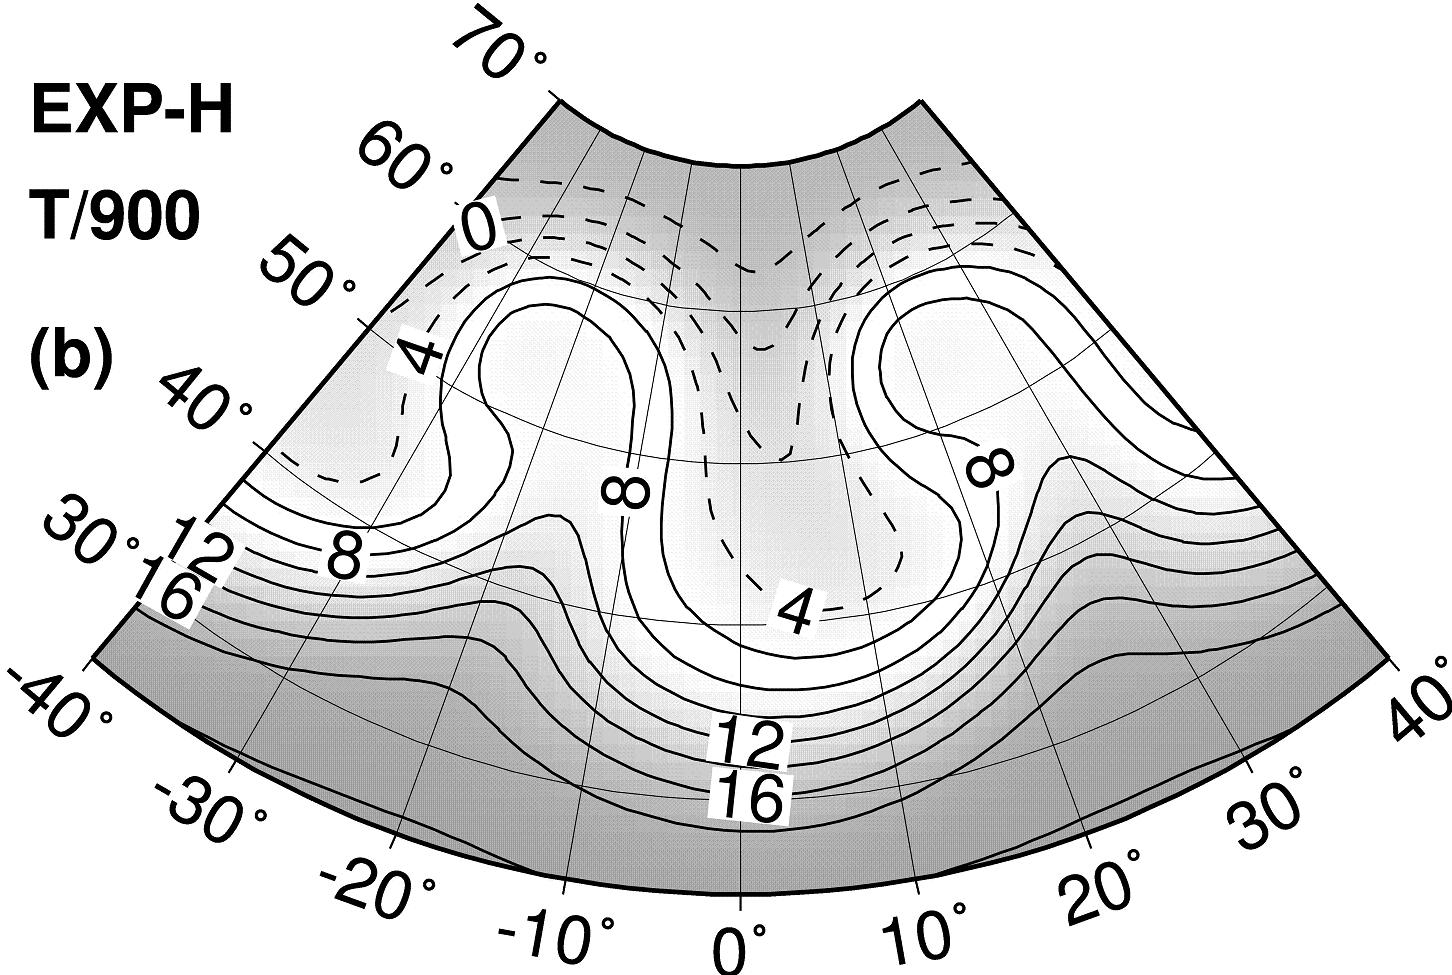
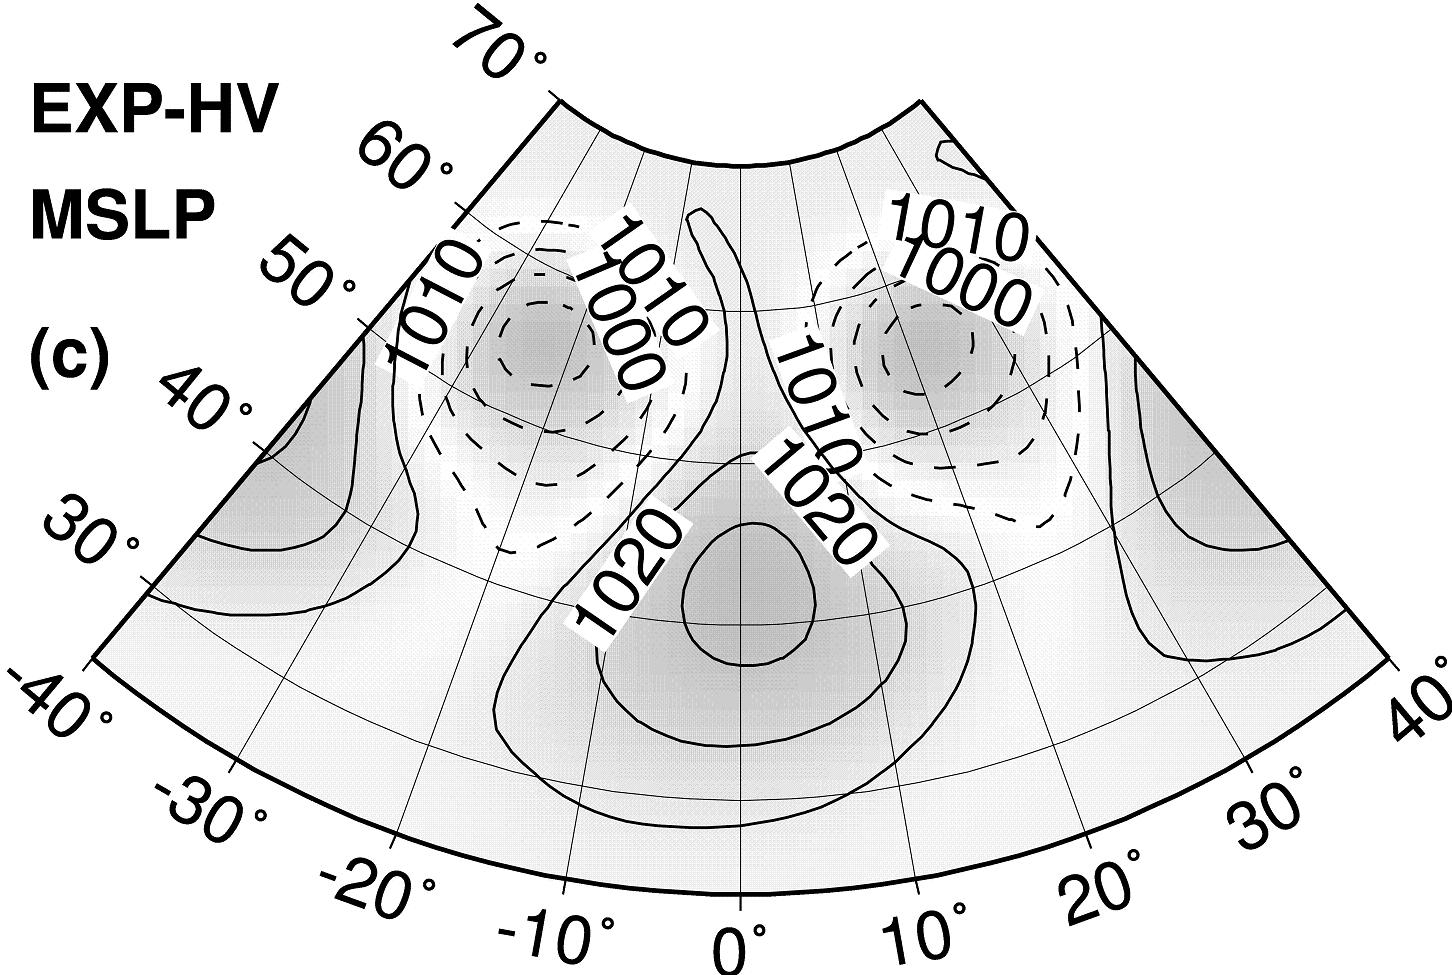
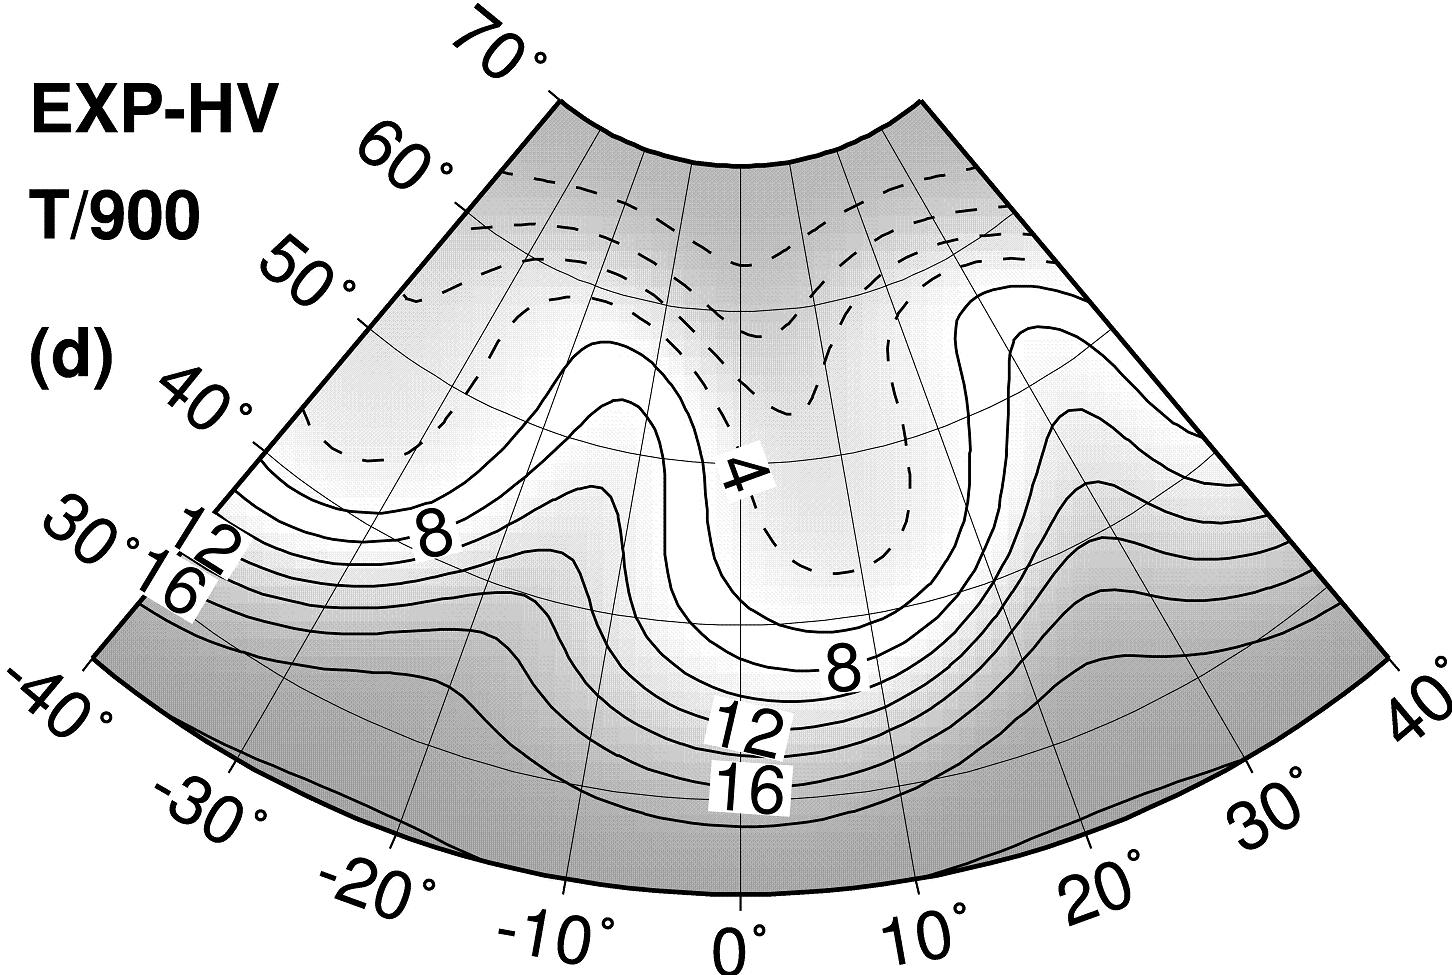
For EXP-H, the pressure trough and cold front are in good agreement with the equivalent results depicted in Fig. 1 of Simmons and Hoskins (1978) when they studied a similar T42 adiabatic simulation with a wave-number-6 perturbation of a N jet. At day , the surface pressure lows are about hPa at N, with high pressure reaching hPa at N. The temperature planetary waves at hPa depicted in (b) are associated with moderate gradients and, as in Fig. 1 of Simmons and Hoskins (1978) or in Fig. 6 of Hoskins and Simmons (1975), the surface troughs and ridges in Fig. 2 (a) are in phase for all latitudes from N to N with the axes of warmest and coldest air in Fig. 2 (b), respectively.
The surface pressure field for the experiment EXP-HV in Fig. 2 (c) is almost identical with the corresponding adiabatic version in Fig. 2 (a), except there is a global smoothing of the field when the vertical diffusion is activated. The pressure lows increase from to hPa, with an overall gradient decrease.
The difference in the temperature field at hPa between EXP-H and EXP-HV is more important in the range of latitude from N to N. There is an Eastward shift of about of the warm axes and of the occluded part of the front. The fields are more profoundly modified closer to the surface (not shown) where the vertical diffusion scheme is acting.
4 Energetic analysis of the baroclinic waves.
4.1 Practical computations of the available enthalpy cycle.
An output dataset from Arpege is used for the post-processed data on pressure levels, at intervals of hPa from to hPa, hPa from to hPa and with the four upper levels at and hPa. Time derivatives and other terms of cycle (36) of Part I are evaluated with meteorological data available every h.
The post-processed fields are (, , , ) for all pressure levels and on the same latitudelongitude grid. Vertical and horizontal differencing schemes used in the diagnostic package are second-order centred grid point schemes, different from those used in Arpege where values are located on half-levels and where horizontal derivatives are computed in spectral space. The reason why diagnostics have not been computed directly in Arpege with the same numerical schemes is to allow future studies of different models with “pressure levels” and “latitudelongitude” grid structures as a common starting point for the same diagnostic package.
The modified time scheme described in Part I will be used to solve the generic equations of (36) in Part I, denoted by . The notations , and are used for values of and at time , and , respectively. The scheme222 This scheme is expressed differently in Part I: . The two formulations are clearly equivalent. takes
| (4) |
For the present ideal case study, the scale-length is equal to the half-wavelength of the normal mode, i.e. . The advection is obtained from day-to-day observations of the mode and the value is different from the theoretical value of /day, as shown in Fig. 1 (b). The real value is about /day. For a time interval of h, the critical time interval is equal to days and the value of h is thus far below the corresponding limit of days required for an accurate application of (4) with an error lower than % (see Table 1 in Part I).
4.2 Global results (adiabatic and diabatic simulations).
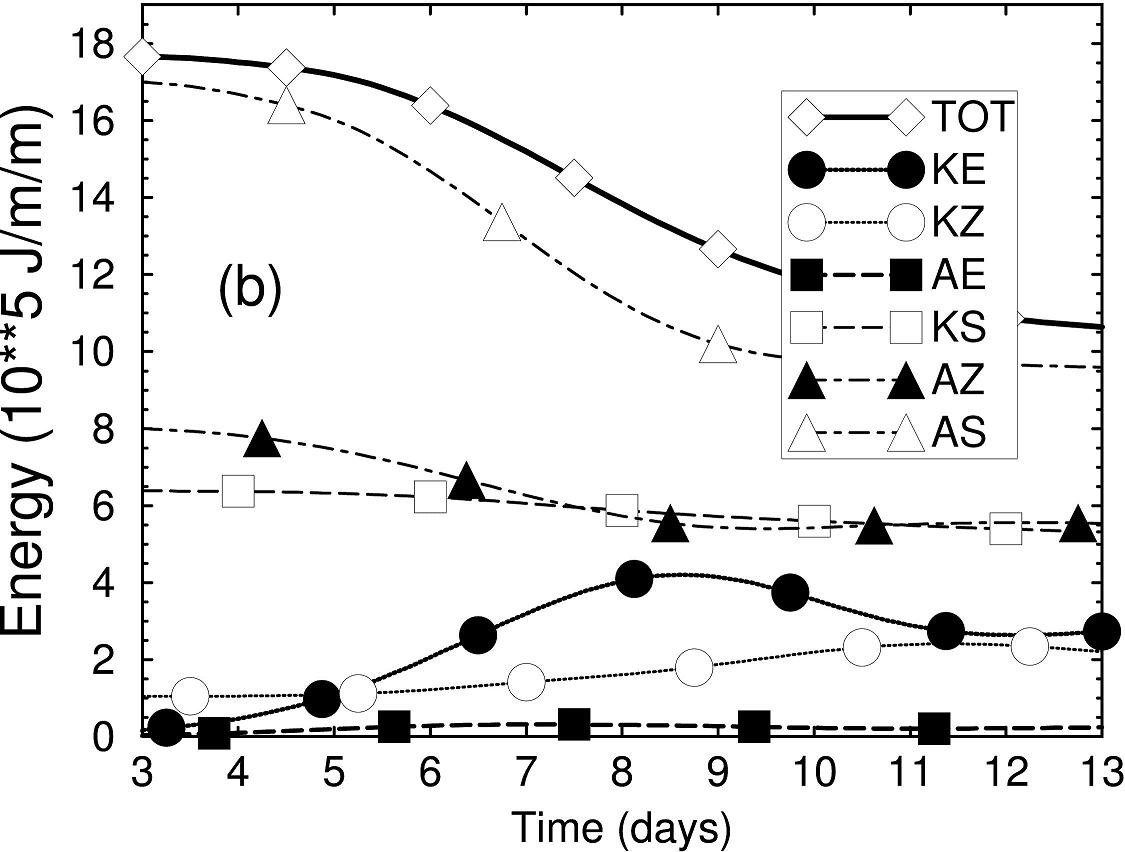
Evolutions of global energy components of the basic life cycle are presented in Fig. 3 for days to of the simulations EXP-A, EXP-H and EXP-HV. The large computational domain extends vertically from to hPa and the horizontal limits are N and N, E and E. Although it is not a real global domain (say S to N and W to E), it is clear from Figs. 2(a)–(d) that fields are nearly zonally symmetric to north and south of the computational domain and periodic in longitude (there is an even number of planetary waves ). Unused parts of this global domain would not have contributed significantly to energetics of the simulations and it is expected that, for this large computational domain, the baroclinic or barotropic signals will be enhanced and be easier to analyse than for the real global domain.
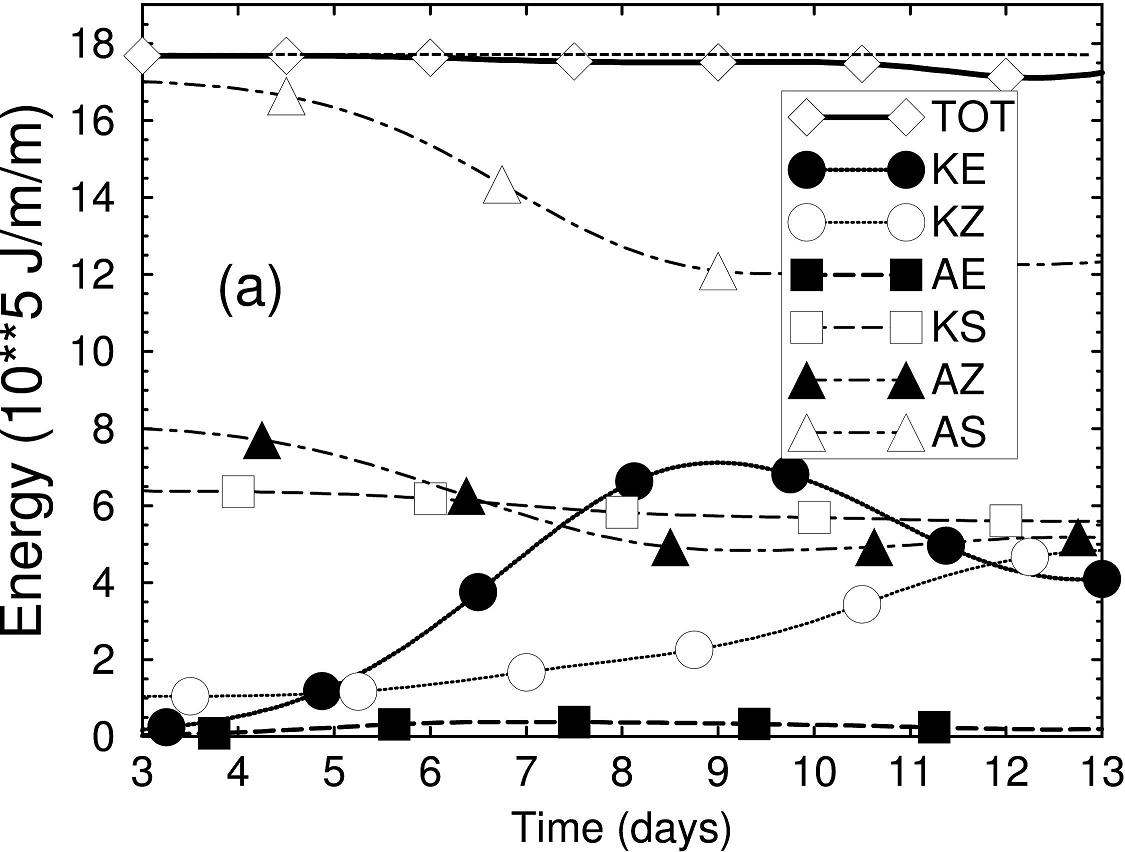
Global energy components for the simulation EXP-H are presented on Fig. 3 (a). As expected the total energy TOT is a constant up to day for this adiabatic case. The rapid increase of is maximum at day and reaches its maximum value at day ( J m-2). There is a slow and less important increase in in the growing stage of the mode, followed by a more rapid increase between days and when start to decrease and when the mode decays. The initial increase in and up to day is thus obtained at the expense of and , via possible baroclinic processes to be confirmed later on. The rapid increase of in the depletion stage is realized at the expense of , because only and vary in time after day . This transfer of energy from to is usually considered as a barotropic conversion. As for the changes in the global components and , they are less than J m-2 and do not give contributions to the global energetics. All these global results are similar to those reported in the “T42” study of Pearce (1978, hereafter P78) and in the “T95” study of TH90, with almost the same time-scale and the same intensity as in P78, whereas in TH90 the growth of is more rapid with a maximum value for reaching J m-2 at day .
Figure 3 (b) shows the results for the diabatic simulation EXP-HV including the vertical diffusion scheme. In comparison with EXP-H, the total energy decreases continuously during the days of the simulation. The decrease in the global static stability component is more important. It is a direct impact of the vertical mixing, leading to a decrease in the low-level vertical gradients of temperature (not shown). Another important feature is that the increases in and are smaller than for EXP-H. The effect of smoothing the horizontal gradients of the fields, already mentioned in the comments of Fig. 2, is confirmed by the energetic analysis and it leads to smaller values for and at each stage of the simulation. Changes in and are small (less than J m-2), as for EXP-H.
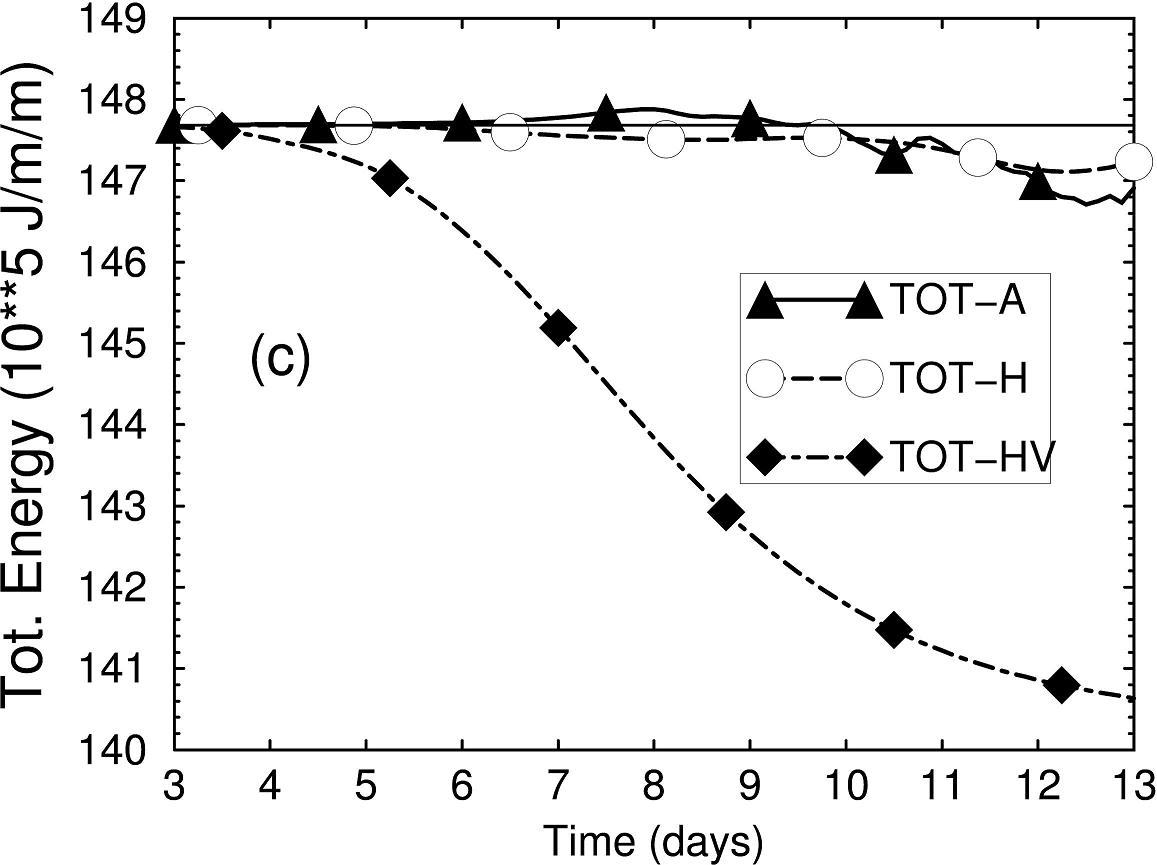
Total energy TOT is a constant for EXP-A in Fig. 3 (c), with, however, a small and unrealistic increase above the initial value during the growing stage of the mode (from days to ). Values of TOT for EXP-H are also nearly constant but they lead to a more realistic continuous and small decrease, indicating that the explicit horizontal diffusion has a small but positive global impact on the total energy. The e-folding times for horizontal diffusion are short enough to suppress the noisy features at high zonal wavenumber and do not lead to excessive numerical flattening of the fields that could induce spurious changes in total energy. Relative changes of TOT are less than % up to day for the two adiabatic simulations and absolute changes are less than J m-2. As expected, they are small in comparison with the gain in eddy kinetic energy ( J m-2) and they can be compared with the small changes in or .
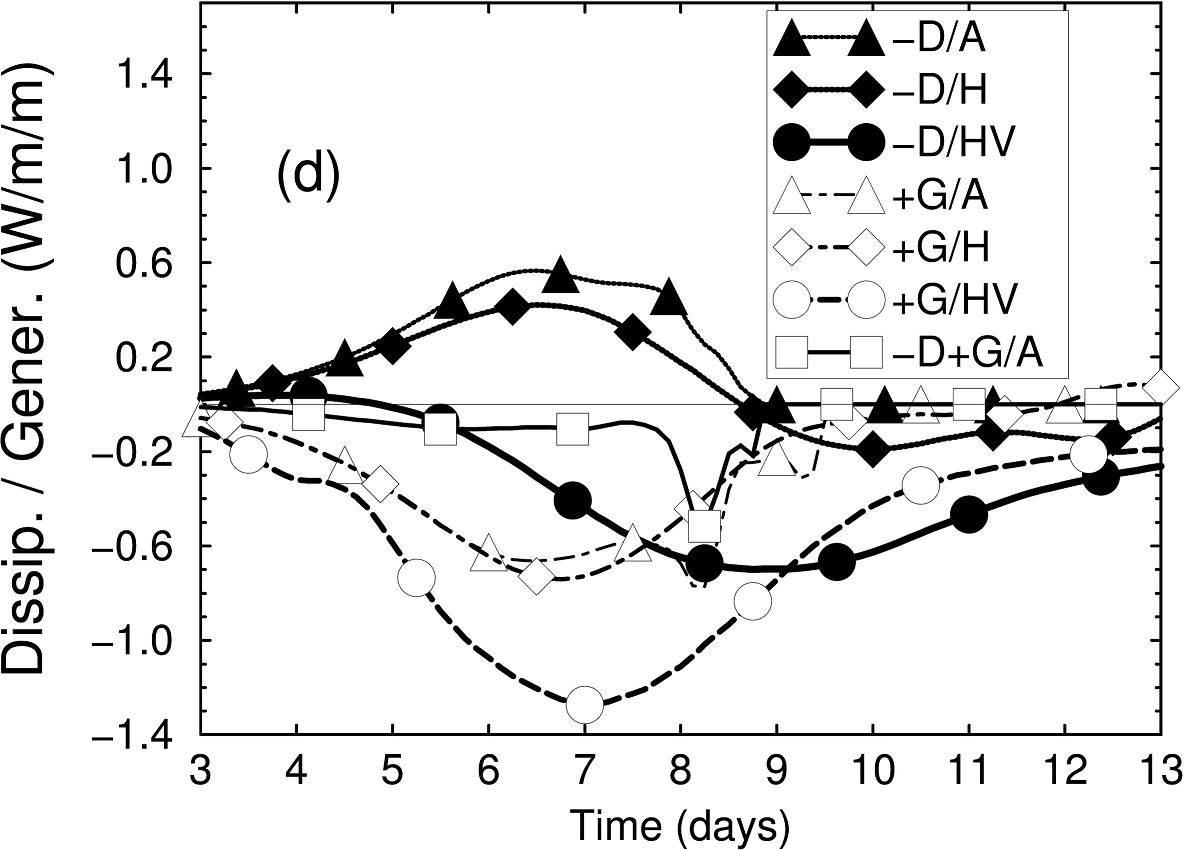
Global dissipation and generation terms are depicted on Fig. 3 (d) for the three simulations and the difference is plotted only for EXP-A with the open square symbol. It is expected from (3) that, for a nearly constant total energy and for zero boundary fluxes, must be small. Absolute values are indeed lower than W m-2 up to day , whereas and reach W m-2 for the adiabatic cases. This result is another global validation for the cycle (3), indicating that no global terms are missing and that the numerical computations are accurate enough. Although the dissipation is positive for EXP-A and EXP-H, the behaviour for the diabatic simulation EXP-HV is more realistic. There is a negative global dissipation (dark circle) reaching W m-2 at day and a negative generation (open circle) reaching W m-2 at day . These negative and large generations and dissipations for EXP-HV explain the decreasing of in Fig. 3 (b) and the moderate increase in and .
4.3 Local results for (adiabatic simulation).
Results for the large computational domain (N–N ; –E) are presented in Fig. 4 for the eddy kinetic energy and for the adiabatic simulation. According to formulation (36) of the cycle of Part I, the reservoir is connected to and by the barotropic and baroclinic conversions and , respectively. The intensity of these conversions will be evaluated with the aid of pressure-time diagrams. The new direct conversion with , denoted by , and the dissipation must also be carefully investigated.
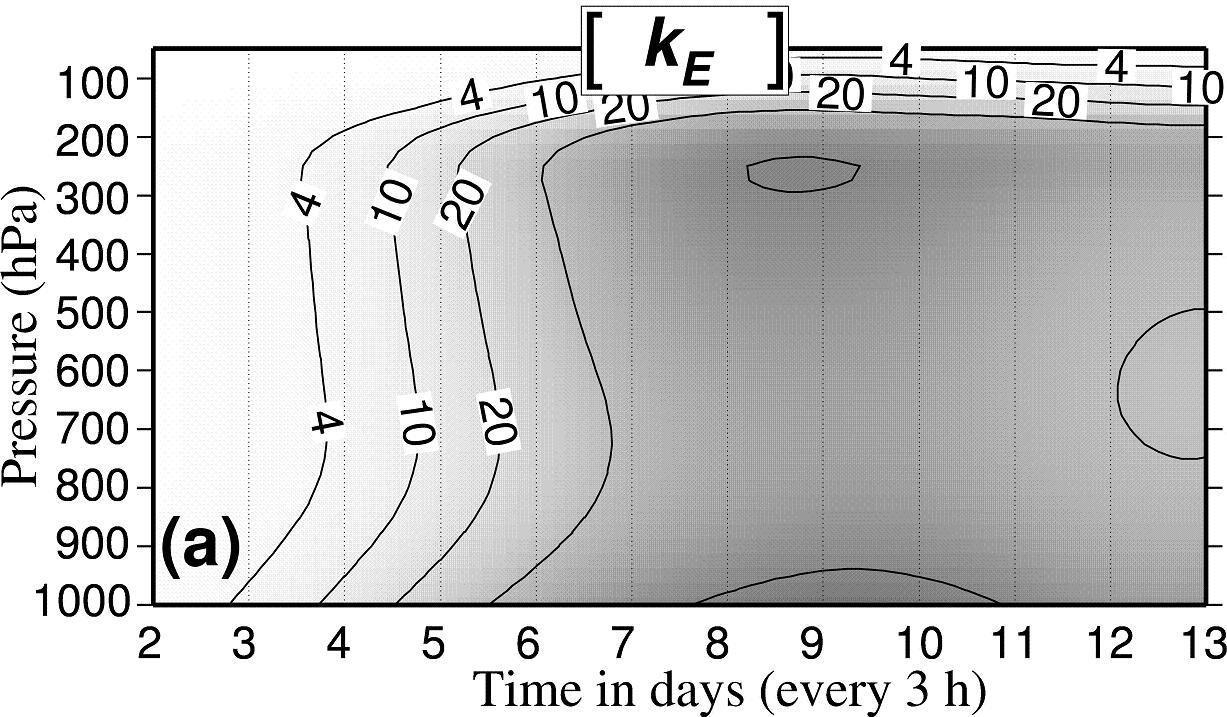
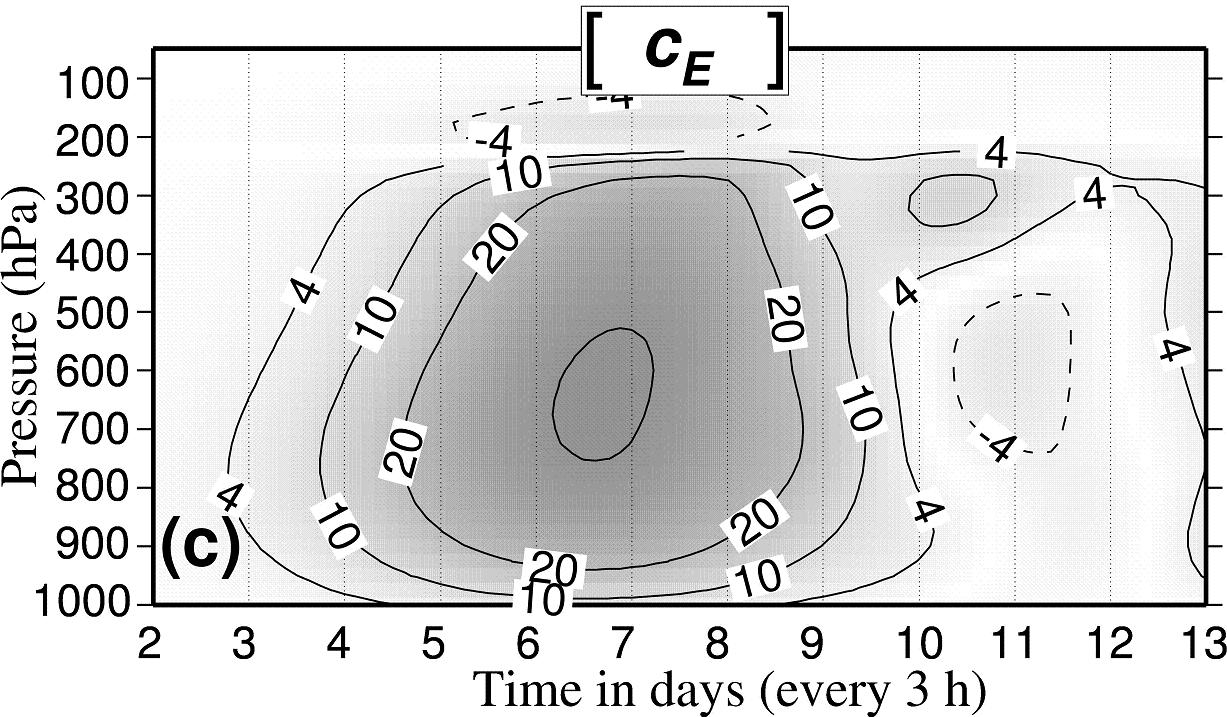
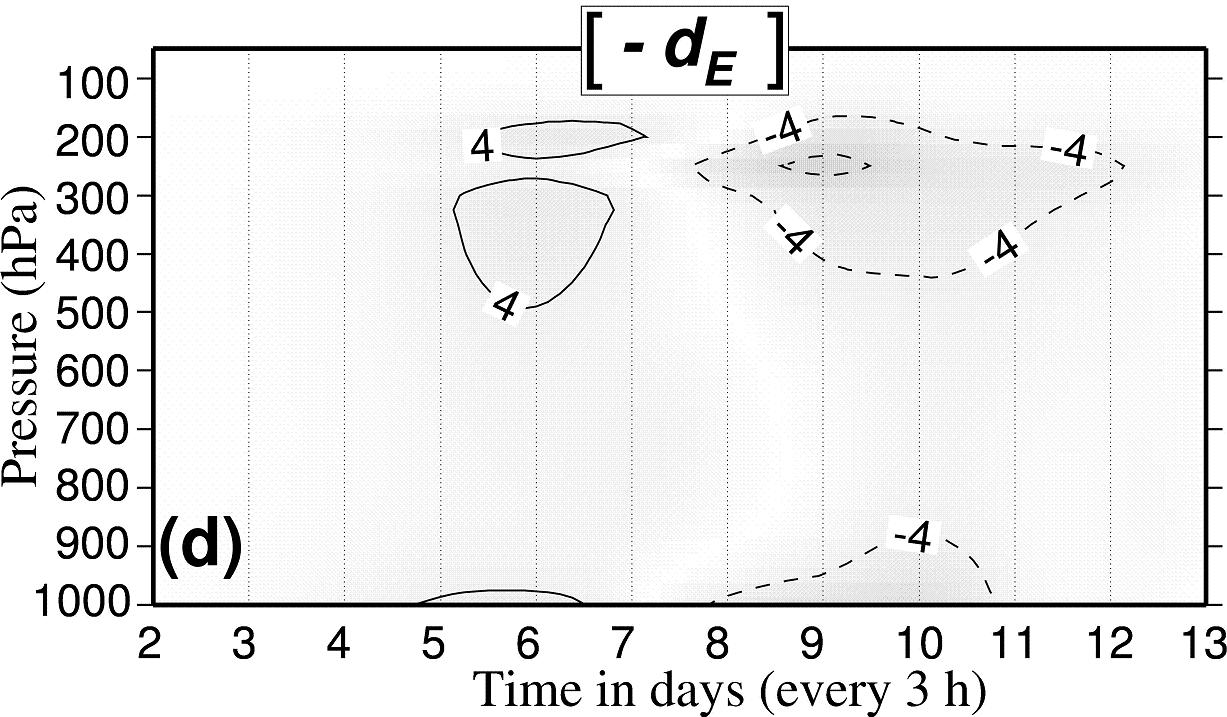
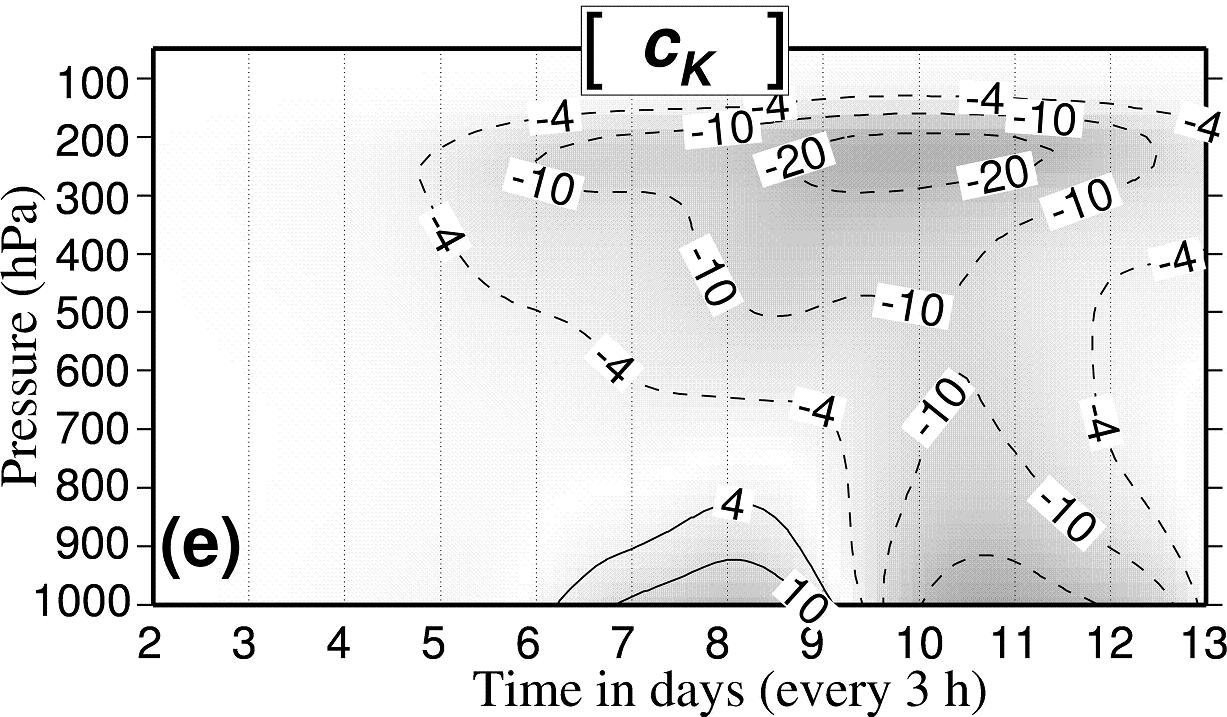
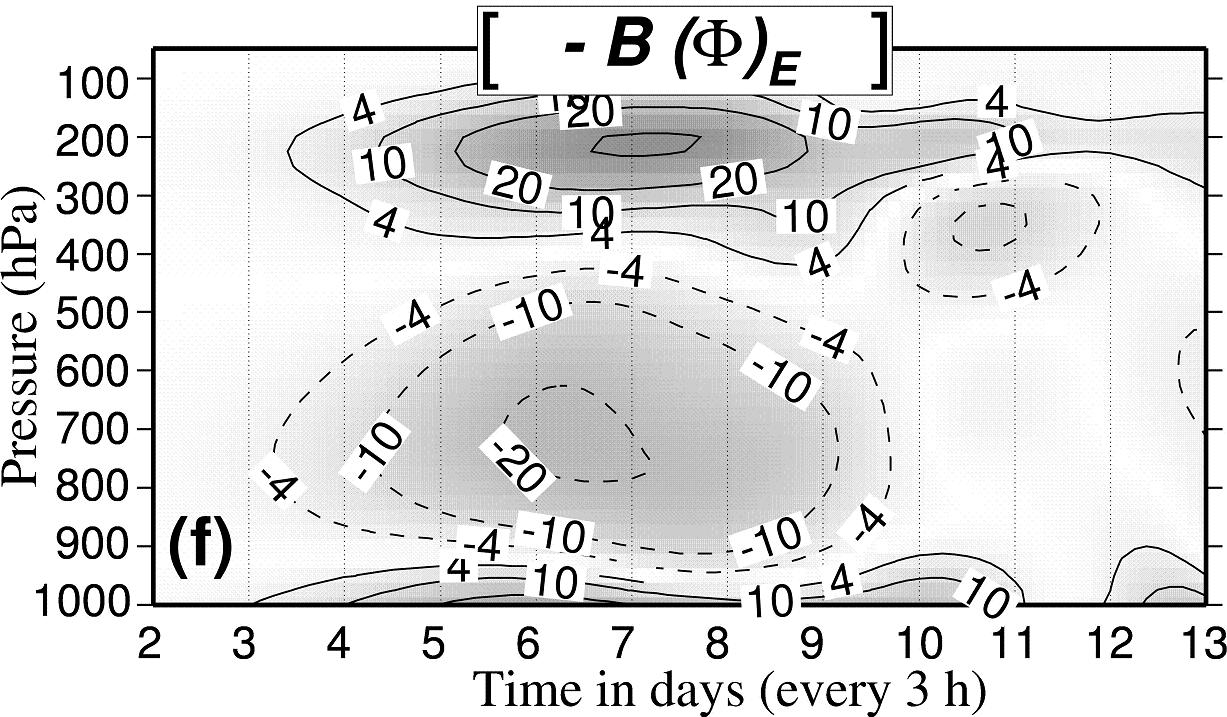
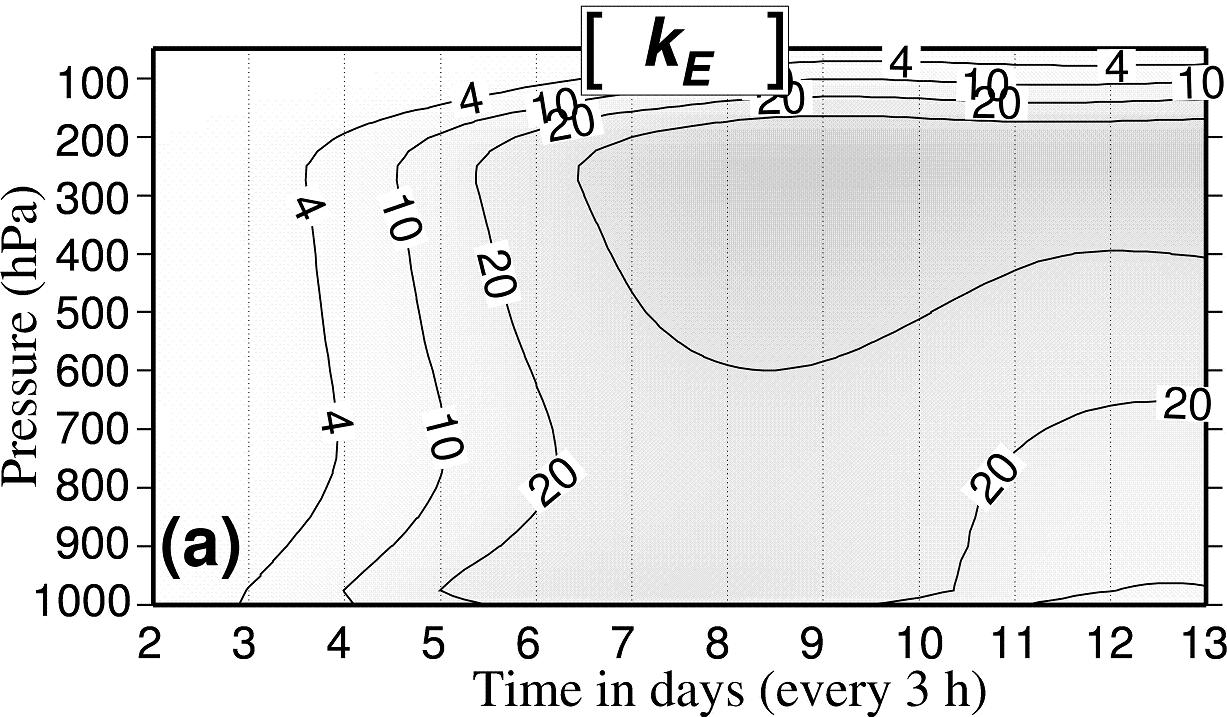
There are two maximum values for in Fig. 4 (a) at day . The first maximum is located just below the jet at hPa and the other one is located at the surface. A relative minimum is observed up to day in the middle troposphere between and hPa.
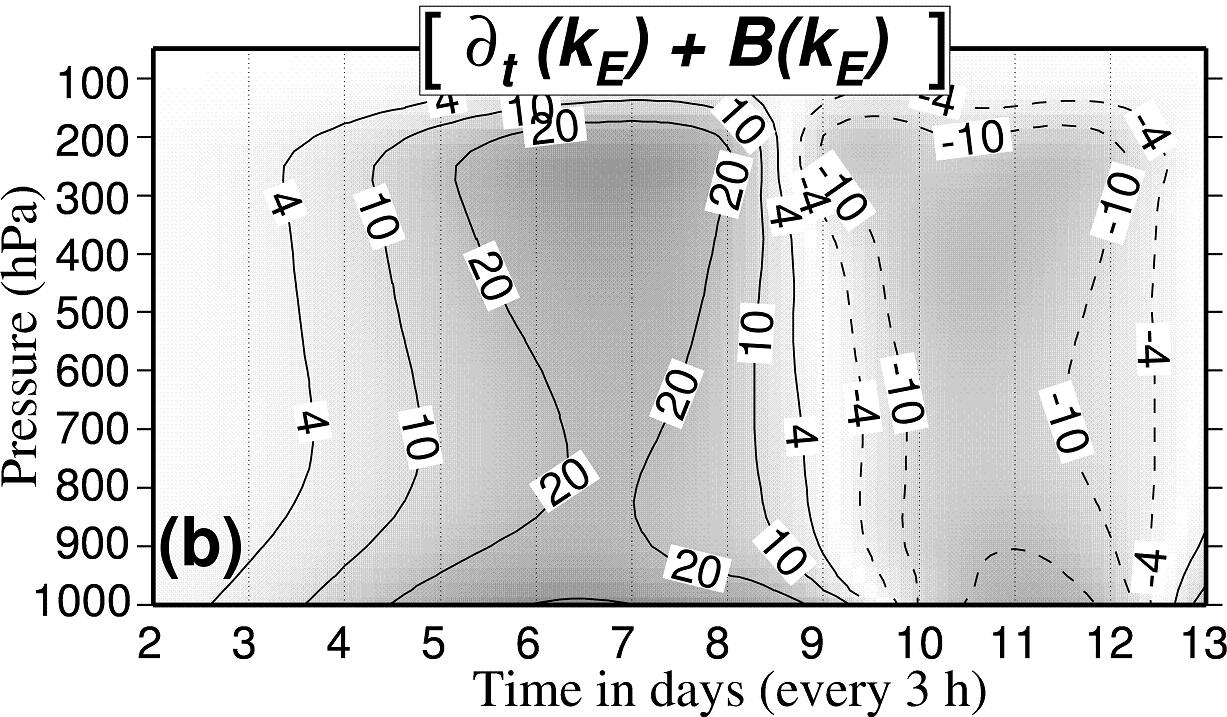
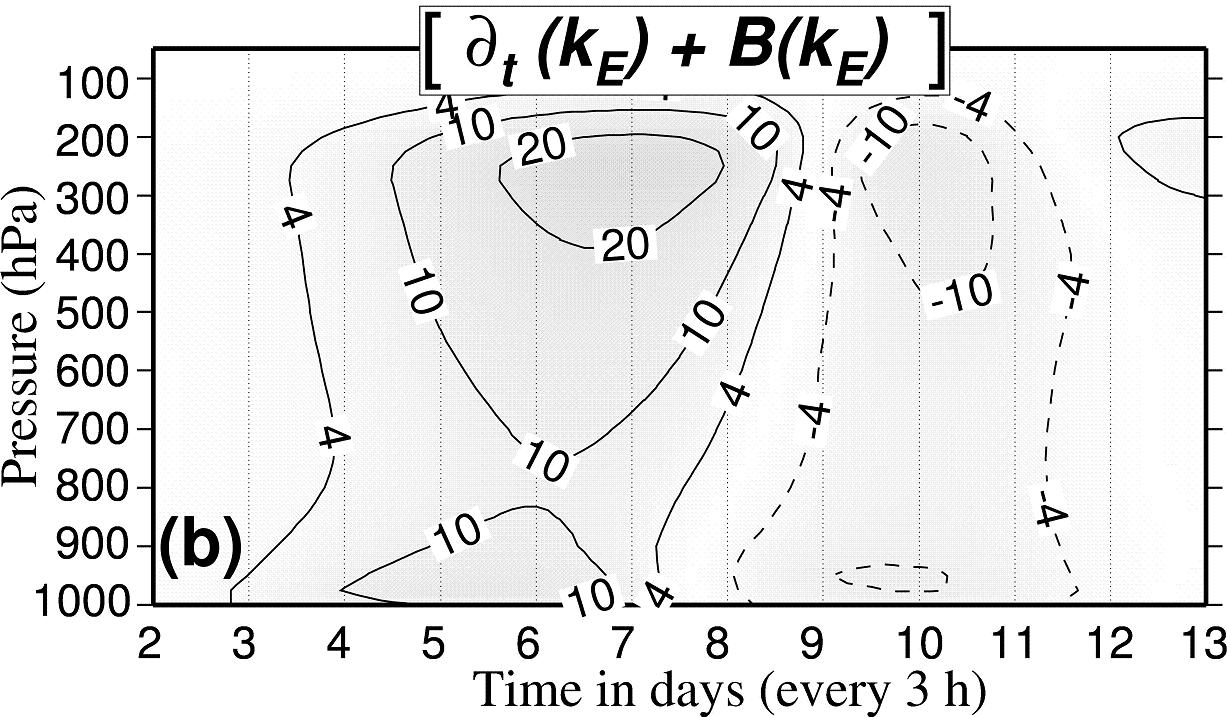
Figures 4 (b)–(f) are expressed with a common unit of W kg-1. The total change in time is depicted in (b) including the boundary flux term, with observed small values for (not shown). The maximum and minimum values are located, as for Fig. 4 (a), at the surface and at about hPa (at days for the maximum and at day for the minimum).
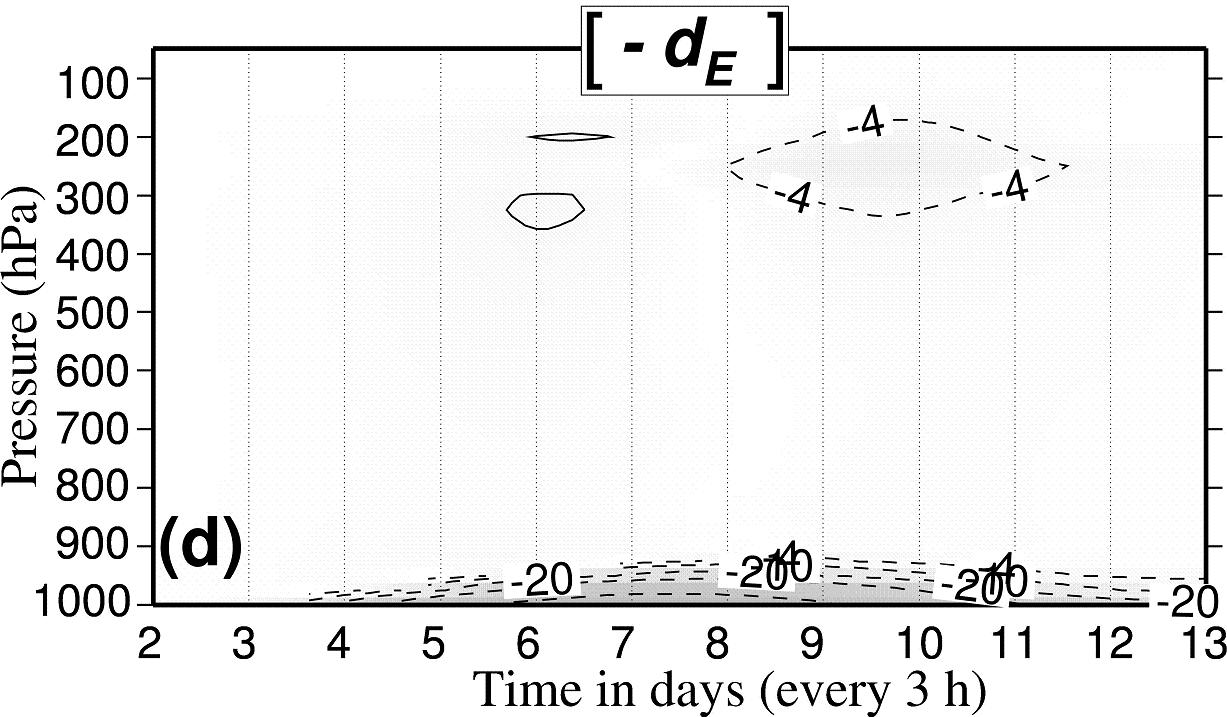
The equation for corresponds in Fig. 4 to: (b)(c)(e)(f)(d). An expected result is that the dissipation in Fig. 4 (d) for such an adiabatic simulation should be small in comparison with others terms Figs. 4 (b), (c), (e) and (f), for all levels and at any time. And indeed, the isopleths for units appear only in Fig. 4 (d) at the levels and at the moment when absolute changes in are maximum in Fig. 4 (b). Therefore, the dissipation for this adiabatic simulation is only due to errors in the numerical schemes already mentioned. It is demonstrated that, on a local stage, there are no missing terms in (36) of Part I because, in that case, any forgotten or approximated terms would have contributed with an opposite sign to the residual in Fig. 4 (d).
Figure 4 (b) shows a growing stage of the eddy kinetic energy from day to day , associated with a large domain of positive values visible from the surface up to hPa, followed by a depletion stage corresponding to negative values after day . These growing and decreasing stages for are usually associated with baroclinic and barotropic developments, respectively. However, if the baroclinic and barotropic conversions in Fig. 4 (c) and (e) have he correct sign to partly explain the total change of in Fig. 4 (b), direct comparisons of Figs. 4 (c) and (b) show that the fields are out of phase.
Maximum values observed in the middle troposphere for correspond to minimum values in Fig. 4 (b). Similarly, maximum values for the total change in Fig. 4 (b) close to the jet and at the surface are associated with small values of .
A possible explanation for the difference between Figs. 4 (b) and (c) is to consider that the term in Fig. 4 (f) exports the positive middle-troposphere baroclinic input of energy toward the surface and the jet. This mechanism has been described in Orlanski and Sheldon, 1995 (hereafter referred to as OS95) as vertical redistributions of energy via work done by pressure forces. It is also in agreement with the fact that Fig. 4 (f) is neglected in global study of L55 because vertical redistributions correspond to small or zero integral values over the depth of the atmosphere (not shown).
Figure 4 (f) shows a complex pattern for the vertical redistribution term . Positive values close to the surface are the main source for the developments of the mode. It is true for the maximum of units observed at day in Fig. 4 (b) which is partitioned into units from in Fig. 4 (d), units from in Fig. 4 (e), units from in Fig. 4 (c) and units from in Fig. 4 (f). The larger term is the positive vertical redistribution Fig. 4 (f) rather than the baroclinic conversion.
Negative values in the middle troposphere for Fig. 4 (f) are almost balanced by the baroclinic conversion Fig. 4 (c). This baroclinic conversion cancels out above the hPa level and the positive values between and hPa for are the only contribution among Figs. 4 (c), (d), (e) or (f) that can explain the growth of for the stratospheric part of the jet (above the level hPa). Therefore the direct conversion between and plays a major role in energetics of stratospheric circulations when is considered.
The barotropic conversion in Fig. 4 (e) partly explains the depletion stage of the mode, with negative values for the jet and in the boundary layer after day . However negative values after day in Figs. 4 (d) and (f) are two other contributions for the decrease in . As for the positive values for in the boundary layer from day to day , they could be interpreted as a barotropic instability. Nevertheless, this explanation will not be confirmed for EXP-HV when the vertical diffusion scheme is activated. These spurious barotropic instabilities are the result of a lack of surface dissipation in adiabatic simulations.
4.4 Local results for (diabatic simulation).
Results for the diabatic simulation EXP-HV with both horizontal and vertical diffusions acting together are presented on Fig. 5 for . When comparing EXP-H and EXP-HV, the differences are not important for the total change in Fig. 5 (a) for the upper troposphere (above the hPa level) and close to the jet. Differences are more important in the boundary layer between and hPa when they are associated with the vertical diffusion scheme. The maximum of occurs at day , two days ahead in comparison with EXP-H. The maximum growth of the mode in Fig. 5 (b) has decreased from to units in the boundary layer with respect to Fig. 4 (b). A vertical displacement of this maximum is observed for the diabatic simulation: it rises from the surface to or hPa levels (the first diagnostic pressure levels).
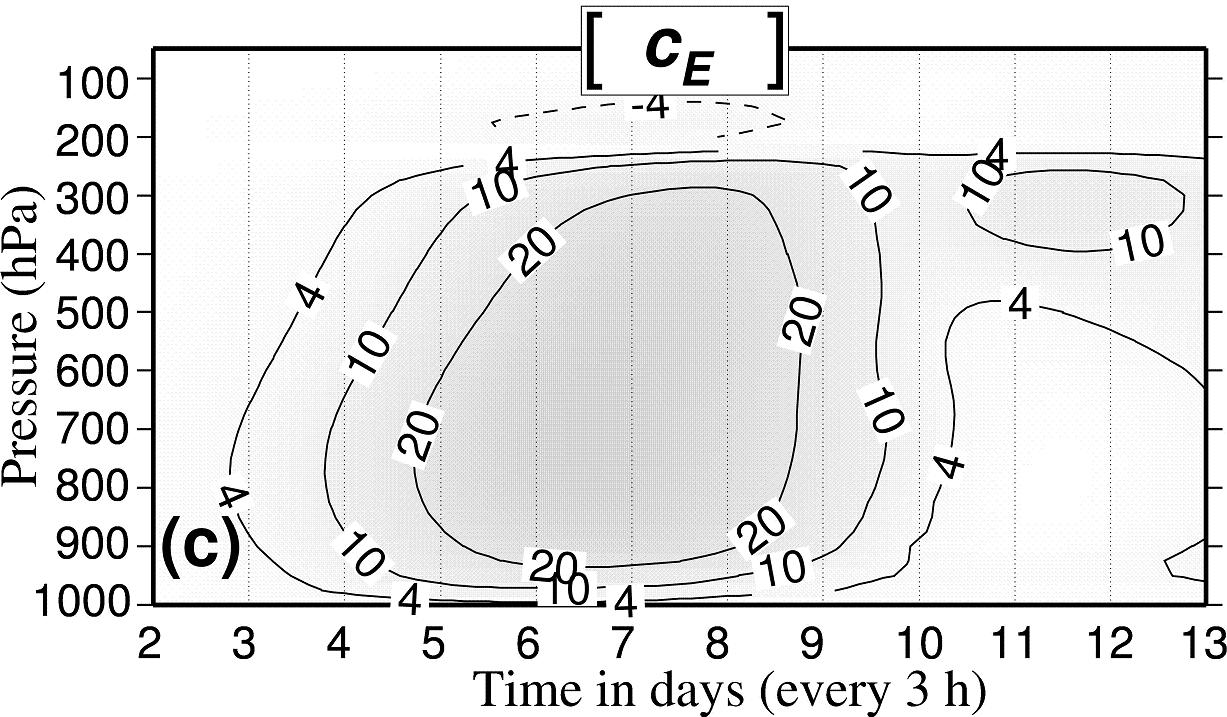
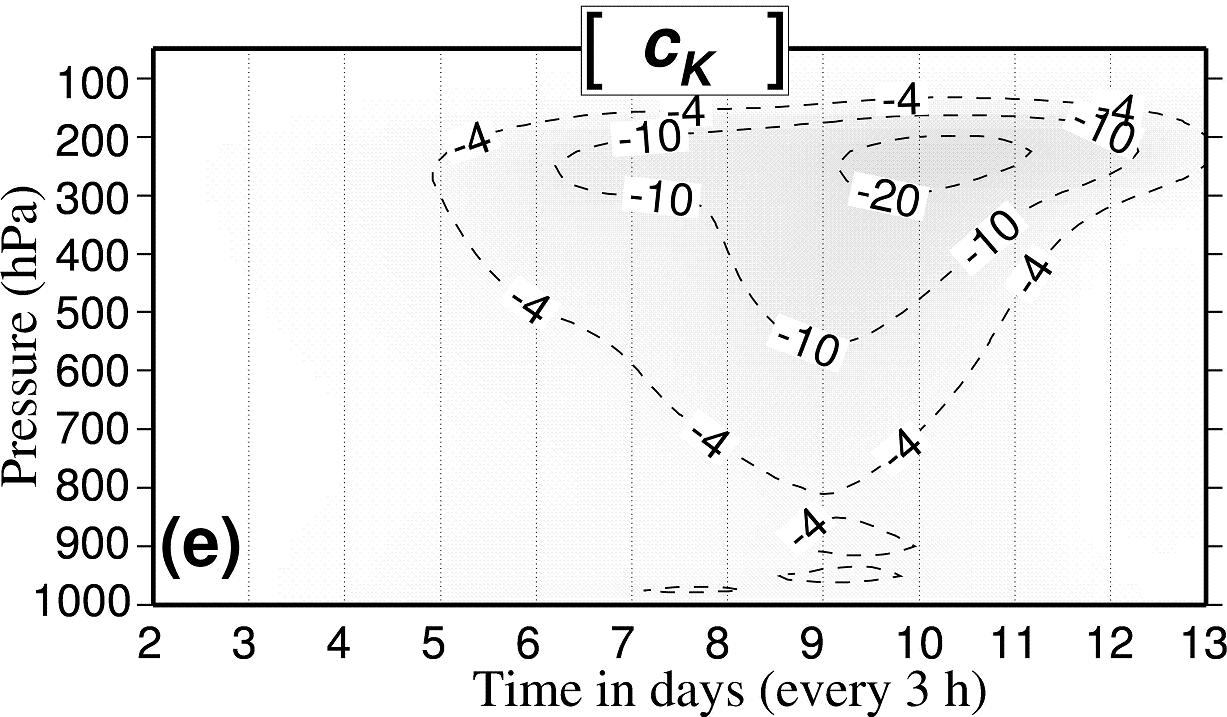
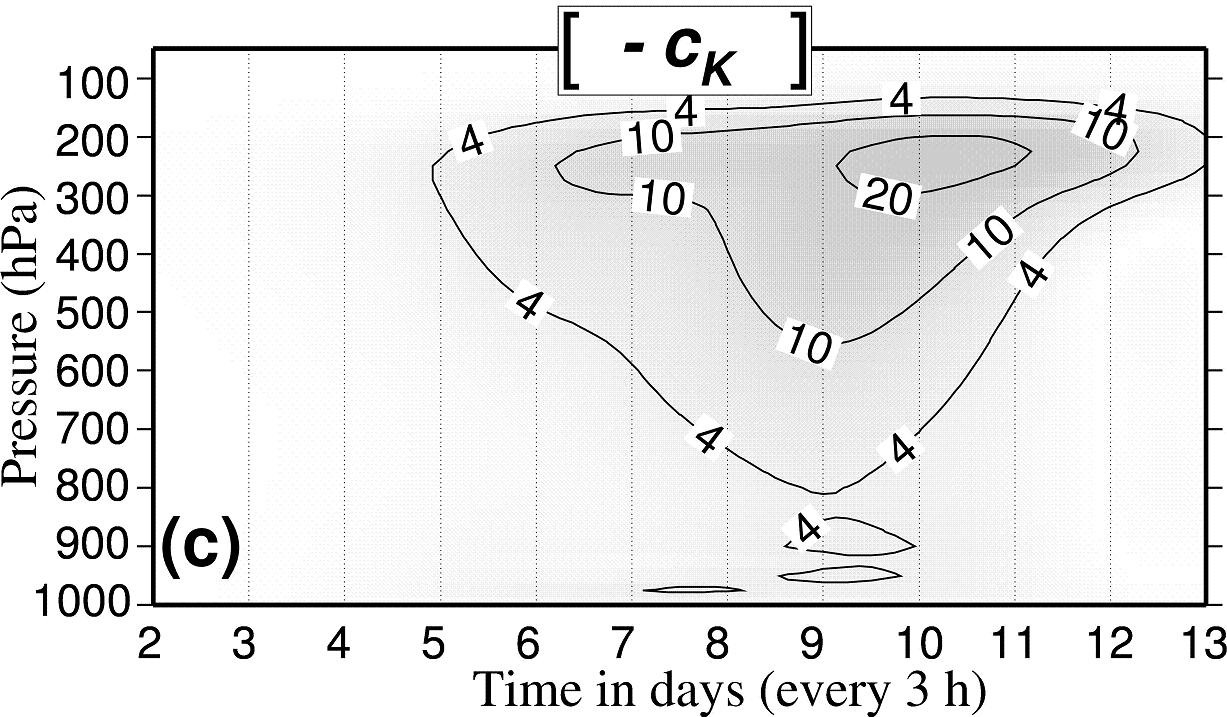
Even if general characteristics are left unchanged between Figs. 4 (c) and 5 (c), baroclinic conversions decrease for all days and for all levels when the vertical diffusion is activated. There are large values ( units) in the middle troposphere, with small values close to the surface and at the levels above hPa. As for the barotropic conversion, comparisons of Figs. 4 (e) and 5 (e) show large modifications occurring below the level hPa, where the unrealistic positive and negative maximum observed at days and for EXP-H disappear. The result is a barotropic decrease of the mode for the jet after day , but with no equivalent barotropic stabilisation close to the surface. As a consequence, the decrease of the mode in the boundary layer after day in Fig. 5 (b) must be explained by non-barotropic components, i.e. the dissipation and/or the conversion .
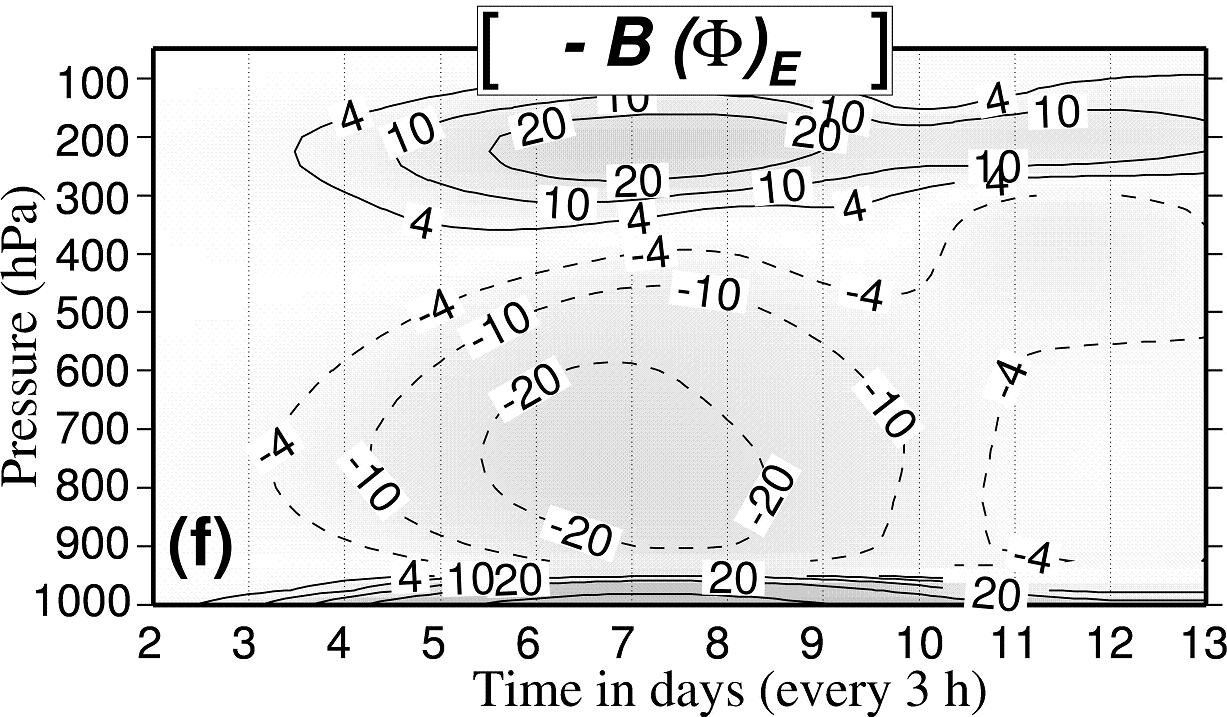
Although the dissipation is, as expected, weak at all levels for the adiabatic simulation in Fig. 4 (d), large negative values are observed in Fig. 5 (d) in the boundary layer ( units). They correspond to large and expected dissipations created by the vertical diffusion scheme and by the surface friction. As in EXP-H, values for above the level hPa where the vertical diffusion is not active are small in comparison with those in Figs. 5 (b), (c), (e) and (f). It is a local validation for the cycle (36) of Part I, obtained for the diabatic simulation in the free atmosphere.
The validation of large values for in Fig. 5 (d) must be carefully realized. Indeed, many authors have obtained similar large dissipation terms computed as residuals and associated with large boundary terms (Muench 1965, Brennan and Vincent 1980, Michaelides 1987). They consider these large dissipation terms as not reliable. However, in this diabatic study, it seems that large negative values for in the boundary layer are balanced by large positive counterparts observed for in Fig. 5 (f). The sum of Figs. 5 (d) and (f) is presented in Fig. 6 (a). The balance between and is established close to the surface, leading to moderate positive values up to day for the sum ( units), whereas they reach units separately.
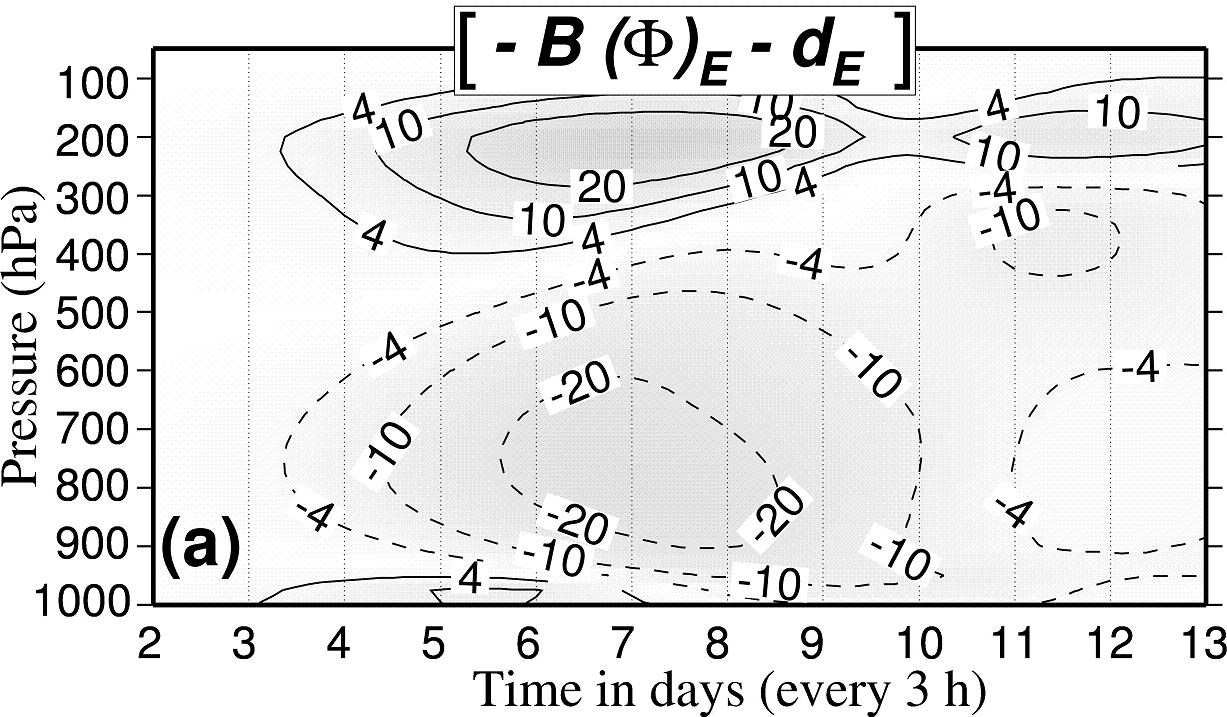
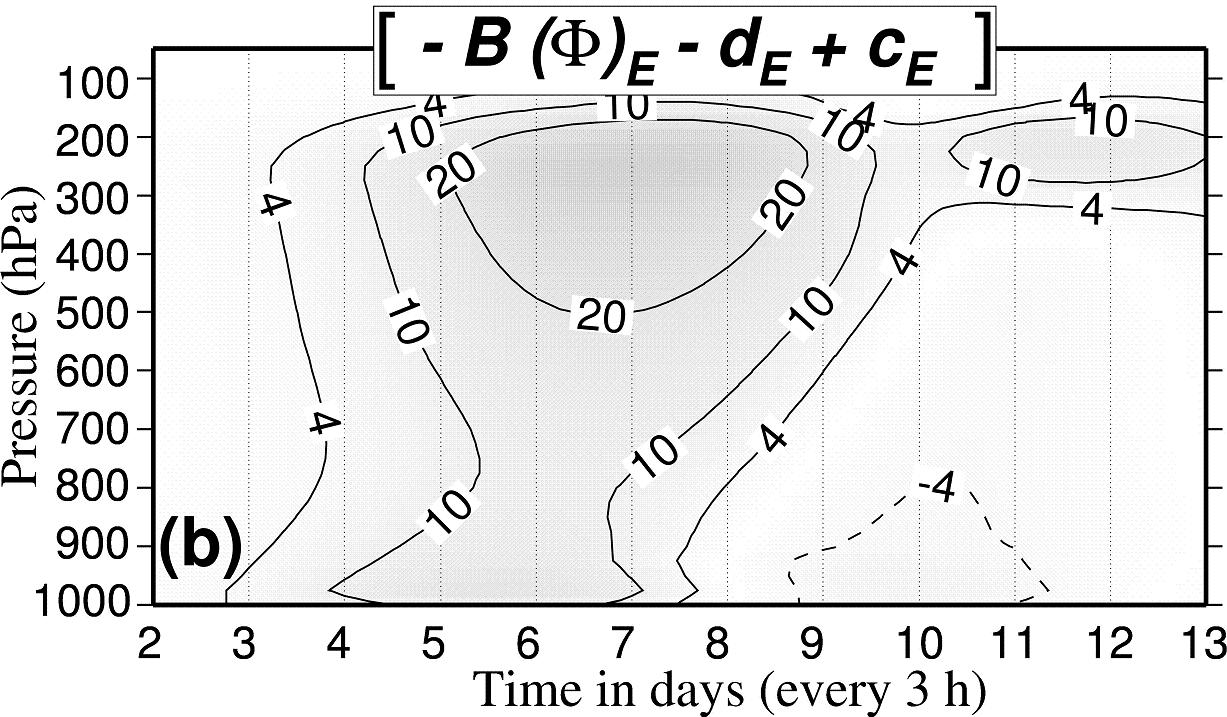
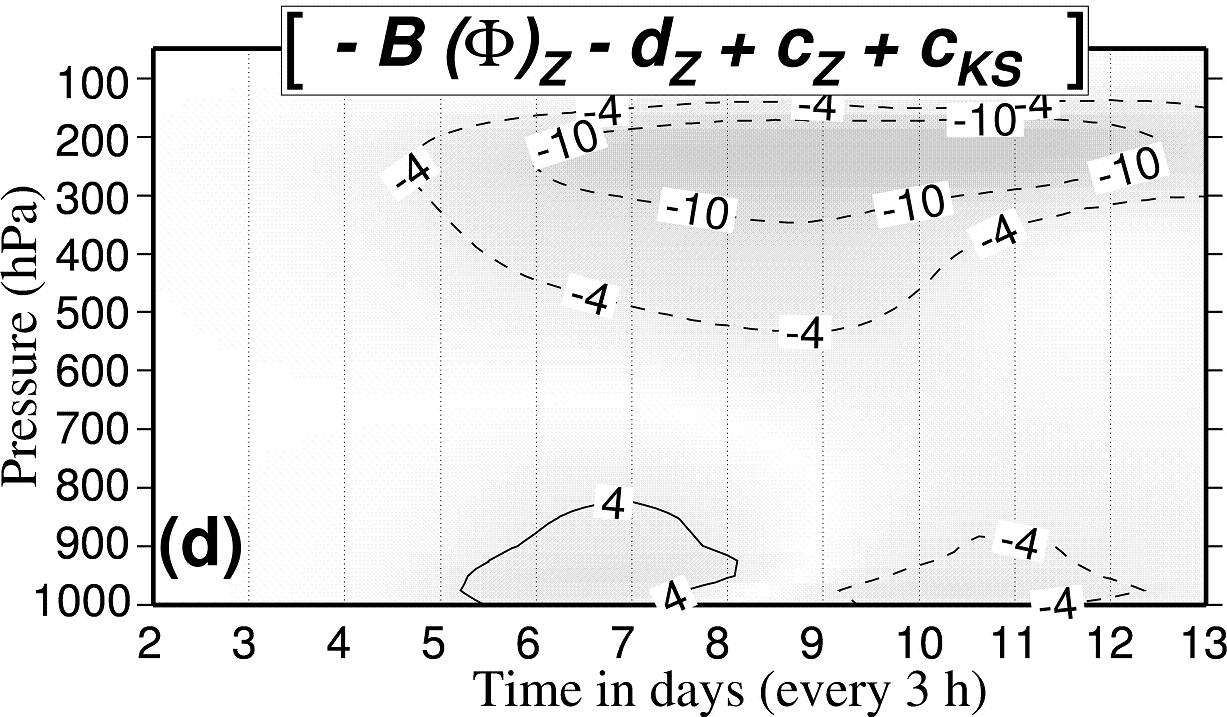
The equation for in (36) of Part I can be further modified by adding the baroclinic conversion to the sum , to give the non-barotropic part of the total change of depicted in Fig. 6(b). If the barotropic part in Fig. 5 (e) is easy to interpret, the non-barotropic part in Fig. 6 (b) is a new combination of terms. As explained in (49) of Part I, it is the sum of the eddy dissipation plus the work of eddy part of the pressure force, leading to
| (5) |
The depletion stage of the mode is represented by negative values in the boundary layer after day in Fig. 5 (b). A surprising result is that this decreasing of the mode is not exclusively due to the barotropic conversion in Fig. 5 (e). It is also a consequence of the negative values observed in the boundary layer for the non-barotropic part defined by (5). The maximum of units at day close to hPa in Fig. 5 (b) is separated into units for in Fig. 5 (e) and units in Fig. 6 (b). The non-barotropic part is thus the largest term.
By defining (5), a cancellation of the baroclinic conversion is obtained and, similarly to OS95, divergence of ageostrophic geopotential fluxes appear to be the main feature in local energetics of baroclinic systems. Indeed, (5) can be interpreted as an equilibrium between the dissipation and the energetic impacts of ageostrophic circulations. The computations of the eddy terms in (5) are done with a zonally symmetric Coriolis term, leading to . The result is that the eddy part of the pressure force may be written as
The eddy conversion term then becomes
Using both and the property and without loss of generality, (5) depicted in Fig. 6 (b) can thus be rewritten as
There is a conversion if the ageostrophic wind is different from zero and if it not parallel to . However, this formulation differs from the vertical redistribution of energy described in OS95 paper because it is not a divergence of some ageostrophic geopotential fluxes, in the form , for instance.
4.5 Integral results for (diabatic simulation).
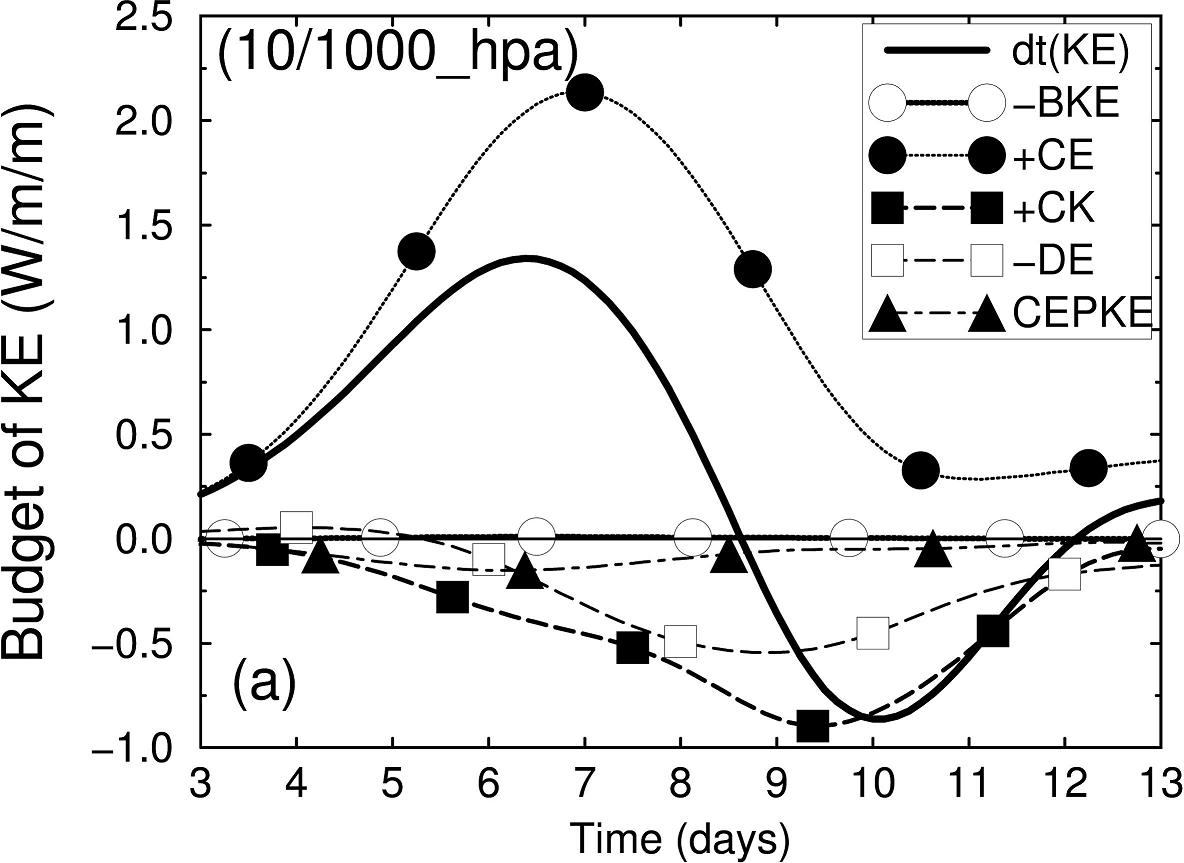
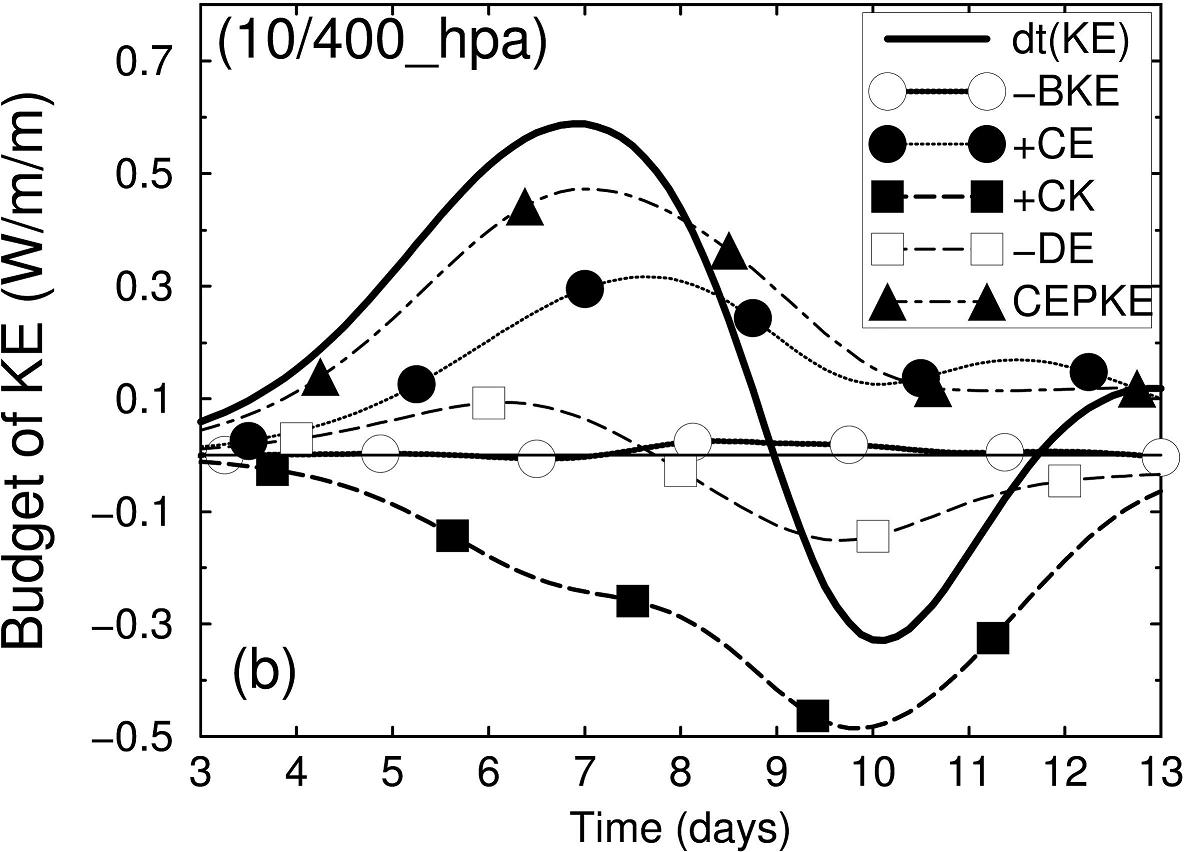
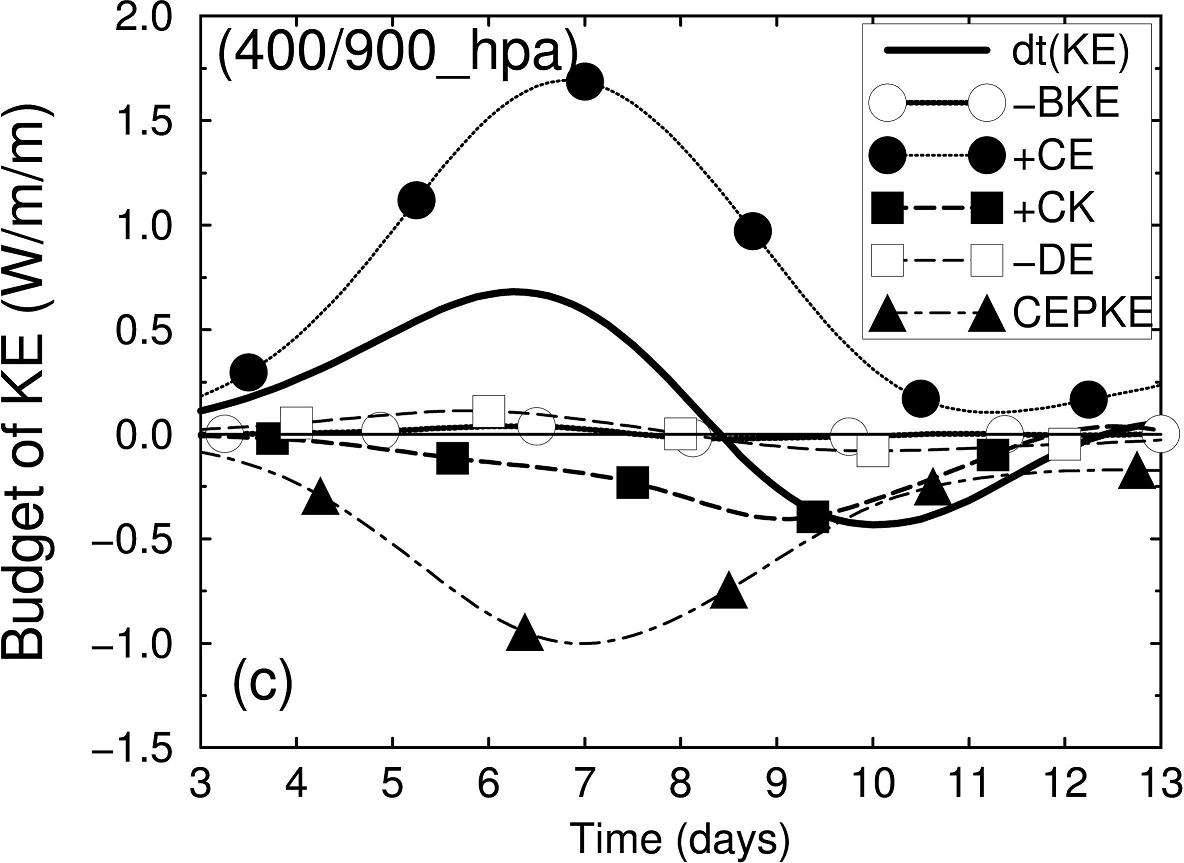
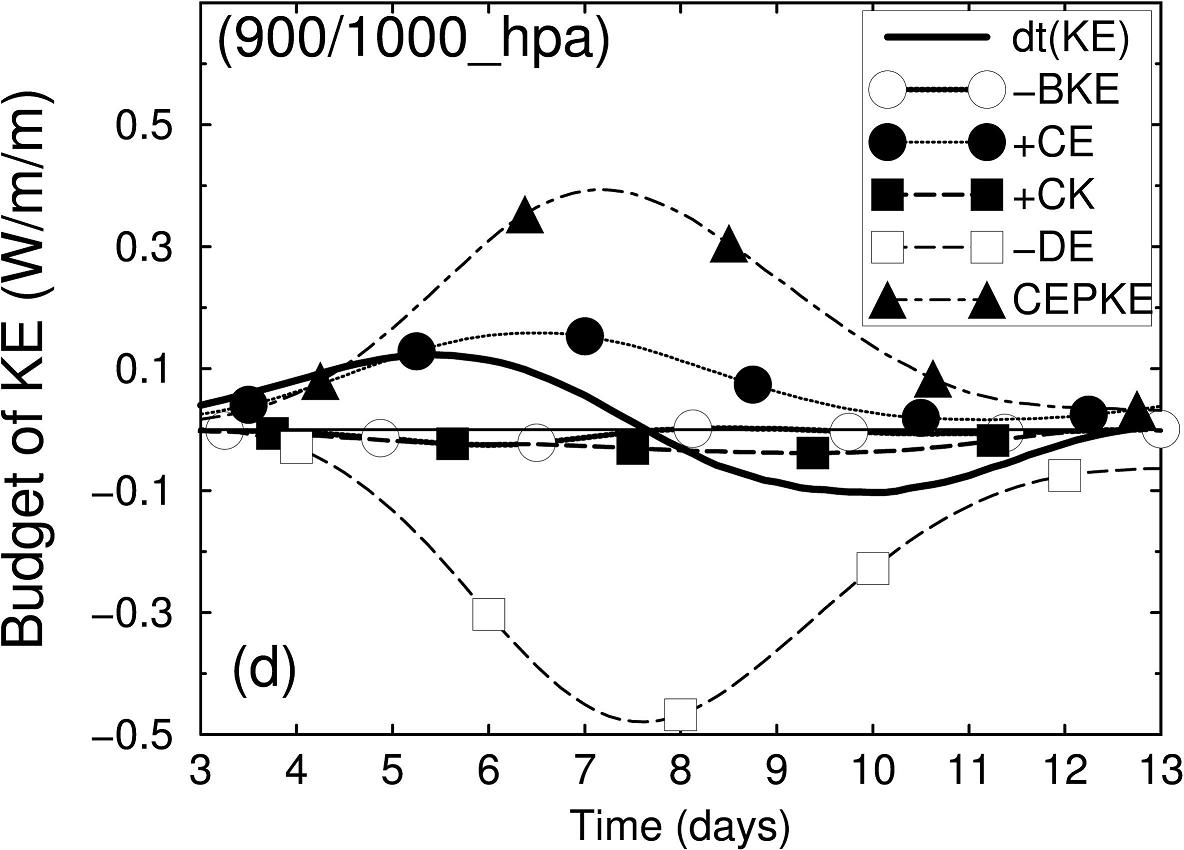
The five “time–pressure” diagrams (Figs. 5 (b)–(f)) exhibit complex patterns, with several minimum and maximum values located at different levels. It seems worthwhile, however, to investigate the budget equation for for three homogeneous layers: (i) the planetary boundary layer (from to hPa), (ii) the middle troposphere (from to hPa) and (iii) the stratosphere and the jet ( to hPa). A fourth global layer will also be considered: the integral from to hPa corresponding to the global available-enthalpy cycle.
The global case is presented in Fig. 7 (a) for EXP-HV. As expected, the increase in up to day (positive values for the tendencies) is mainly controlled by the positive baroclinic conversion, with smaller negative contributions produced by the barotropic conversion and the dissipation terms. The boundary term is very small and it is not considered in the global studies (L55, P78).
The additional global conversion denoted by CEPKE in Fig. 7 (a), is smaller than other terms (except ). It is usually neglected in global studies (L55 and P78). However it reaches W m-2 at day , a value equal to half the barotropic conversion in the growing stage of the mode. As already mentioned in Part I, this term is not a real boundary term, i.e. , and its vertical integral must not cancel out. Locally observed large values of in Fig. 5 (f) and small corresponding global values of CEPKE in Fig. 7 (a) lead to a justification for the concept of vertical redistribution of energy described in OS95 (see sections 4.3 and 4.4). As a consequence, should appear both in local and global studies.
The budget of for the middle troposphere in Fig. 7 (c) is almost similar to the global case, although observed negative values of CEPKE are much larger according to the large negative region in Fig. 5 (f). Another difference is that the dissipation is very small, owing to the distance from the jet and from the surface where eddy diffusion and ageostrophic circulations occur preferentially. Clearly, the barotropic and the baroclinic terms alone cannot explain the budget of . In the middle troposphere, the leading terms are , and , in decreasing order.
In the stratosphere and for the jet, the growing stage of the mode in Fig. 7 (b) correspond to a balance between positive barotropic and negative baroclinic components. The additional vertical redistribution term is positive and it is the largest term up to day . Like the baroclinic conversion , it can explain the increase of . The small eddy dissipation is positive and then negative, reaching W m-2 at day and W m-2 at day , like for the middle troposphere case.
As expected, the depletion stage of the mode after day in Figs. 7 (a) and (b) corresponds to global negative values for the dissipation and for the barotropic conversion. However the decrease of after day for the middle troposphere in Figs. 7 (c) is caused by negative values for barotropic conversion and , with a very small contribution from eddy dissipation.
In the planetary boundary layer, changes in in Fig. 7 (d) correspond to positive values for the baroclinic conversion, at least up to day . But the dominant feature in this diagram is the balance between the large terms and . Results derived in section 4.4 show that the total balance between the three terms is equal to . The depletion stage of the mode is due to observed negative values in the Ekman layer for this total balance, because the effect of ageostrophic circulations and eddy dissipation do not exactly compensate each other. This is only true for the Ekman spiral.
4.6 Ekman dissipation for diabatic simulations.
Explanations for the balance between large positive and negative values for
as observed in the boundary layer in Figs. 5 (d), 5 (f) and 7 (d), are given in this section. It is demonstrated that the two terms have opposite signs with exactly the same magnitudes in the case of an idealized Ekman spiral, in which case the non-barotropic part (5) is zero in the boundary layer.
If the horizontal wind and the frictional force are expressed in the complex form
the dissipation is equal to the real part and it can be verified that the conversion term due to the ageostrophic wind is equal to , where the overbars represent complex conjugates.
In complex formulation, the Ekman spiral frictional force due to the vertical dissipation scheme is given by and for this value the dissipation due to the vertical diffusion is exactly compensated by the conversion created by ageostrophic secondary circulations, or equivalently
The common value for can be computed by using the Ekman spiral for a general surface angle and for a height of planetary boundary layer given by . In complex form, the ageostrophic wind is written
| (6) |
where the scale height equals for the zero surface wind case ; it becomes smaller than for decreasing and increasing surface wind (ex. for ). The conversion is computed by using (6) and , to give
| (7) |
The maximum value for is obtained by cancelling the derivative with respect to of the function . The height for this maximum is equal to . For , this expression reduces to . It gives for (latitude ), for (latitude ) and for (latitude ).
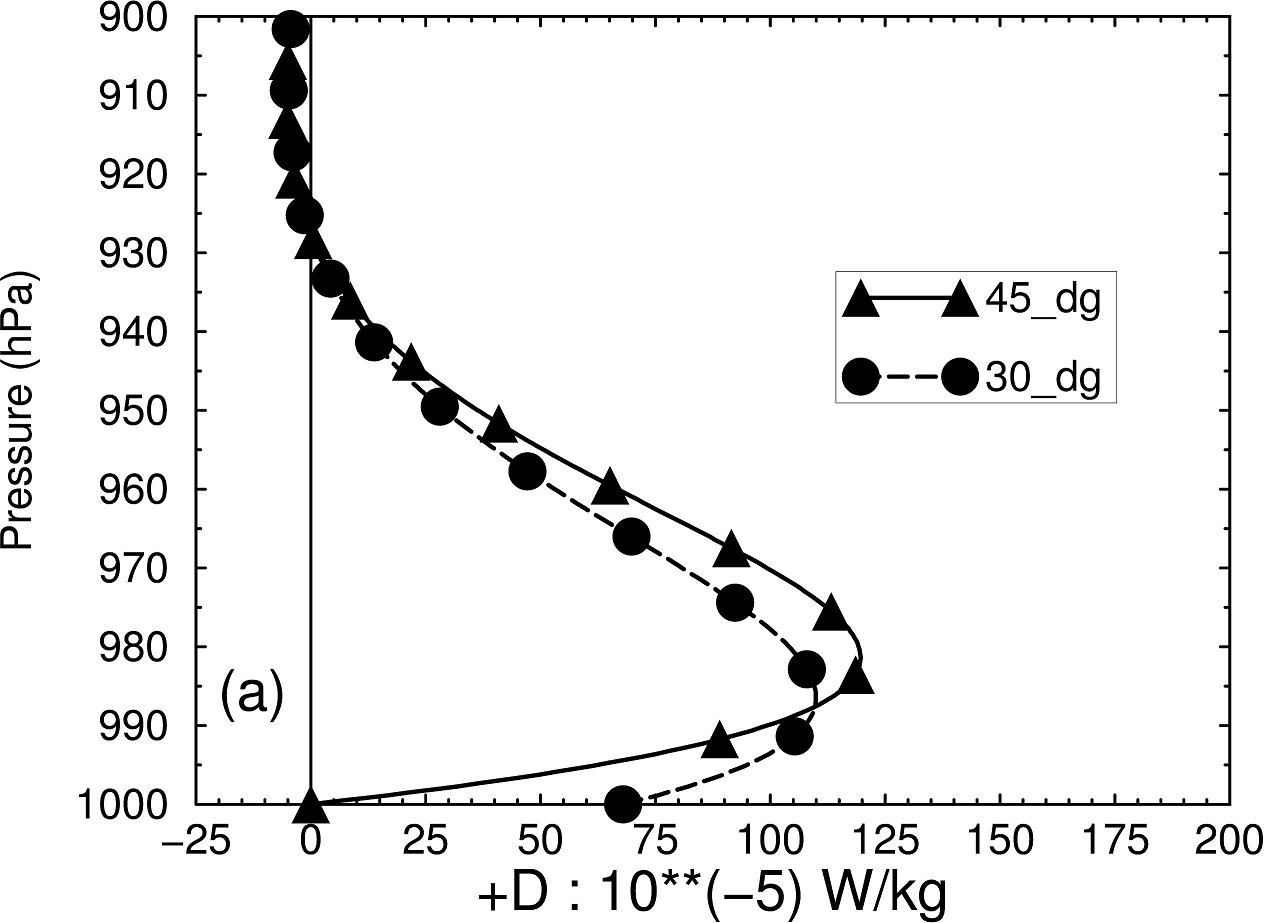
Examples of different dissipation terms () for idealized Ekman spirals are presented in Fig. 8 (a) for two surface angles ( and ) and with a high vertical resolution. The height of the maximum for is lower for the case N, in agreement with the values and for N and N, respectively.
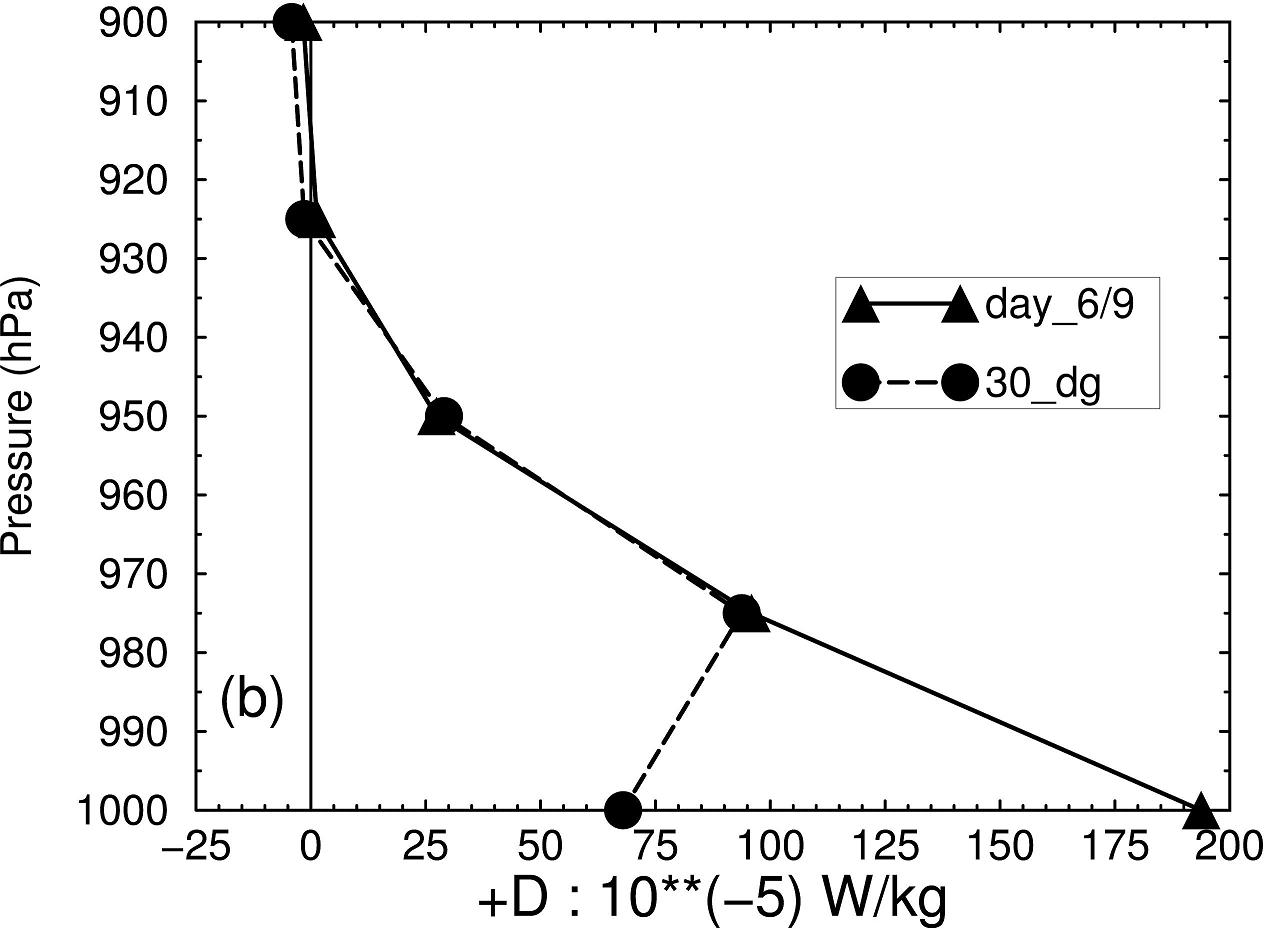
Equation (7) is used with a height of the boundary layer set to m, corresponding to the pressure hPa where the dissipation cancels out on Fig. 8 (b). The Coriolis parameter for an average latitude of N is set to and the module of the geostrophic wind is set to .
Figure 8 (b) shows the successful fitting between the idealized Ekman spiral () and the averaged observed values from day to day for the diabatic simulation EXP-HV depicted on Fig. 5 (d). Dissipations in the free atmosphere above the level hPa are small and is positive as predicted by the Ekman spiral. Below the level hPa, the observed and theoretical curves can be superposed at and hPa. However the fitting cannot be obtained for the level hPa because this level is subject to several errors. Firstly the hPa post-processed level interval is coarser than the uneven model levels interval, equal to and hPa for the first ones. As a consequence the vertical differencing schemes differ. Secondly, there are interpolations and/or extrapolation of the fields for the case of surface pressure greater and/or lower than hPa, with the side effect of excluding or including unrealistic or fictitious mass of atmosphere into the energetic budget.
This interpretation of large local values for atmospheric dissipation expressed as residuals is an important result of this paper. It is the ultimate local validation of the available-enthalpy cycle (36) of Part I, giving the proof that there are no approximate or missing terms. However, the real ageostrophic circulations diverge from the idealized Ekman spiral case, because the eddy coefficients are not independent of height. It is the reason why the sum (5) depicted in Fig. 6(b) is not exactly zero and imbalances between and yield positive values in the growing stage of the mode, with observed maximum values in the boundary layer ( hPa). As for the maximum values below the jet in Fig. 6 (b), they must be interpreted in term of a balance between effects of ageostrophic circulations and the baroclinic conversion, because the dissipation is very small in this region (see Fig. 5).
4.7 Local results for and (diabatic simulation).
The equation for in the cycle (36) of Part I is similar to the equation for , but with different conversion terms and a generation term in place of the dissipation. There is no term equivalent to . Observed values for , and are small (not shown). They are less than units of W kg-1, for all levels and for the whole simulation from day to . As a consequence, there is a close balance and the eddy available enthalpy reservoir behaves like a catalytic component. There is a direct transfer of energy from toward through , with no change in .
The analysis of all terms in the equation for (results not shown) reveal that the external path “” and “” is the main feature in the troposphere, with large and opposite values leading to . There is a catalytic behaviour for , with a direct transfer of energy via the external path . In the stratosphere, values for , , , and are very small and the balance of terms is somewhat different. The decrease of close to the jet ( units) is explained by negative ageostrophic redistribution terms units and by units.
4.8 Local results for (diabatic simulation).
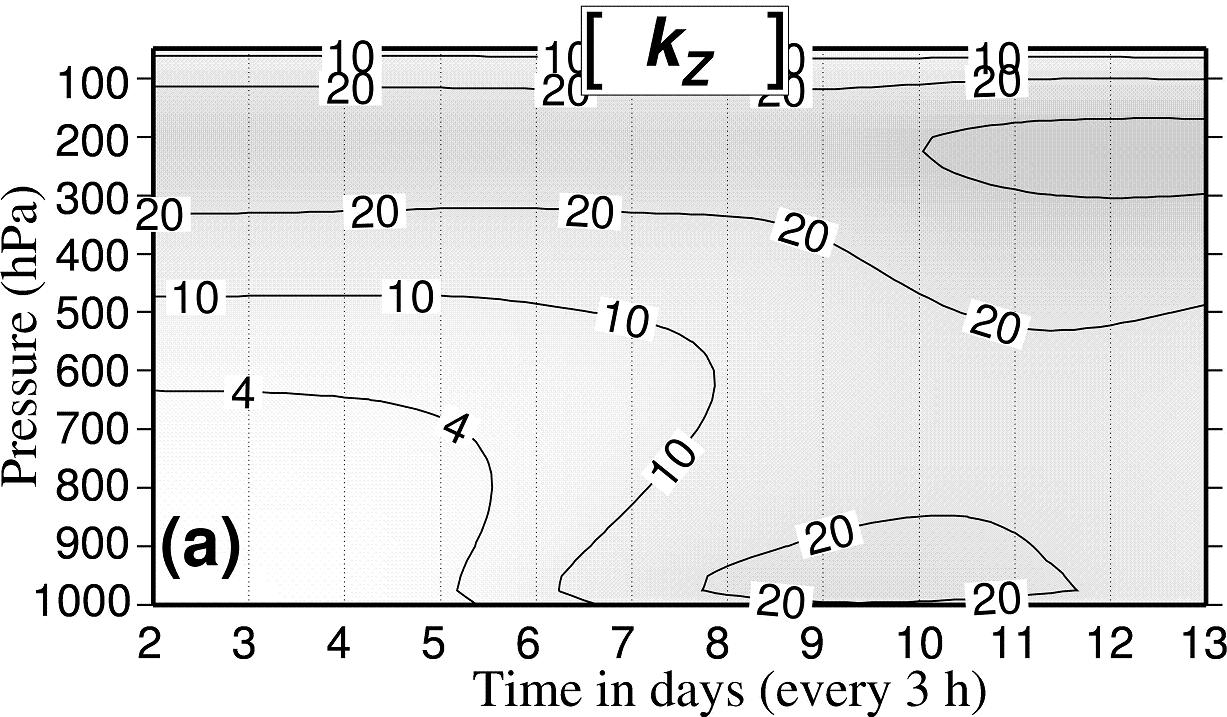
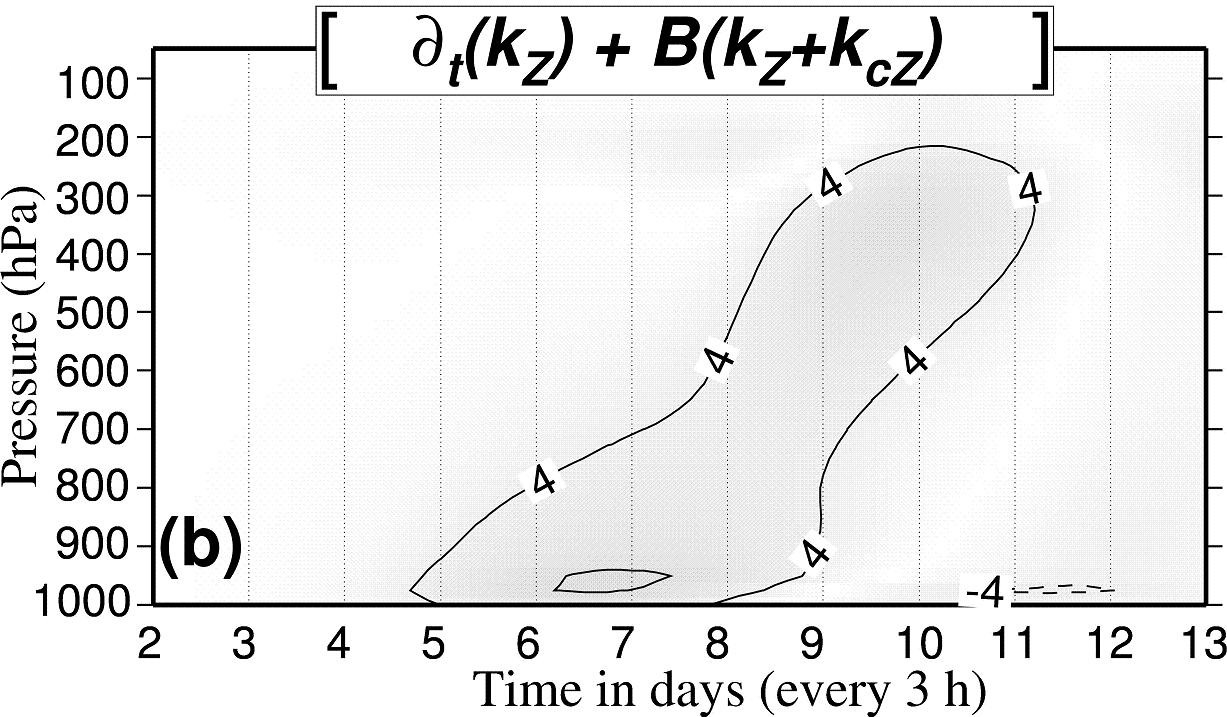
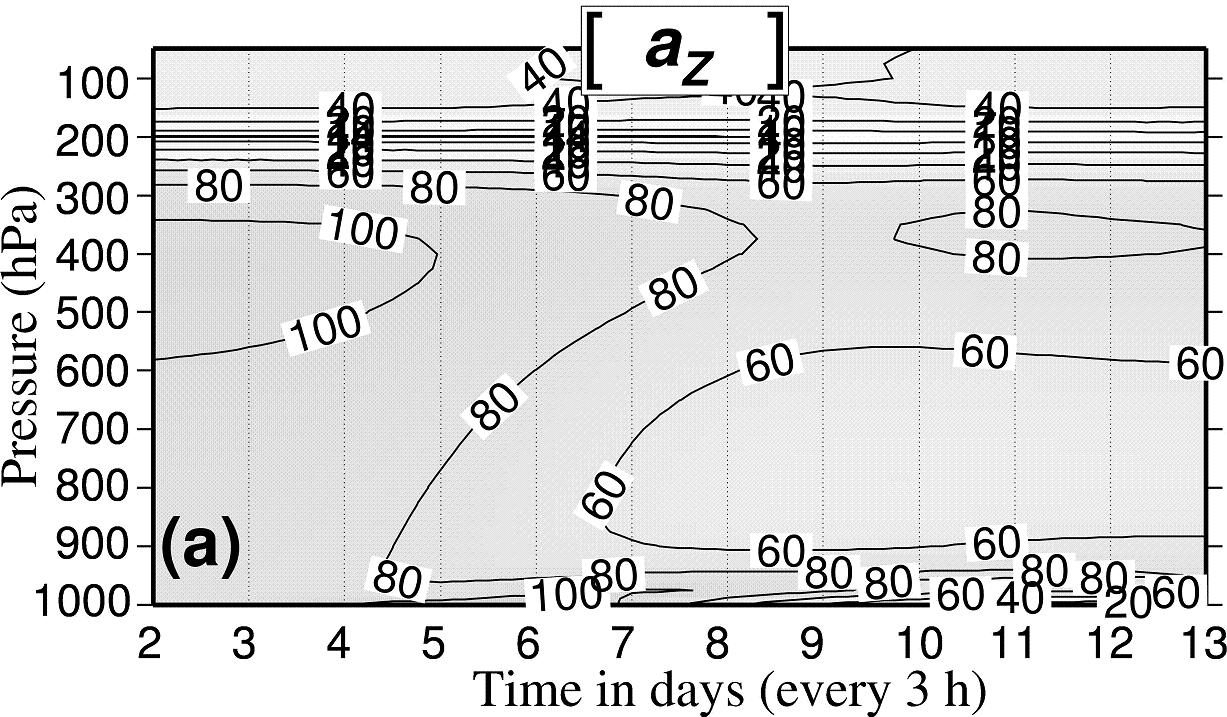
The budget for the zonal component is depicted in Fig. 9 (a). Initial values of the zonal wind described in Fig. 1 (a) lead to maximum values for from to hPa, with small values in the lower troposphere. A comparison with the eddy component depicted in Fig. 5 (a) shows that maximum values appear days later in the boundary layer, when has reached its maximum or starts to decrease. A delay of to days is also observed close to the jet. The total change in time of in Fig. 9 (b) is computed including the two boundary terms and , with (b)(c)(d). The two divergence terms for Fig. 9 (b) are small with respect to (not shown). The total change is maximum at day in the boundary layer ( hPa) and it is maximum at day just below the jet (from to hPa). The delay observed in Fig. 9 (b) in comparison with Fig. 5 (b) is day in the boundary layer and days just below the jet.
The barotropic conversion in Fig. 9 (c) can partly explain the growth of just below the jet, but the positive values for are too large and occur too early in the simulation. They are also located at elevations that are too high (from to hPa). In the boundary layer, the barotropic conversion cannot explain the growth of because there is no significant maximum in Fig. 9 (c) between days and . As a result, the change in zonal kinetic energy component is improperly determined by the barotropic conversion term.
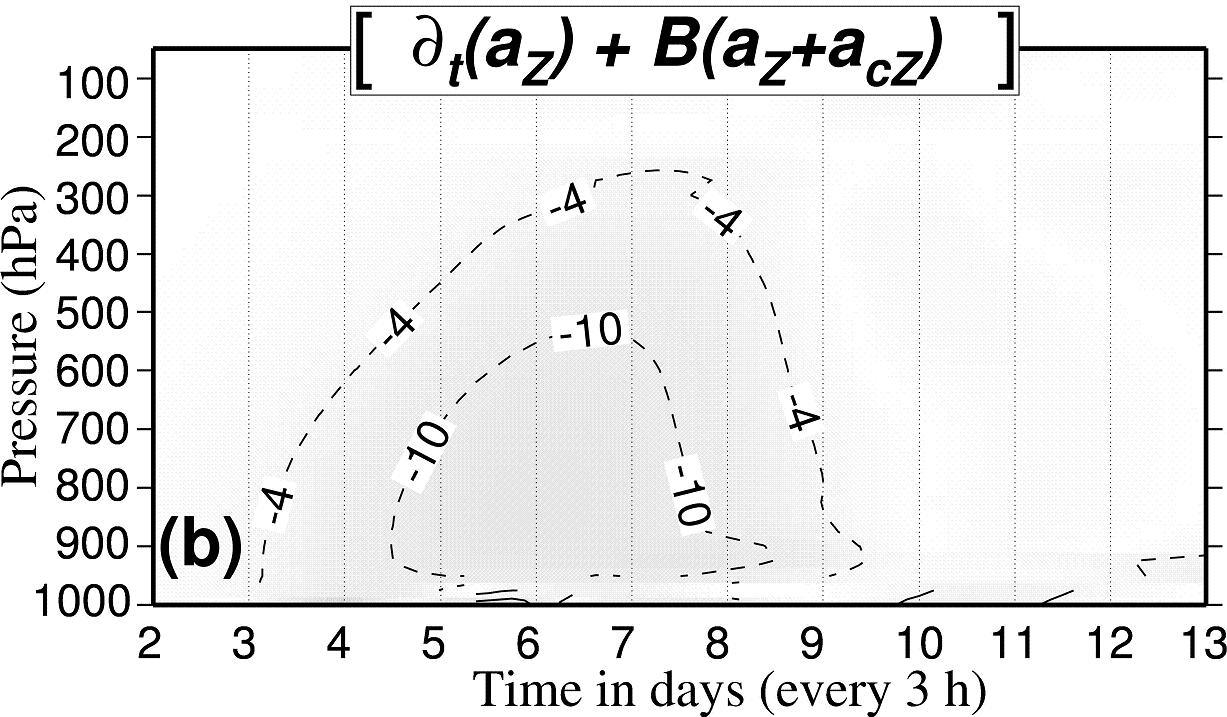
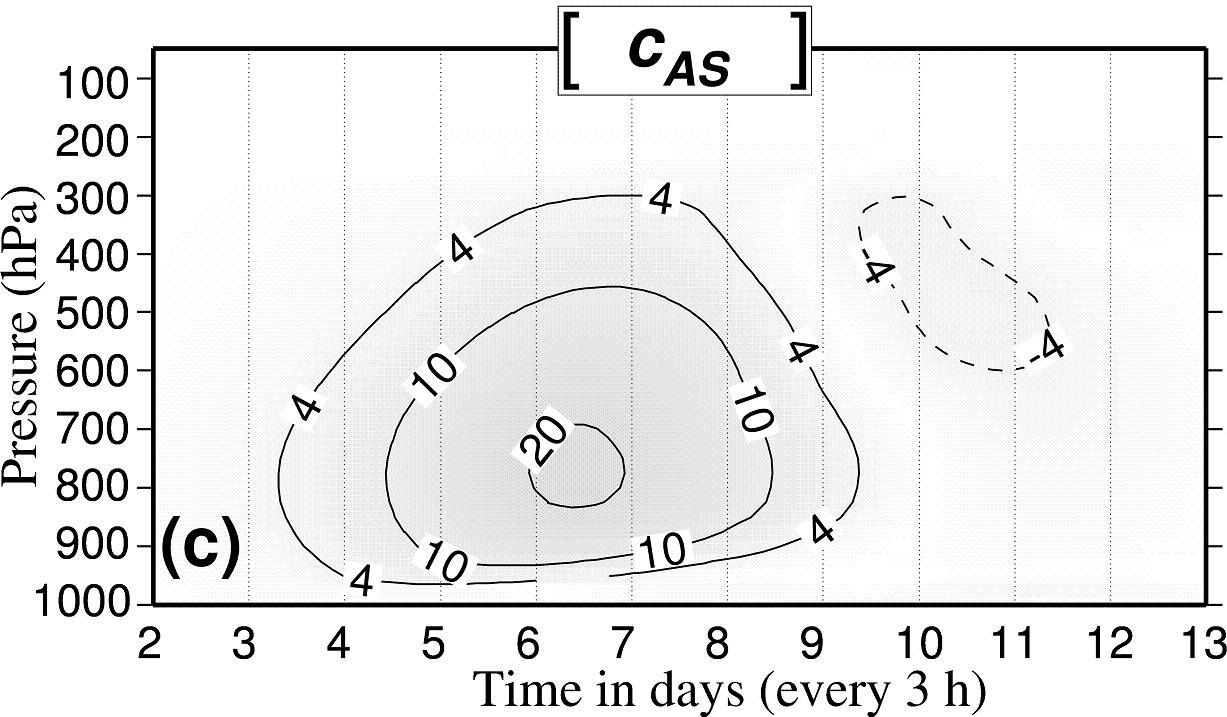
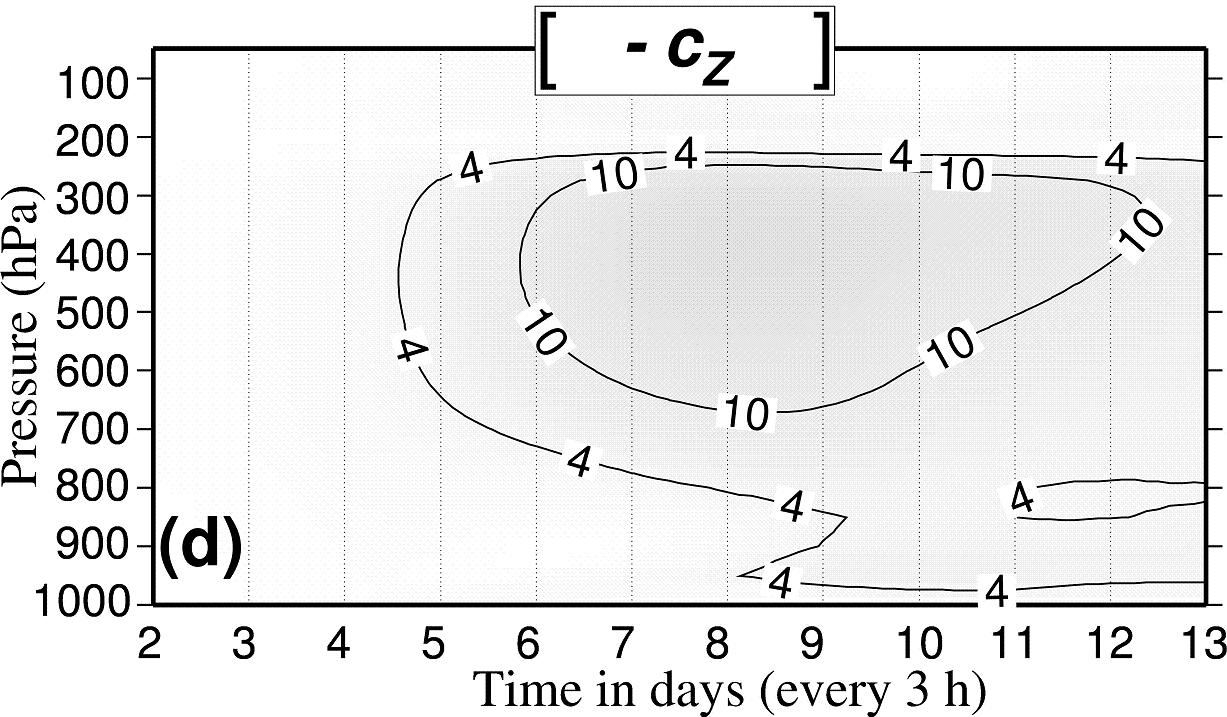
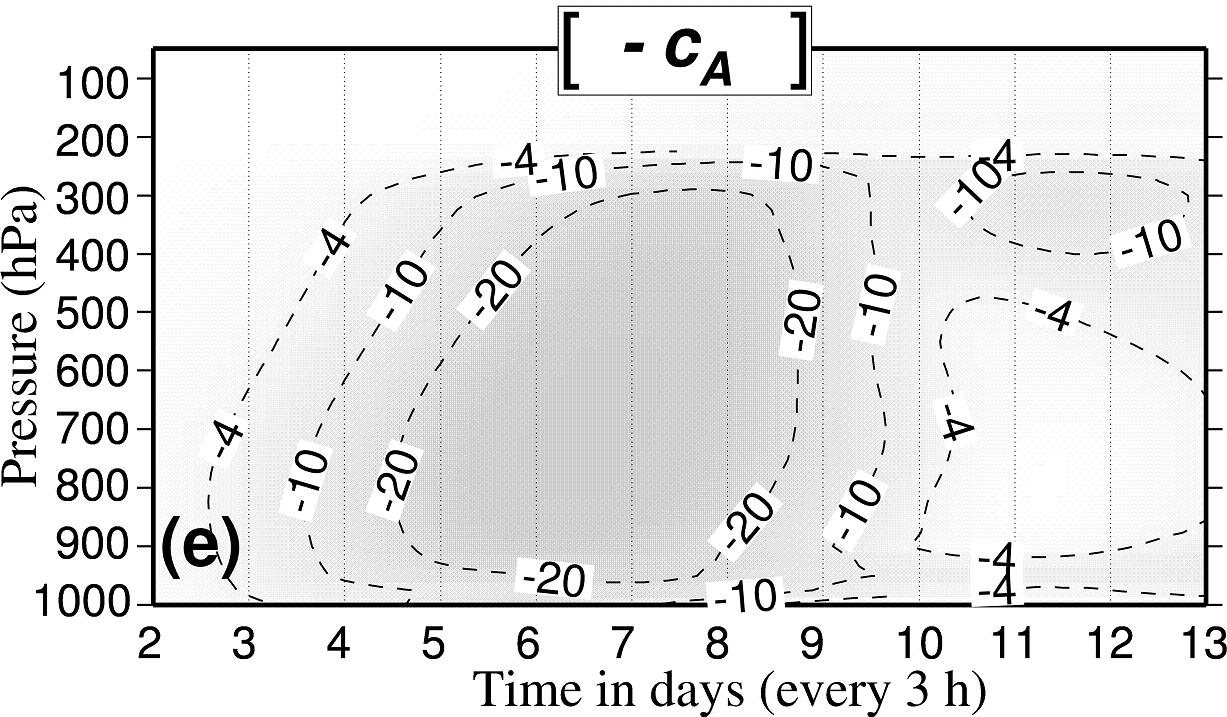
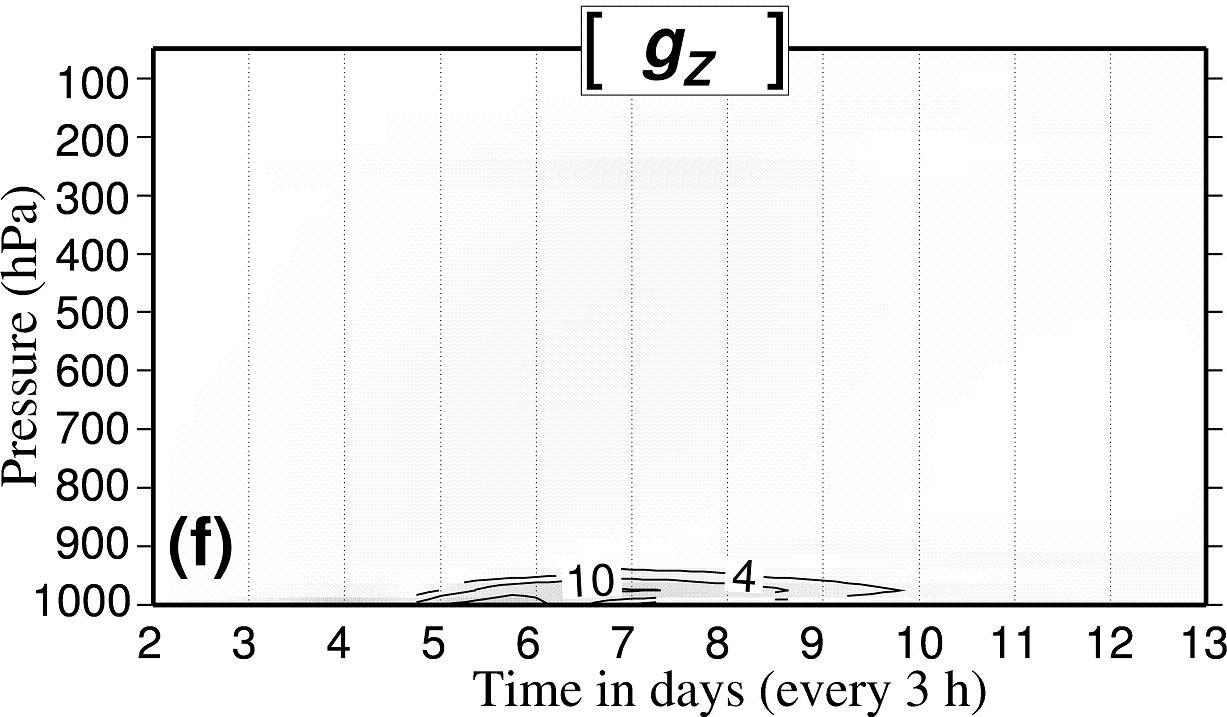
The same method used for is applied to in order to define and give explanations to a non-barotropic part for . The dissipation , the conversion with the potential energy and conversions terms and are added altogether to form the non-barotropic term depicted in Fig. 9 (d). The conversion (not shown) is very small in comparison with other terms. Large negatives values observed in Fig. 9 (d) for the jet are due to (not shown). They correspond to positive values of for the jet, and the balance between these opposite terms explains why the growth in barotropic conversion is inhibited before day from to hPa. In the boundary layer, the non-barotropic term explains entirely the growth in , due to a balance between large negative values for and large positive values for (not shown). These large opposite terms close to the surface can logically be explained by use of an idealized Ekman spiral, in a way similar to what has been done for in terms of a balance between the zonal component of dissipation and the energetic impact of ageostrophic circulations in zonal average.
4.9 Local results for (diabatic simulation).
Figure 10 (a) shows the zonal available enthalpy component where initial values at day are large in the troposphere (more than J kg, with maximum values greater than J kg-1 below the jet (from to hPa) corresponding to strong north/south gradients of and to large values for in Fig. 1 (a).
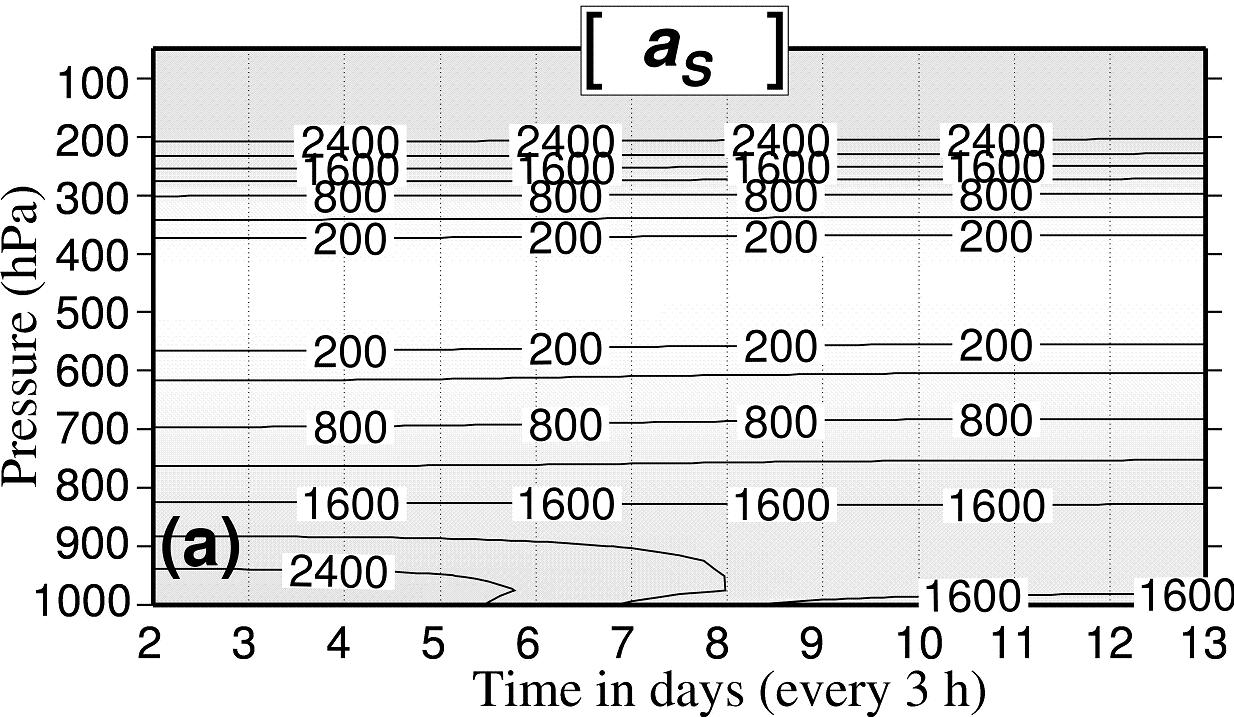
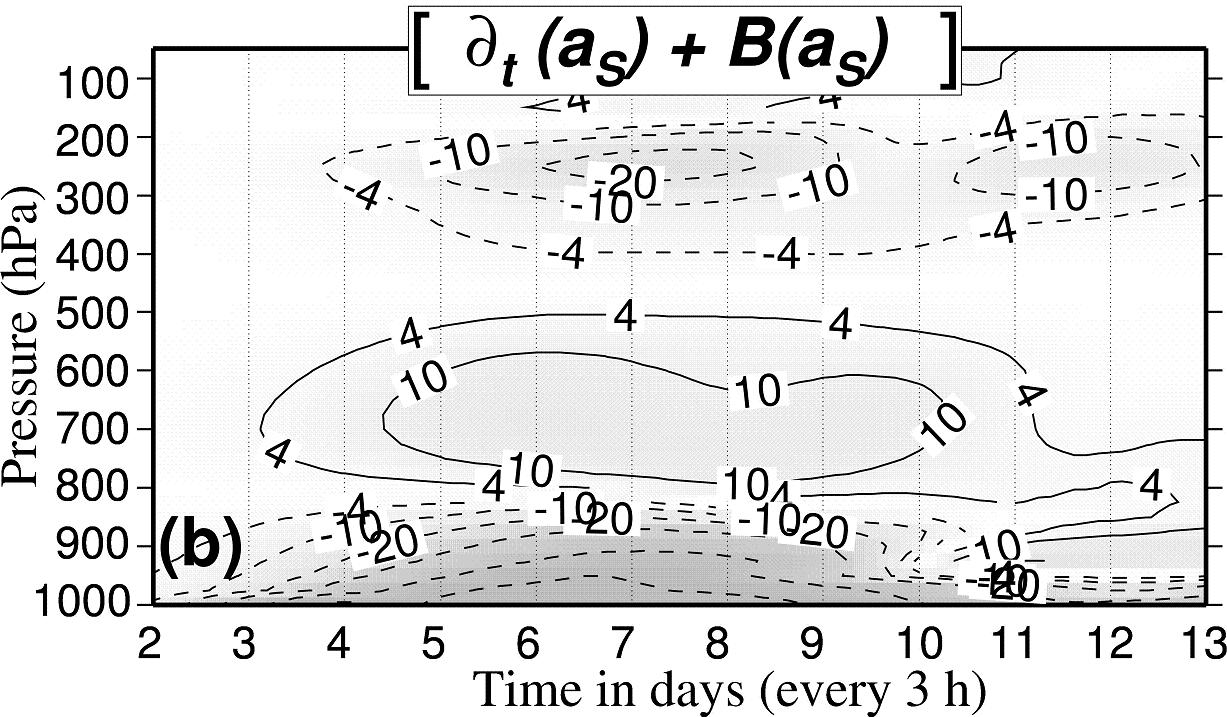
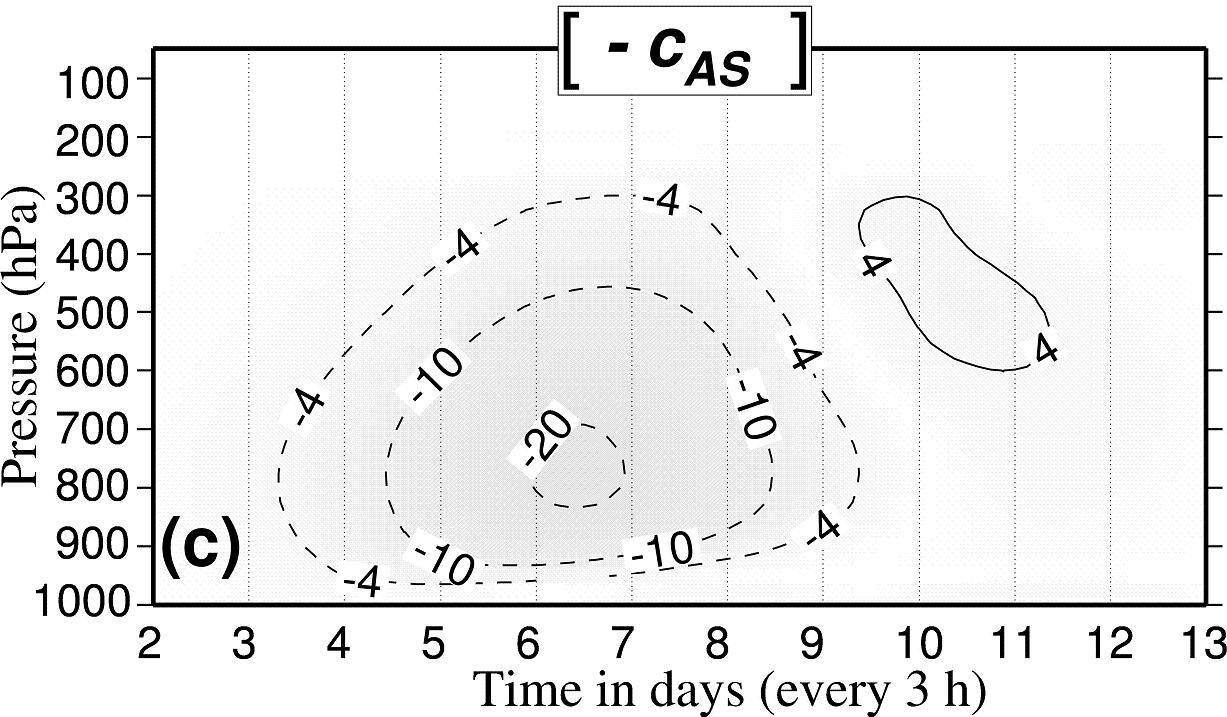
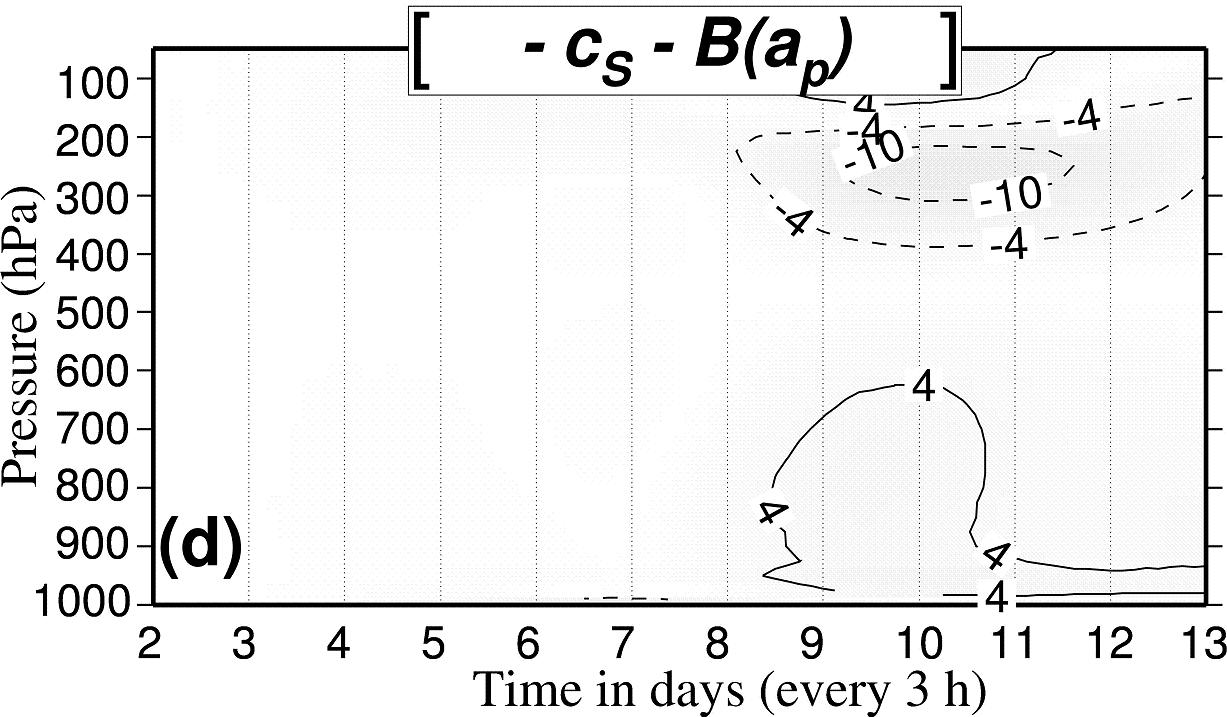
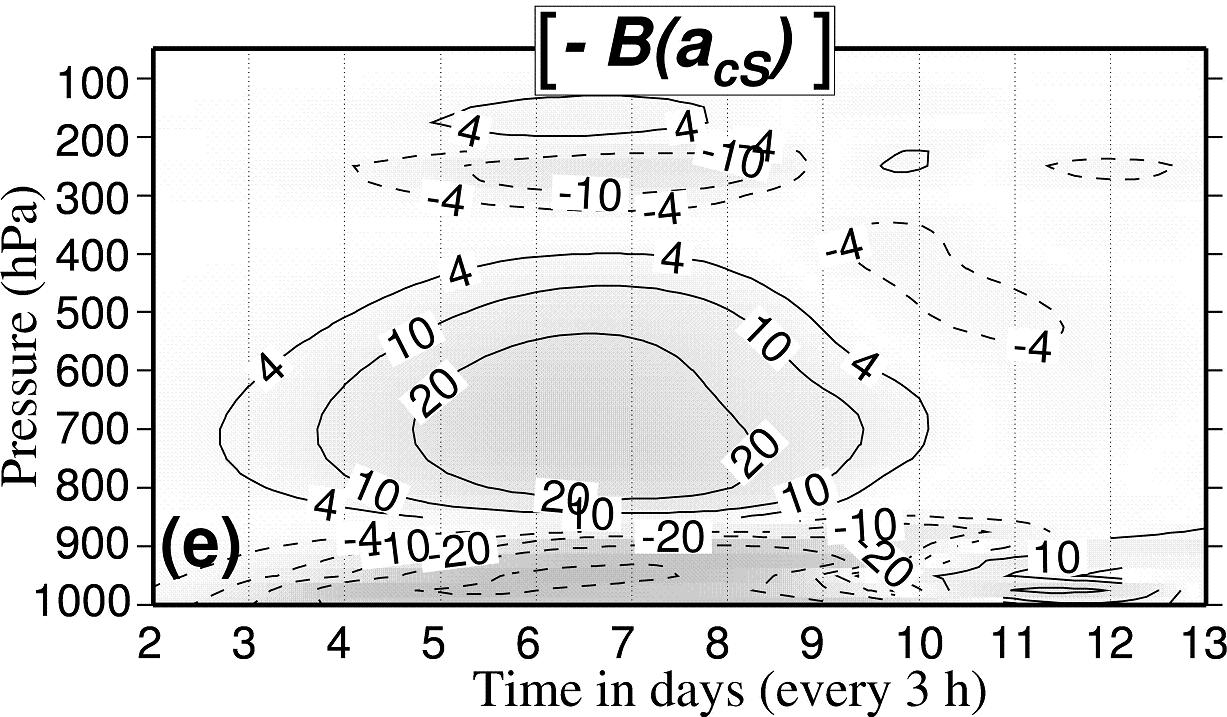
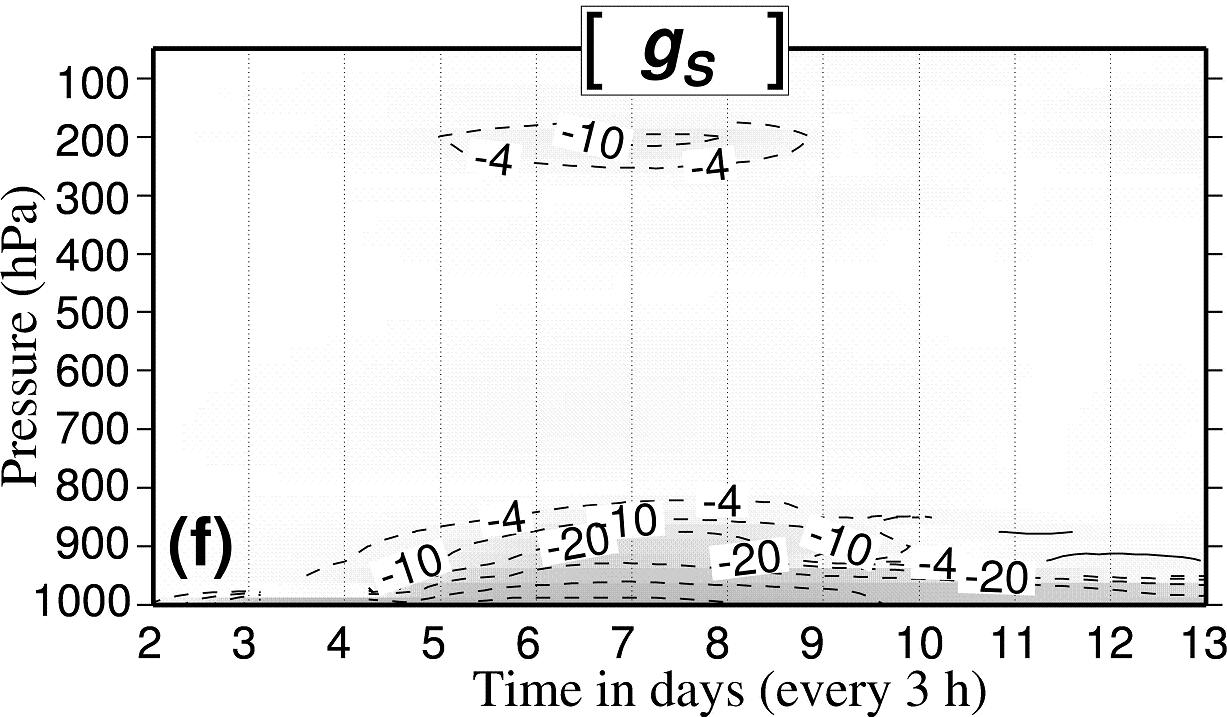
The total change in is depicted in Fig. 10 (b), including the boundary fluxes of and (they cannot be neglected in the boundary layer, not shown). The total change in Fig. 10 (b) is negative in the growing stage of the unstable mode from days to , with a maximum depletion at day in the lower troposphere (from to hPa). The total change is zero at the top of the boundary layer ( hPa). There is a positive event at hPa between days and (more clearly shown with a zoom over this region, not shown here). It is created by a positive part of the generation in Fig. 10 (f) where values up to W kg-1 are observed from days to and between and hPa.
Associated with negative tendencies in Fig. 10 (b) are minimum values for in Fig. 10 (a) after day , with values less than J kg-1 from to hPa. The behaviour of close to the surface is more complex. Values are as low as J kg-1 at hPa and after day , with a region of moderate values (more than J kg-1) observed just at the top of the boundary layer (between and hPa, best shown with a zoom over this region, not shown here).
It is explained in section 4.2 how global increases in and are obtained at the expense of global components or . However, there is no one-to-one local connection between or with or . The patterns are clearly out of phase because maxima are located at the surface and near the jet for kinematic components, whereas maxima occur in the middle troposphere for the temperature components.
The decrease in can be explained by the balance between the positive conversion and the negative convection in Figs. 10 (c) and (e). The positive conversion exports energy from to but it does not correspond to change in . In fact, it is connected to associated negative values for . For the jet and the middle troposphere, and act as direct transfers of energy from to .
4.10 Local results for (diabatic simulation).
The static stability component in Fig. 11 (a) is maximum in the lower troposphere and in the stratosphere, with minimum values near the hPa level. These observations are in agreement with local values of and with K.
The equation for is equivalent in Fig. 11 to (b)(c)(d)(e)(f). The development of the mode is mainly associated in Fig. 11 (a) with a decrease of below the level hPa. It corresponds in Fig. 11 (b) to large negative values for the total change in , including the boundary fluxes. Associated with them, large negative values for the generation in Fig. 11 (f) are the main cause for the loss of energy in the system, with observed decreasing gradients of temperature below the hPa level.
Clearly, possible one to one local conversions between and or , suggested in section 4.2 from global results, cannot be established.
Values for the budget are small in Fig. 11 (d). It is a confirmation that the external path does not contribute greatly to the energetics of the available-enthalpy cycle. As mentioned in the previous section, the conversion in Fig. 11 (c) can explain the growth in , although it cannot describe the pattern of the total change in Fig. 11 (a). It means that the other boundary flux is an important feature for , acting as vertical redistributions of energy with large positive and negative values but with small global integral (not shown).
5 A new available enthalpy cycle.
Investigations of the energetics of the diabatic simulation have shown that observed large and positive values for dissipation in the boundary layer correspond to large and opposite values for the three potential energy conversion terms , and . An attempt will be presented in this section to modify (36) and Fig. 5 (b) of Part I in order to take into account these balanced terms which are interpreted, according to OS95 and section 4.6, as vertical redistributions of energy via work done by pressure forces and by ageostrophic circulations.
Ageostrophic conversions are denoted by , for subscripts . They are written
| (8) | |||||
| (9) | |||||
| (10) |
The results obtained in sections 4.3, 4.4 and 4.8 show that local changes in kinetic-energy components are out of phase with baroclinic conversions, whereas they are in one-to-one relationships with ageostrophic conversions. It is thus necessary to reorganize (36) and Fig. 5 (b) of Part I so that the barotropic conversions , and do not directly supply energy to , and . Discussions presented in Johnson and Downey (1982) are suitable to solve this problem. They suggest maintaining an explicit degree of freedom for boundary work and to avoid concept of direct conversion between mechanical and thermodynamic energies. This program will be partly retained, leading to modifications in the Lorenz internal cycle (encompassing a hatched area in Fig. 5 (b) of Part I).
The proposal for the new limited-area available-enthalpy cycle is represented by (11) and Fig. 12.
| (11) |
Ageostrophic conversions for subscripts appear in the three kinetic-energy equations in (11). They also appear in the equation for which is partitioned into the three incoming terms and the three outgoing terms , plus the term added to the two sides of the equation. These transformations between baroclinic and ageostrophic components are equivalent to the vertical redistribution of energy described in OS95.
However, the question as to how values are transformed into values will not be tackled in this paper, owing to a lack of possible separation of into zonal, eddy and static-stability components. Indeed, is not a quadratic function and the local separation disappears for averaged values, because and . In fact, this question is equivalent to the other difficulty in understanding the real physical meanings for in Eqs.(36) of Part I.
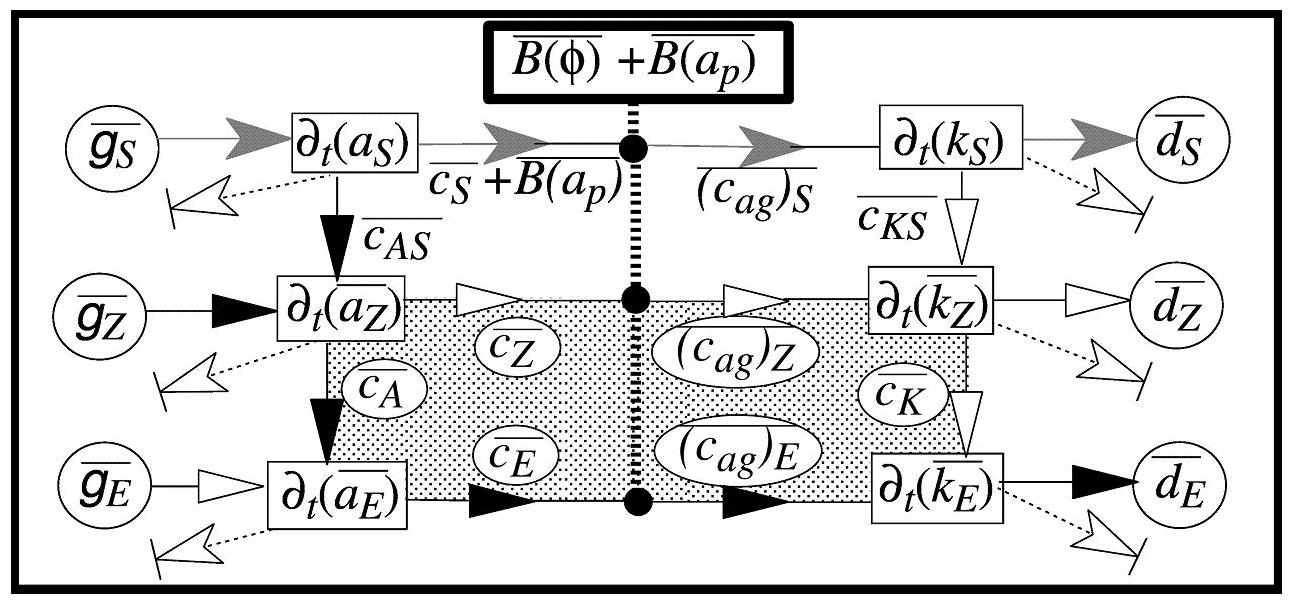
Graphically, Fig. 12 is obtained from Fig. 5 (b) of Part I by folding back arrows to arrows on the right part of the inner Lorenz cycle. The left part of the Lorenz cycle is unchanged and still involves the usual baroclinic conversions. The vertical separation between the two parts corresponds to the equation for , depicted by vertical heavy dotted lines and dark branching points. The external path of energy is also modified. The boundary term is added to in order to avoid large terms in the budget of .
As suggested by Johnson and Downey (1982), connections between potential-energy components and others components do not occur through direct conversions toward kinetic-energy components. Energy coming from rather enters in the middle of horizontal branches of the internal Lorenz cycle in Fig. 12 (dark points). Transformations leading to (11) are obtained without loss of generality and a gain in simplicity is observed, since there are fewer terms to manage in the kinematic part.
6 An application to the IOP15 of FASTEX.
6.1 Time–Pressure diagrams for IOP15.
It is not the aim of this section to show a complete study of the energetics of IOP15 during the FASTEX experiment (Joly et al., 1997). Only preliminary results will be presented, in order to assess the realistic aspect of the idealized diabatic simulation EXP-HV. Both FASTEX and EXP-HV cases will be investigated with the local available-enthalpy diagnostic package, though with a different limited-area domain.
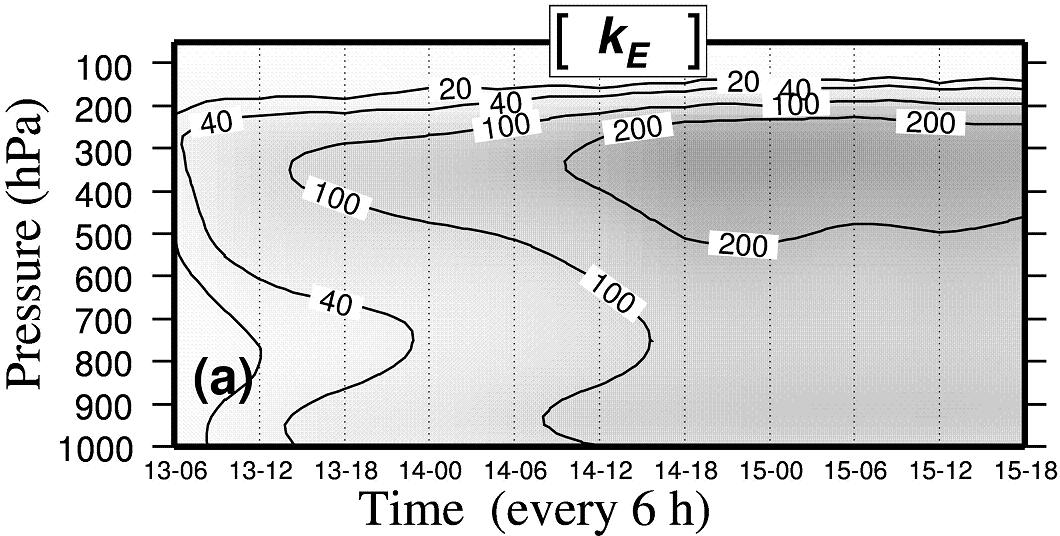
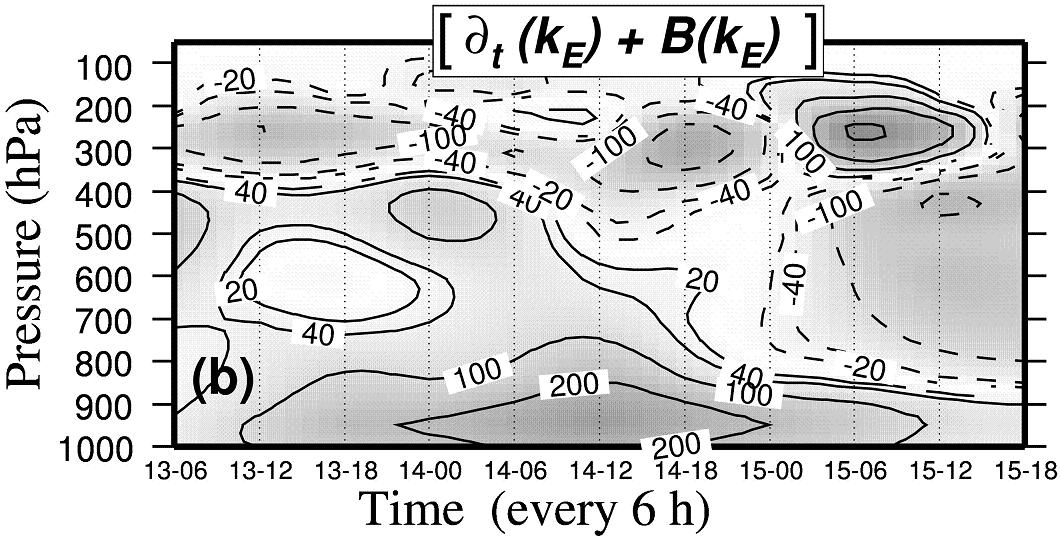
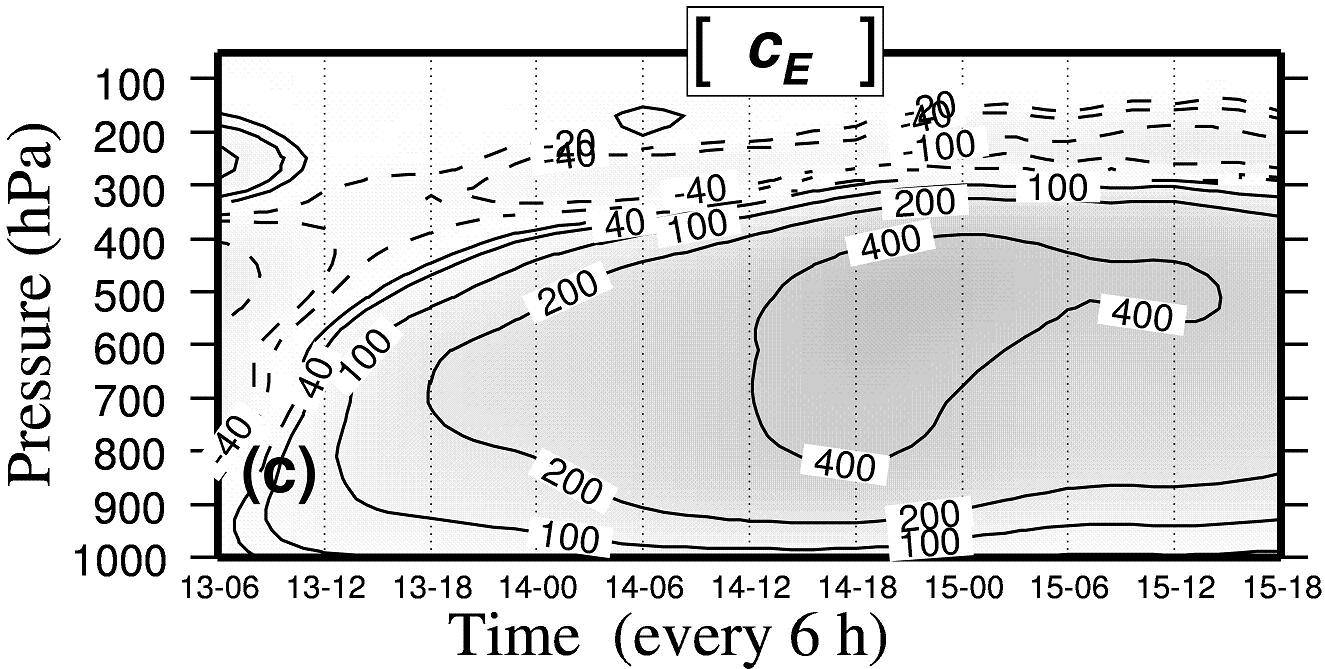
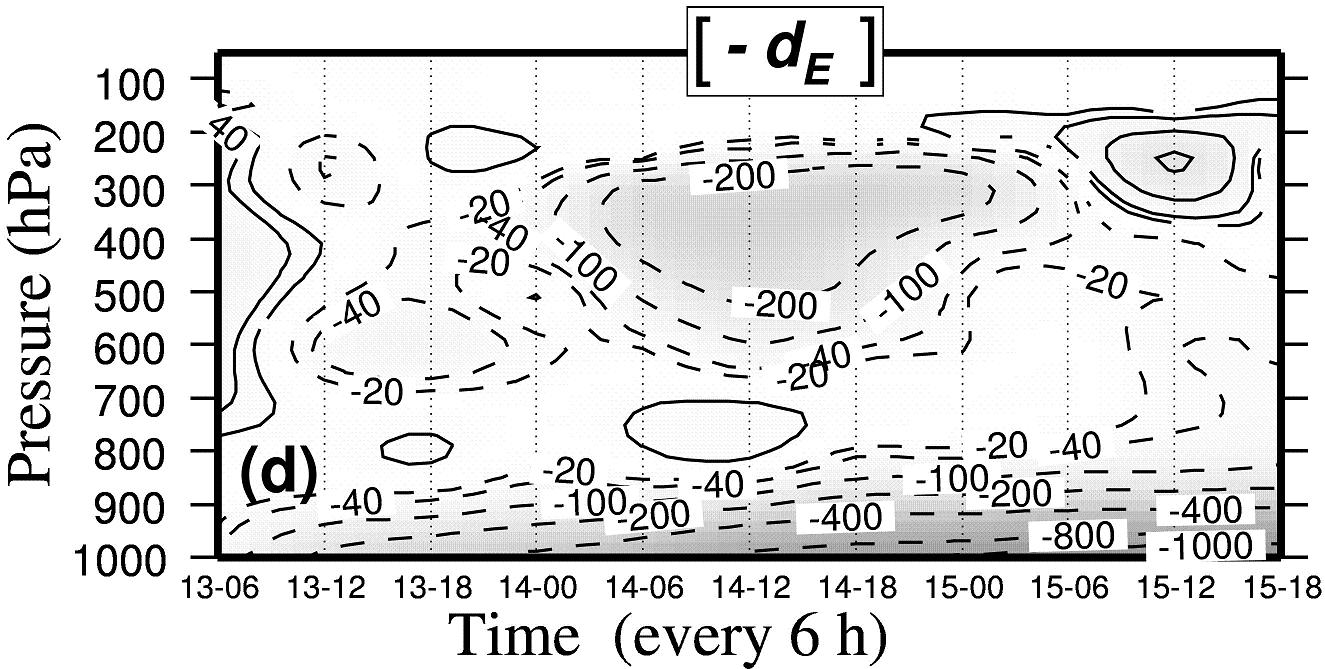
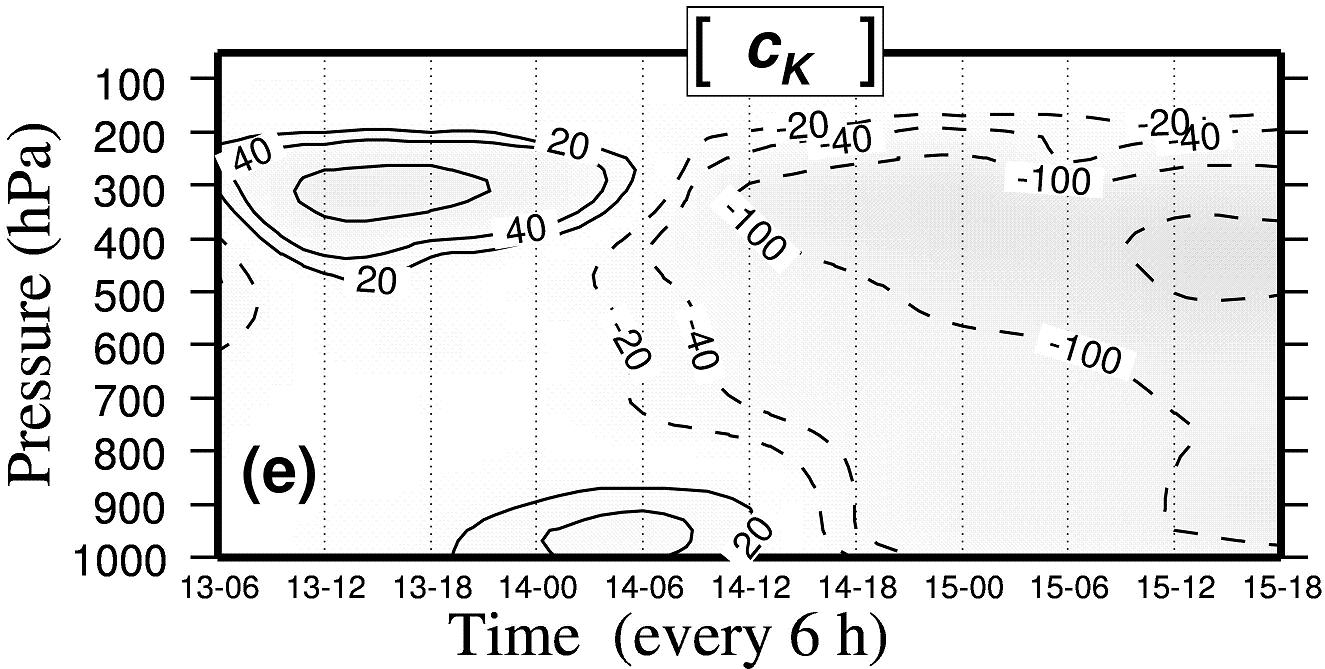
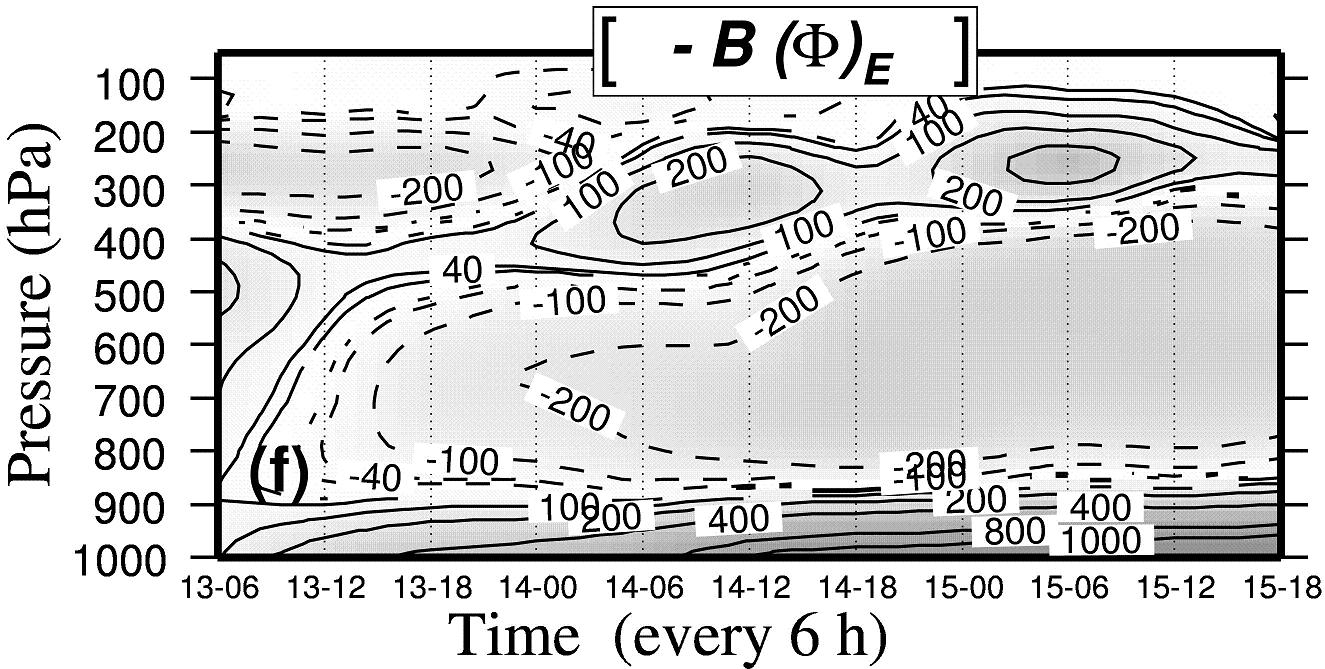
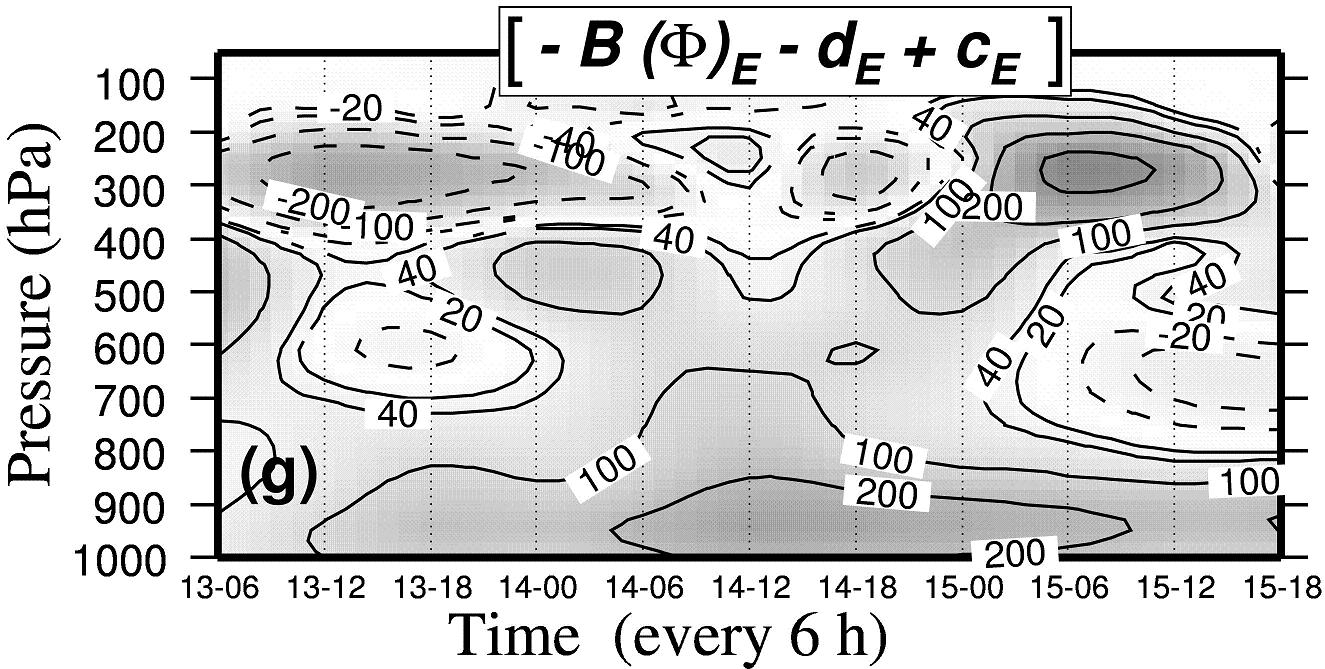
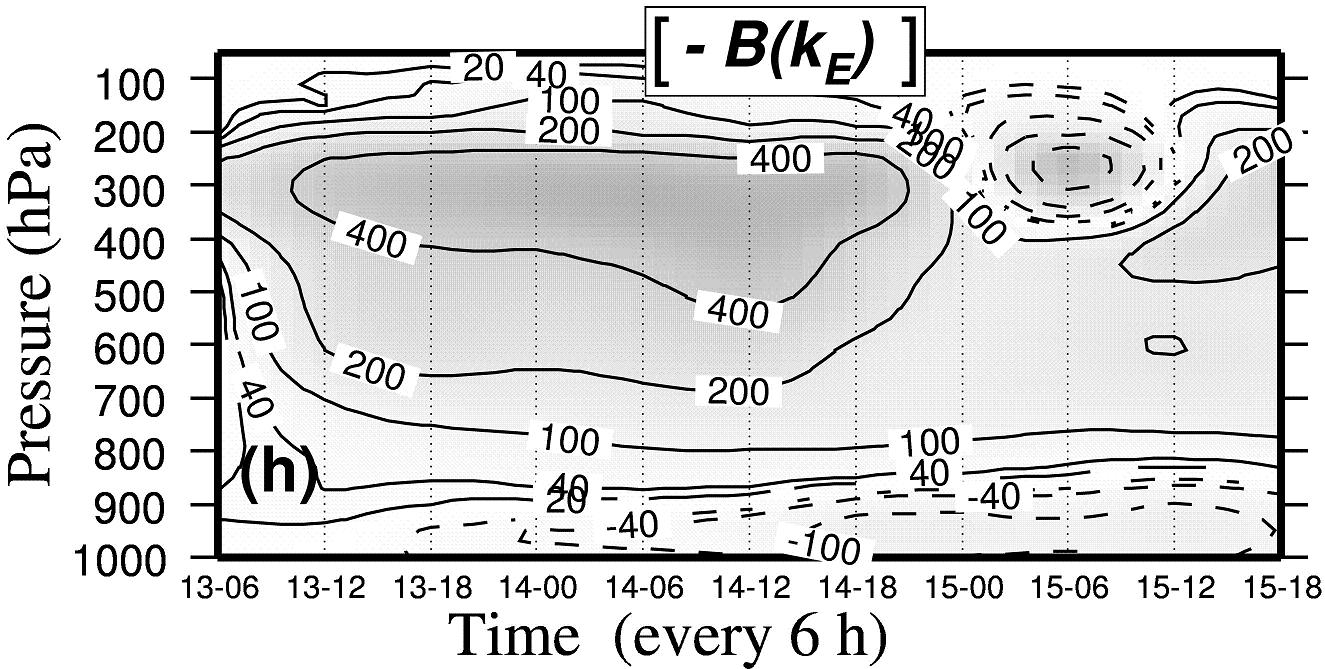
A three-day forecast has been simulated with an old operational version of the French Arpege model (triangular truncation T, stretching factor of , hybrid vertical levels). The operational suite of analyses had used some non-conventional observations and the quality of the forecast was good. The modified time scheme (4) has been used with moving limited-area diagnostic domains following the storm along its trajectory. This method is close to the quasi-Lagragian method described in Michaelides et al., 1999. However, in this paper, the scheme (4) is evaluated at a given diagnostic time with the same limited-area for , and . And when passing from to , the size and location of the common diagnostic domains change at the same time for the new , and diagnostic times in the scheme (4).
Comparisons of diagrams between Figs. (13) (a) and (5) (a) show that the idealized diabatic experiment EXP-HV can reproduce some of energetic features observed in IOP15 of FASTEX. In the two cases, the eddy component is a maximum close to the jet and in the boundary layer at a level above the surface. The main differences concern the values of which are enlarged, going from - units for EXP-HV to - units for FASTEX. Another difference is that the maximum close to the surface occurs h later than for the jet in the FASTEX experiment. The contrary is observed in EXP-HV.
Patterns of total budget in Figs. (13) (b) and close to the surface are similar, with a maximum of development of on h and at level hPa for FASTEX. However, total budgets close to the jet are very different. The explanation is given by Fig. (13) (h) where the boundary flux is equivalent and opposite to the local tendency, leading to weak values of the sum depicted on Fig. (13) (b). As a consequence, advection processes seem to control energetics of the jet in FASTEX, whereas local developments appear to be the prevailing sources of in the boundary layer. Such advection processes for the jet could not appear in EXP-HV because of the eight waves surround the earth. Even for a small limited area, the incoming and outgoing energy is equal for EXP-HV.
Patterns for the baroclinic and barotropic conversions, the dissipation term and the conversion term with potential energy are to a large extent similar for idealized EXP-HV and for the real FASTEX experiments (see the Figs. (13) (c)–(f)). In particular, the dissipation is generally weak above the boundary layer, though with surprising negative large values close to hPa and centred on day at h.
The non-barotropic term in Fig. (13) (g) can be compared with 6 (b). As for the total budget in Fig. (13) (b), there are large differences for the jet region of FASTEX, where increase in is mainly due to advection processes. For FASTEX as for EXP-HV, the ageostrophic conversion, equivalent to (g)–(d) in Fig. (13), seems to be the relevant term (not shown) to explain the forcing coming from , in place of the usual baroclinic conversion .
6.2 The available-enthalpy cycles for IOP15.
The available-enthalpy cycles presented in Fig. 14 correspond to the storm investigated during the IOP15 of FASTEX and already described in the previous section (see Fig. 13). The cycles are computed for three vertical layers (upper, middle and lower troposphere) and for the two growing and decaying stages of development of the storm. The vertical integral of any term is equal to the sum of , where is the acceleration due to gravity. Units are W m-2. The contributions to the global budget of upper, middle and lower pressure layers are equal to , and %, respectively, according to the differences in pressure for the layers.
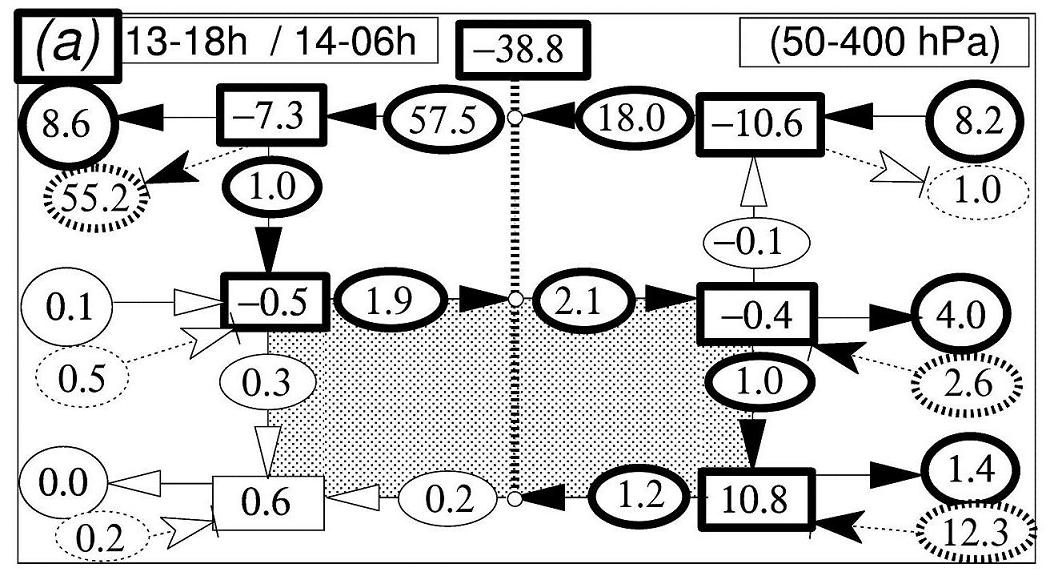
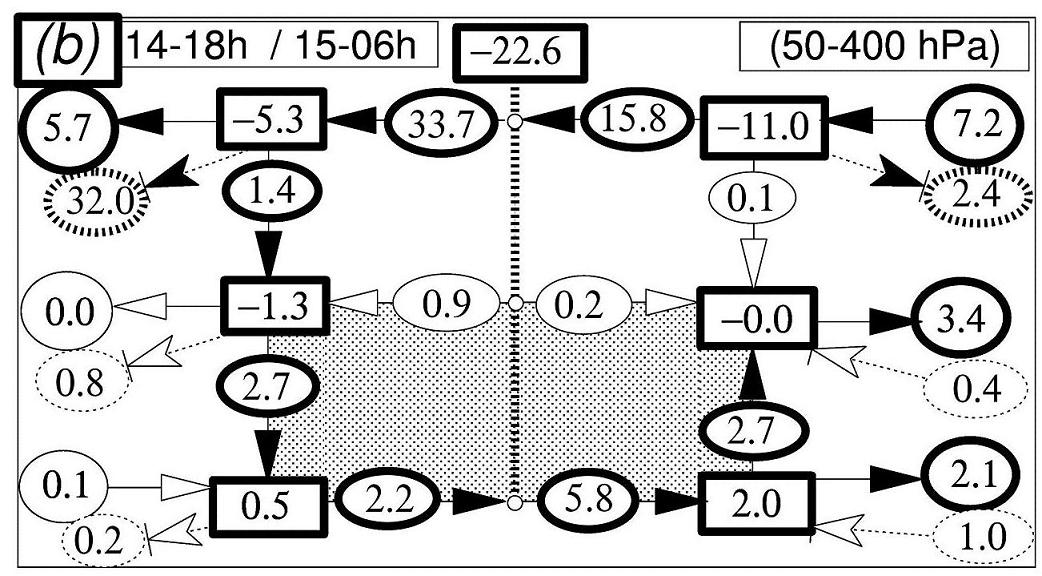
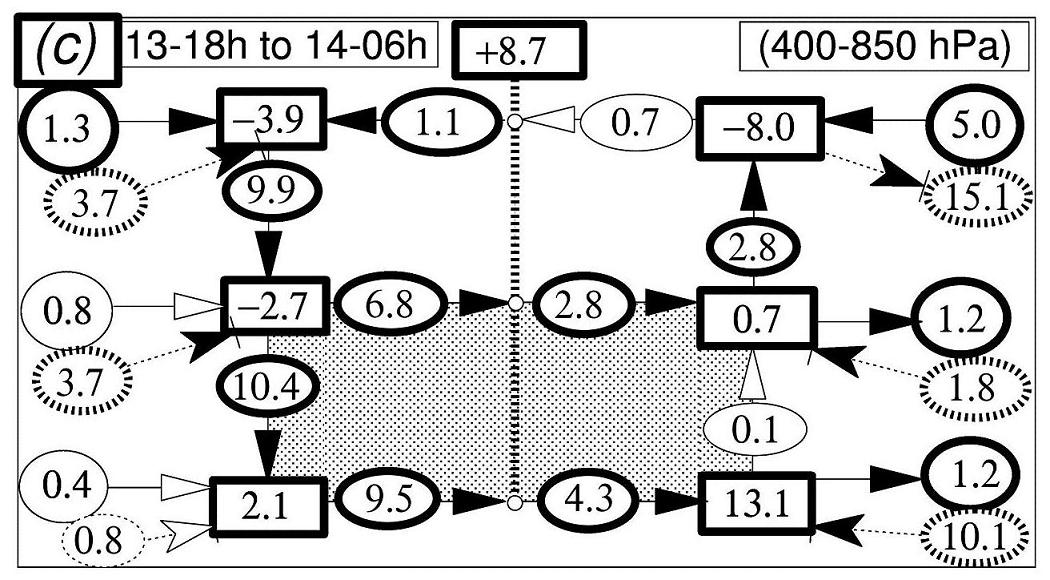
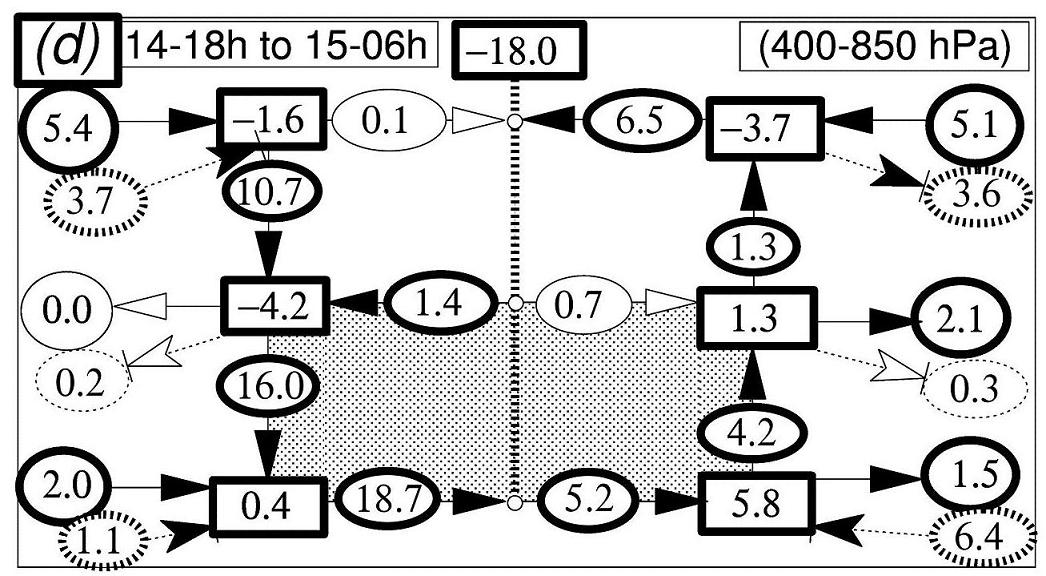
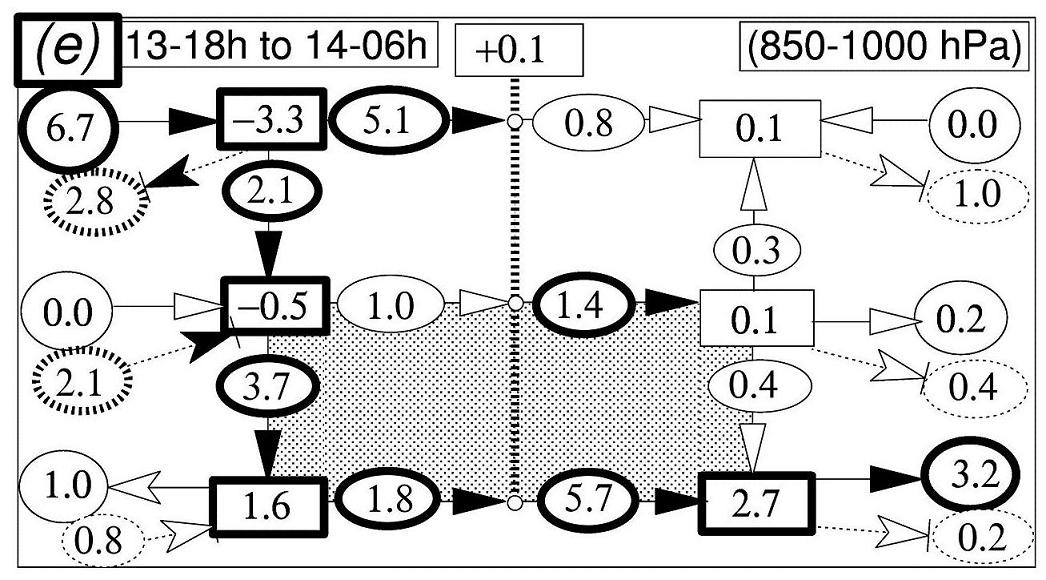
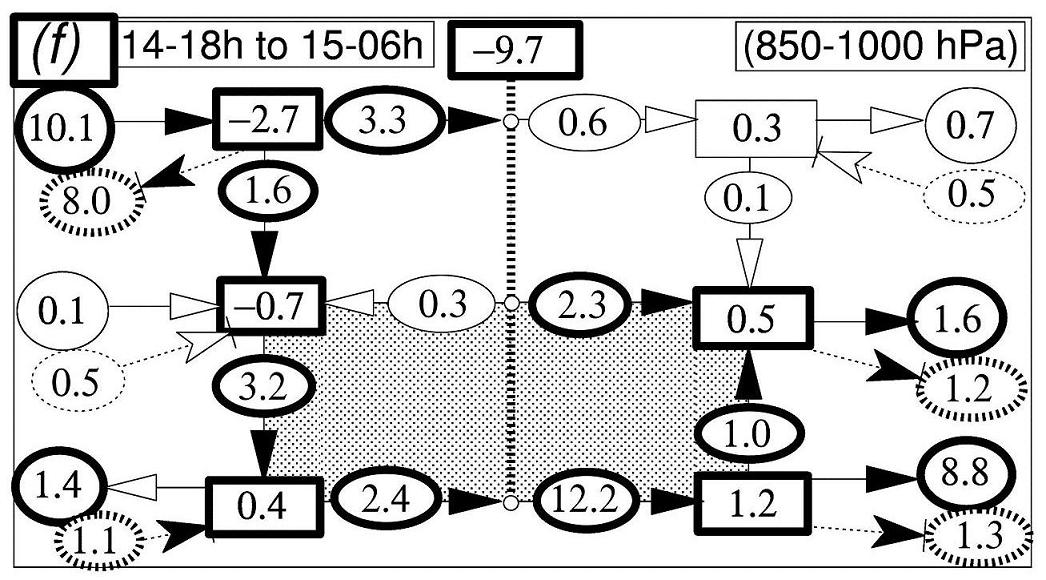
The main objective of this section is to determine how far the ageostrophic conversions acting on can differ from the baroclinic conversions acting on , for the subscripts = (, , ). Clearly, Figs. 14 (a)–(e) show that the differences between the two kinds of conversion terms can be large, for all layers and for the two stages of the storm.
An important example is the low-level growing stage cycle shows in Fig. 14 (e). It corresponds to an ageostrophic conversion of units and to a baroclinic conversion of only units. The difference of units for (, ) represents the eddy contribution for , with the contributions of units for (, ) and units for (, ), leading to the observed small total change of units.
This low-level growing-stage cycle corresponds to typical features of baroclinic developments for midlatitude storms. The generation term and the conversion term are associated with a release of reaching units, with the sequence of positive conversion terms , , and units. The budget of is closed by a barotropic instability , with a growing of units for and a realistic dissipation term units.
The main difference between the low-level growing stage in Fig. 14 (e) and the mature or decaying stage in Fig. 14 (f) is the expected change of sign for the barotropic conversion (). This barotropic stabilization corresponds to a growth of ( units). The dissipation terms increase for the mature stage, reaching units for and units for . The large values for the eddy dissipation balance the large ageostrophic conversion ( units), giving an explanation to the observed moderate growth of (only units).
The total budget for is small ( units) only for the low-level growing stage in Fig. 14 (e). Larger values from to units are observed for all other cases(Figs. 14 (a) to (d), and (f)). It means that the budget of potential energy plays an important role in the available-enthalpy cycle by supplying (extracting) energy to (from) other forms of energy. There is a need to elucidate the uncertain involved processes.
The conversion terms and have opposite signs for the three decaying stage cases (Figs. 14 (b), (d) and (f)), whereas they have the same signs for the three growing-stage cases (Figs. 14 (a), (c) and (e)). Other comparisons between the eddy ageostrophic and baroclinic conversions show that is the governing term for the upper-level and for the lower-level cases (Figs. 14 (a), (b), (e) and (f)). The governing term is for the mid-troposphere cases (Figs. 14 (c) and (d)).
These comparisons can be understood by analysing the vertical and time distributions for and , as depicted in Fig. 13 (c) and (f), respectively. According to (10), the ageostrophic conversion is the sum of the two terms: . For the mid-tropospheric region they have opposite sign, leading to the observed small values of . For the low-level troposphere, the two terms are positive, leading to the large positive values for . For the upper-levels region the sign of is somewhat irregular close to the jet. The observed increase of is less easy to explain.
7 Conclusions.
The aim of this paper was to investigate the local energetics of idealized simulations of adiabatic and diabatic versions of baroclinic waves. The final diagnostic tool is the fully symmetric limited area available enthalpy cycle with components, defined by (11) and Fig. 12.
As stated in McIntyre (1980) and Plumb (1983), the transformed Eulerian-mean systems or the generalized Eliassen-Palm fluxes can lead to better ways of analysing wave and mean-flow interactions.
Furthermore, the partition of Lorenz into zonal mean and eddy components of the flow could be improved in many ways, for instance by following variational processes as suggested by Van Mieghem (1956), Plumb (1983) and Kucharski (1997). An example of the use of a flow-dependent reference state is given in Kucharski and Thorpe (2000a), where rotated zonal means are defined. But in this two-part paper, the conventional partition of Lorenz has been considered and the same choice has been made in the most recent papers of Michaelides et al. (1999), Kucharski and Thorpe (2000b, 2001) or Mishra and Rao (2001).
As for the non-uniqueness of energy cycles widely discussed in Johnson and Downey (1982) and in Plumb (1983), the definition of the limited-area available enthalpy cycle (11) suffers from the same general problem of uncertainty in the interpretations of conversion terms. It is, for instance, always possible from a mathematical point of view to cancel out any branch of a cycle, by adding a common term to each part of a closed loop. The simplest example is a triad of energy components (, , ) with the conversions , and acting between them. If the quantity is added to the three branches, the modified cycle is still valid and both the energy and net tendencies are the same before and after the modification. The impact on the diagram for the triad-cycle would be of a cancellation of the direct conversion between and , the other conversions becoming and .
It is thus important to verify that the physical interpretations of the modified conversion and flux terms are still valid in the available-enthalpy cycle (11), as stated in McIntyre (1980), Johnson and Downey (1982), and Plumb (1983).
Firstly, it has been verified that there are no approximations and no missing terms, by showing that observed dissipation and generation residuals are small in case of adiabatic simulations in both global and local cases. Furthermore, there is a real gain in physical basis in the definition of the new available enthalpy cycle. In (11) and Fig. 12, Lorenz’s internal cycle has been modified in order to highlight the ageostrophic conversion . It acts as a forcing directly applied to the kinetic-energy components, in place of the usual baroclinic conversion .
The potential-energy component plays the role of vertical redistribution of energy as described in OS95, by transforming baroclinic into ageostrophic conversions, via unknown processes to be discovered. The use of ageostrophic conversion terms in the available-enthalpy cycle is the main modification brought to the study of Pearce (1978). It appears to be in agreement with the results obtained with the numerical simulation of the IOP15 of FASTEX, as presented in section 6.2. The magnitudes of the baroclinic and ageostrophic conversions are indeed very different. Even their sign can change. When the potential-energy component is included, the values of the generation and dissipation terms computed as residuals of the cycle (11) turn out to be realistic.
Other comparisons of results from the idealized case EXP-HV and from the IOP15 real case of FASTEX show that surface patterns are almost the same, although the jet energetics are very different. It could be worthwhile to continue this study on IOP15 of FASTEX, with special attention paid to the impact of surface energy fluxes on the atmospheric boundary-layer front, as already stated in Giordani and Planton (2000).
The limited area available enthalpy cycle (11) must be particularly suitable for studying the energetics of isolated structures like frontal waves, for which FASTEX has been organized. To do so, the potential-vorticity inversion mechanism could be used to make simulations including and not including some localized small patterns, in order to understand their dynamical consequences.
Other idealized cases could be investigated in the future, with possible enhanced horizontal or vertical resolutions. It could also be worthwhile to define more realistic simulations, by including humidity and other diabatic processes. Results from Marquet (1993) could serve as a starting point for defining a moist local available-enthalpy cycle.
Acknowledgements.
The author is most grateful to S. Malardel, Ph. Arbogast and C. Freydier for their support and useful discussions about applications of available-enthalpy energetics to idealized simulations and for the preparation of the basic state with the most unstable mode. I also thank R. Clark and the two referees who suggested many clarifications and modifications to the manuscript.
Appendix A. Computations of the pseudo-geostrophic wind.
The stationary jet depicted in Fig. 1 (a) is defined by the pseudo-geostrophic wind (). It is obtained from (29) of Part I, together with the hypotheses that all the zonal and meridian tendencies are zero and that all the variables () are zonally symmetric, with a constant surface pressure and without friction. The result is given by (A.1) .
| (A.1) |
If the usual geostrophic wind is denoted by , the pseudo-geostrophic version is obtained by solving an equation of the second degree, derived by inserting , into (A.1), to give
| (A.2) |
The term is the velocity due to the rotation of the earth with m s-1. The limit of (A.2) for small values of and with for small is the usual geostrophic wind . This approximation is valid in the tropical region where and m s-1. But decreases with increasing latitude where , leading to possible large differences between and . A significant departure from classic geostrophic conditions (up to m s-1) is also obtained for the mid-latitude jet. The obvious singularities for and in (A.2) have no practical impact for a Gaussian grid where there is no point located at the poles or at the exact equator.
There is a need to take into account the formulation (A.2) to avoid significant time oscillations of the jet due to imbalanced wind, as clearly observed for some spectral coefficients in a first attempt to construct the zonal jet. The method of computing “” is also important. The method used in Arpege is a spectral computation of the gradient of temperature for “”, with a transformation onto the Gaussian grid. The meridian component “” is finally obtained by computing the vertical integral of the hydrostatic equation and by a division by “” on the Gaussian grid.
References.
Brennan, F. E. and Vincent, D. G. 1980. Zonal and eddy components of the synoptic-scale energy budget during intensification of hurricane Carmen (1974). Mon. Weather Rev. 108, p.954–965.
Courtier, J. A., Freydier, C., Geleyn, J.F., Rabier, F. and Rochas, M. 1991. The Arpège project at Météo-France. ECMWF Seminar Proceedings., Reading, 9-13 Sept. 1991, Volume II, p.193–231.
Giordani, H., Planton, S. 2000. Modeling and analysis of ageostrophic circulation over the Acores oceanic front during the Semaphore experiment. Mon. Weather Rev., 128, p.2270–2287.
Hoskins, B.J. and Simmons, A.J. 1975. A multi-layer spectral model and the semi-implicit method. Q. J. R. Meteorol. Soc., 101, p.637–655.
Johnson, R.J. and Downey, W.K. 1982. On the energetics of open systems. Tellus, 34, (2), p.458–470.
Joly A., Jorgensen D., Shapiro M. A., Thorpe A., Bessemoulin P., Browning K. A., Cammas J.-P., Chalon J.-P., Clough S. A., Emmanuel K. A., Eymard L., Gall R., Hildebrand P. H., Langland R. H., Lemaitre H., Lynch P., Moore J. A., Persson P. Ola G., Snyder C. and Wakimoto R. M. 1997. The Fronts and Atlantic Storm-Track Experiment (FASTEX): scientific objectives and experimental design. Bull. Amer. Meteorol. Soc., 78, (9), p.1917–1940.
Kucharski, F. 1997. On the concept of exergy and available potential energy. Q. J. R. Meteorol. Soc. 123, p.2141–2156.
Kucharski, F. and Thorpe, A., J. 2000a. Upper-level barotropic growth as a precursor to cyclogenesis during FASTEX. Q. J. R. Meteorol. Soc., 126, p.3219–3232.
Kucharski, F. and Thorpe, A., J. 2000b. Local energetics of an idealized baroclinic wave using extended exergy. J. Atmos. Sci., 57, p.3272–3284.
Kucharski, F. and Thorpe, A., J. 2001. The influence of transient upper-level barotropic growth on the development of baroclinic waves. Q. J. R. Meteorol. Soc., 127, p.835–844.
Lorenz, E. N. 1955. Available potential energy and the maintenance of the general circulation. Tellus. 7, (2), p.157–167.
Louis, J.F. 1979. A parametric model of the vertical eddy fluxes in the atmosphere. Boundary-Layer Meteorol., 17, p.187–202.
Louis, J.F., Tiedke, M. and Geleyn, J.F. 1981. A short history of the operational PBL parameterization at ECMWF. Pp. 59–79 in Proceedings of ECMWF Workshop on Planetary Boundary Layer Parameterization., 25-27 November 1981, Reading, UK.
McIntyre, M.E. 1980. An introduction to the generalized Lagrangian-mean description of wave, mean-flow interation. Pure Appl. Geophys., 118, p.152–176.
Marquet P. 1991. On the concept of exergy and available enthalpy: application to atmospheric energetics. Q. J. R. Meteorol. Soc. 117: p.449–475. http://arxiv.org/abs/1402.4610. arXiv:1402.4610 [ao-ph]
Marquet P. 1993. Exergy in meteorology: definition and properties of moist available enthalpy. Q. J. R. Meteorol. Soc., 119, p.567–590.
Marquet, P. 1994. Applications du concept d’exergie à l’énergétique de l’atmosphère. Les notions d’enthalpie utilisables sèche et humide . PhD-thesis of the Paul Sabatier University. Toulouse, France.
Marquet, P. 1995. On the concept of pseudo-energy of T. G. Shepherd. Q. J. R. Meteorol. Soc. 121: p.455–459. http://arxiv.org/abs/1402.5637. arXiv:1402.5637 [ao-ph]
Marquet, P. 2001. The available enthalpy cycle. Applications to idealized baroclinic waves.. Note de centre du CNRM. Number 76. Toulouse, France.
Marquet P. 2003a. The available enthalpy cycle. Part I : Introduction and basic equations. Q. J. R. Meteorol. Soc., 129, (593), p.2445–2466. http://arxiv.org/abs/1403.5671. arXiv:1403.5671 [ao-ph]
Marquet P. 2003b. The available enthalpy cycle. Part II : Applications to idealized baroclinic waves. Q. J. R. Meteorol. Soc., 129, (593), p.2467–2494.
Michaelides, S. C. 1987. Limited area energetics of Genoa cyclogenesis. Mon. Weather Rev. 115, p.13–26.
Michaelides, S. C., Prezerakos, N. G. and Flocas, H., A. 1999. Quasi-Lagrangian energetics of an intense Mediterranean cyclone. Q. J. R. Meteorol. Soc., 125, p.139–168.
Mishra, S., K. and Rao, V., B. 2001. The energetics of an upper tropospheric cyclonic vortex over north-east Brazil. Q. J. R. Meteorol. Soc., 127, p.2329–2351.
Muench, H. S. 1965. On the dynamics of the wintertime stratosphere circulation. J. Atmos. Sci. 22, p.349-360.
Orlanski, I. and Sheldon, J. P. 1995. Stages in the energetics of baroclinic systems. Tellus, 47A, (5), p.605–628.
Pearce, R. P. 1978. On the concept of available potential energy. Q. J. R. Meteorol. Soc. 104, p.737–755.
Plumb, R.A. 1983. A new look at the energy cycle. J. Atmos. Sci., 40, p.1669–1688.
Simmons, A.J. and Hoskins, B.J. 1976. Baroclinic instability on the sphere: normal modes of the primitive and quasi-geostrophic equations. J. Atmos. Sci., 33, p.1454–1477.
Simmons, A.J. and Hoskins, B.J. 1978. The life cycles of some nonlinear baroclinic waves. J. Atmos. Sci., 35, p.414–432.
Thorncroft, C.D. and Hoskins, B.J. 1990. Frontal cyclogenesis. J. Atmos. Sci., 47, p.2317–2335.
Van Mieghem, J. 1956. The energy available in the atmosphere for conversion into kinetic energy. Beitr. Phys. Atmos., 29, p.129–142.