Direct measurement of the temperature dependence of the magnetic penetration depth in Ba(Fe1-xNix)2As2 superconductors
Abstract
The temperature dependence of the in-plane magnetic penetration depth of Ba(Fe1-xNix)2As2 single crystals is determined directly from the shielding magnetic susceptibility, measured in the Meissner region with the field parallel to the layers. The doping levels studied cover the underdoped, optimally-doped and overdoped regimes. At temperatures below a well-defined power-law behavior (with ) is observed. At lower temperatures () the data are still consistent with and , as predicted by the strong pair-breaking scenario proposed by Gordon et al., Phys. Rev. B 81, 180501(R) (2010). The temperature dependence of the superfluid density presents a marked positive curvature just below which is a sign of two-gap superconductivity. The analysis of in terms of a two-gap model allowed to estimate parameters like the in-band and inter-band couplings, the relative weight of each band, and their dependence with the doping level. A comparison with data obtained by using other techniques in compounds with a similar composition is also presented.
pacs:
74.70.Xa,74.25.Ha,74.62.Dh,74.20.Rp1 Introduction
The study of the superconducting gap symmetry in Fe-based superconductors (FeSCs) may provide key information on the pairing interaction in these unconventional superconductors. So, works analyzing the differences in the gap structure among the FeSC families, and probing its evolution with the type and concentration of dopants, are at the forefront of the research in these materials.[1] One of the two fundamental lengths in superconductors, the magnetic penetration depth , is directly related (through its temperature dependence) to the superconducting energy gap, and constitutes an useful tool to obtain information about its symmetry.[2] The absolute value and temperature dependence of has been recently investigated in FeSC by using different experimental techniques, including tunnel diode resonator (TDR),[3, 4, 5, 6, 7, 8, 9, 10, 11, 12, 13, 14, 15, 16, 17, 18, 19, 20, 21, 22, 23, 24, 25] muon-spin rotation (SR),[26, 27, 28, 29, 30, 31, 32] microwave cavity perturbation,[32] two-coil mutual inductance,[33] the lower critical field (),[24, 34, 35] THz conductivity, [36, 37] surface impedance,[38, 39, 40, 41] and local probes as magnetic force microscopy (MFM),[42, 43] scanning SQUID microscopy (SSS),[42, 43, 44, 45] and miniature Hall sensors.[24] Currently there is considerable consensus that the low-temperature behavior of may be described by a power-law
| (1) |
where the exponent value depends on the particular FeSC family and, within the same family, on the type and concentration of the dopants. It is also well established that, in the most studied FeSC families (e.g., 111, 122, 1111), when phosphor is used as pnictide (completely or partially replacing arsenic) is close to 1, which is consistent with a nodal superconducting order parameter.[3, 15, 22, 25, 44] It has been suggested that this occurs when the pnictogen height from the iron plane decreases below Å.[22]
In the case that As is used as pnictide the situation is by far more complex. Exponents ranging from (in NaFe2-xCoxAs2 away from optimal doping,[23] and in clean KFe2As2[17]) to (in LiFeAs,[19] NdFe1-xCoxAsO,[11] and in optimally doped BaFe2-xCoxAs2[37]) were reported. In some samples (e.g., LiFeAs,[22] SmFeAsO1-xFx,[8] BaFe2-xCoxAs2,[43] and PrFeAsO1-x[40]) it has been even found the exponential behavior typical of a fully-gapped superconducting order parameter (which may be parametrized by a power law with ). Such a diversity has been attributed to differences from sample to sample of the pair-breaking scattering, which may change the clean-limit low-temperature behavior (power law with , in the case of an order parameter with vertical line nodes, and exponential in the case that it is fully gapped) to a power law with in the dirty limit.[2, 46, 47] However, to some extent the differences observed in the low temperature behavior of could also be attributed to the different experimental conditions of the techniques used. Some works report the agreement between different techniques when using the same sample: e.g., between SR and microwaves in Ref. [32], and between TDR and scanning SQUID in Ref. [45]. However, large differences observed between TDR and measurements, and the dispersion between TDR measurements have been attributed to the sensitivity of this last technique to the edge roughness of the samples (see Ref. [35] and also Ref. [17]). This issue has recently been subject of discussion, see Ref. [20] and the subsequent Comment and Reply (Ref. [48]). As an example of the differences encountered when using different techniques, in optimally doped Ba(Fe1-xCox)2As2 (one of the most widely studied compounds) follows Eq. (1) with by using TDR[2, 4, 6, 7] and 2-coil mutual inductance,[33] by using mm-wave surface impedance,[41] by using THz spectroscopy,[37] and an exponential behavior is found by using local probes (MFM and SSS).[43] Large differences are also found in the full-range temperature dependence of the superfluid density in the same compound.[2, 16, 28, 32, 33, 43, 41]
Here we present new measurements of the temperature dependence of the in-plane magnetic penetration depth (the one associated to currents flowing in the crystal ab layers),
| (2) |
in a set of high-quality Ba(Fe1-xNix)2As2 single crystals with doping levels covering the underdoped, optimally-doped, and overdoped regimes. These measurements were obtained from the shielding magnetic susceptibility when a low external magnetic field (in the Meissner region) is applied parallel to the crystal ab layers. To our knowledge this technique was not used before in FeSC,111This technique was previously used to determine the in-plane magnetic penetration depth in a high- cuprate superconductor, see Ref. [49]. Some problems arising in the data analysis are commented on in Ref. [50]. but unlike other techniques it allows the use of DC applied magnetic fields in the Oe range, and is very direct (the change in with the temperature is just proportional to the change in the measured magnetic moment). Also, it avoids well known difficulties associated with surface barriers (in the case of techniques based in the determination of )[51] or the above mentioned problems associated with edge roughness (in the case of TDR). The typical size of the crystals used in the experiments lead to a diamagnetic moment in the emu range, still well above the resolution of current SQUID magnetometers (see below). Martin et al.[12, 13] and Rodière et al.[24] already measured the behavior at low-temperatures in Ba(Fe1-xNix)2As2 with different doping levels by using the TDR technique. Both works report a power-law behavior at low temperatures, but find significant differences in the exponent, mainly in the overdoped region. Our measurements were obtained in the range , allowing to investigate the power-law behavior of at low temperatures (), but also the superfluid density at higher temperatures, still unexplored in the studied compound.
The experimental details are presented in Section 2. The low-temperature behavior of is analyzed in Section 3.1. The superfluid density, obtained by using the values in the literature, is analyzed in the full temperature range below in Section 3.2. Finally, the concluding remarks are presented in Section 4.
2 Experimental details and results
The Ba(Fe1-xNix)2As2 crystals were grown by the self-flux method. Their nominal Ni doping levels are (underdoped, ud), 0.05 (optimally doped, op), and 0.075 (overdoped, ov). The details of the growth procedure and a thorough characterization may be found in Ref. [52]. To avoid the complications associated with demagnetizing effects (see below) we used plate-like single crystals (typically mm3, see Table I) with the FeAs () layers parallel to their largest faces. They were cleaved from larger crystals by using adhesive tape. The surface irregularities are of the order of 50 nm in depth (as determined by AFM), and the uncertainty in the crystals thickness m (the length relevant for the analysis) is below 1%.
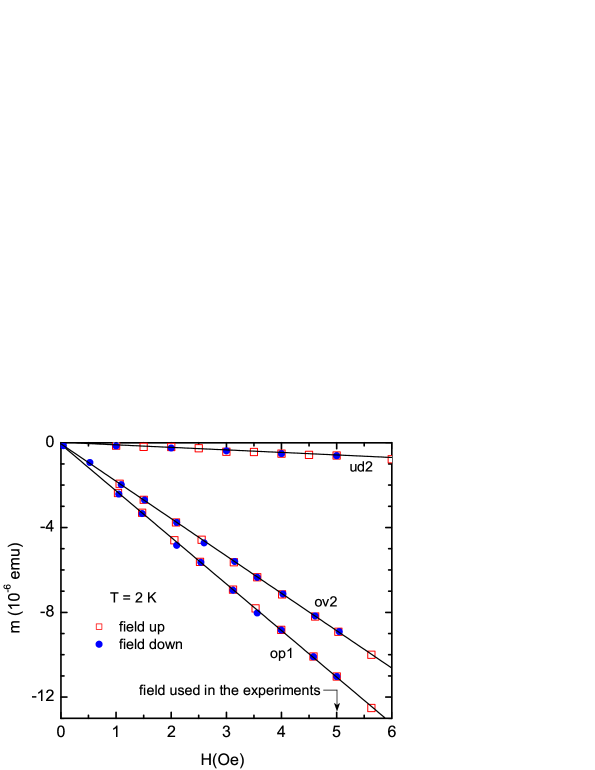
The magnetic susceptibility with , , was measured in several crystals of each composition with a Quantum Design’s SQUID magnetometer (model MPMS-XL). For that we used a quartz sample holder (0.3 cm in diameter, 22 cm in length) to which the crystals were glued with a minute amount of GE varnish. Two plastic rods at the holder ends ( mm smaller than the sample space diameter) ensured an alignment better than . However, the presence of the Ge varnish may introduce an additional uncertainty in the crystal orientation which effect will be commented below. The samples were zero-field cooled (ZFC) by using the ultra-low-field option, which includes a shield for the earth’s magnetic field and a conventional coil to compensate the superconducting coil’s remnant field down to the Oe level. The magnetic moment was measured against temperature (from 2 K up to above ) in presence of a 5 Oe applied magnetic field, which ensured a response linear and reversible. This is illustrated in Fig. 1 where we present examples for all compositions studied of the dependence upon increasing the field above 5 Oe, and then decreasing to zero. The well defined linear and reversible behavior rules out any spurious effects associated with magnetic flux trapping. Due to the small signal of the crystals studied (of the order of 10-6 emu at low temperatures), we used the reciprocating sample option (RSO) which performs sinusoidal oscillations of the sample about the center of the detection system and improves the sensitivity with respect to the conventional DC option. At each temperature we averaged 8 measurements consisting of 10 cycles at 1 Hz, the resulting uncertainty in magnetic moment being emu.
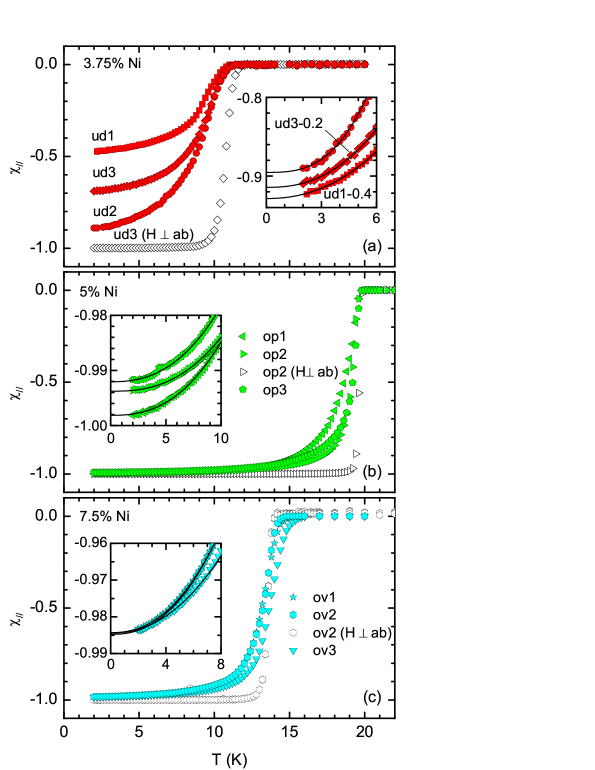
The temperature dependence of is presented in Fig. 2. From these curves, was estimated by linearly extrapolating to zero the higher-slope data, and the transition width as , where is the highest temperature at which a diamagnetic signal is resolved. The resulting values (see Table I) are among the best in the literature for crystals with the same composition.[2, 12, 13, 18, 24, 46] For comparison, we include in Fig. 2 some examples of the magnetic susceptibility obtained with , (open symbols). These last data were corrected for demagnetizing effects by using the demagnetizing factors needed to attain the expected value of at low temperatures, which resulted to be consistent with the values that may be obtained from the crystals’ dimensions[53] (the differences are within 5%). While is temperature independent up to very close to (confirming the excellent quality of the crystals), is notoriously rounded just below due to the competition of with the crystal thickness, , on approaching .
3 Data analysis
3.1 Low-temperature behavior of the in-plane penetration depth
In view of the crystals geometry, the relationship between and may be approximated by,[54]
| (3) |
This expression would allow to determine the absolute value of directly from the data in Fig. 2. However, even a small crystal misalignment may lead to a non-negligible contribution coming from the field component perpendicular to the Fe-layers. Denoting to the possible angle between and the crystal ab layers, the measured magnetic susceptibility would be
| (4) |
where is the demagnetizing factor for . From the crystals dimensions in Table 1 it may be approximated and . As up to very close to , this expression may be approximated by
| (5) |
i.e., the difference between the measured magnetic susceptibility and the actual is a temperature independent value (of the order of for ). While this may difficult determining the absolute value of , it allows to determine its temperature dependence with accuracy. As the crystals thicknesses are of the order of 20 m, and the reported values of are smaller than 1 m (see below), it may be safely approximated up to very close to [typically for it is found and the approximation is accurate within 1%]. Then, from Eqs. (3) and (5) it follows
| (6) |
Taking into account the above mentioned resolution of our measurement system and the geometry of the crystals used, our technique allows to detect changes in of the order of nm, slightly larger than the typical resolution of the TDR technique (about 1 nm, see e.g., the figures in Ref. [12] with TDR measurements in the same compounds).
A detail of the behavior at low temperatures is presented in the insets of Fig. 2. The low-temperature saturation values were determined by fitting a power law in a temperature region up to (solid lines). The resulting values are compiled in Table I. Optimally doped and overdoped crystals present values typically 0.02 larger that the ones expected in view of the values in the literature ( nm in crystals with 5% Ni, and nm in crytals with 7.5% Ni).[24] This is consistent with crystal misalignments of about . Crystals with 3.75% Ni present a larger scattering in the values that may hardly be attributed to crystal misalignments: as for this composition nm,[24] one would have to assume . The scattering in the values of UD crystals could then be attributed to a possible presence of non-superconducting domains in the crystals, maybe associated to the proximity of this doping level to the non superconducting phase.
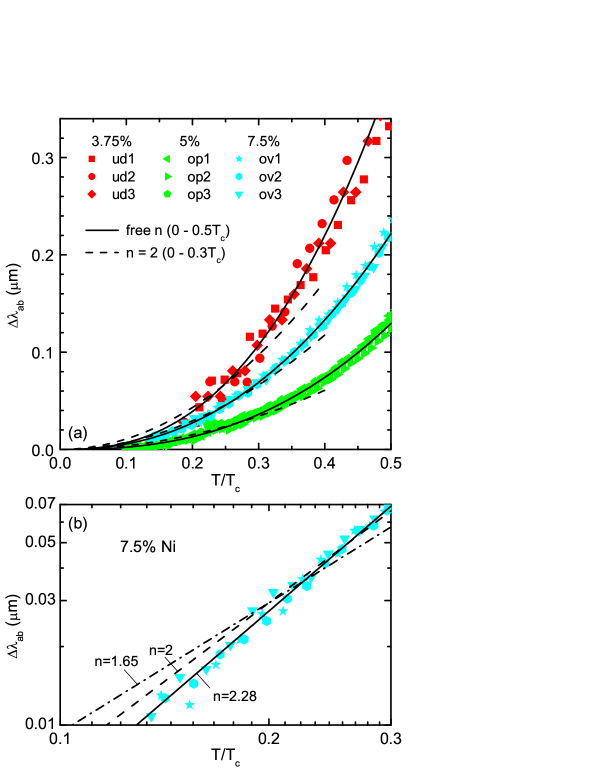
The low-temperature behavior of for all crystals studied is presented in Fig. 3. The data corresponding to crystals with the same composition roughly fall on the same curve, even in the case of the crystals with 3.75% Ni.222The consistency between the data in the three underdoped crystals justifies the applicability of Eq. (3) also in these samples in spite that, as commented above, they may present a distribution of non superconducting domains. This may be explained by taking into account that non-superconducting domains in the samples interior are completely screened and have little effect in the measured ZFC magnetic susceptibility. The global reduction observed in some of these samples may then be attributed to the presence of interconnected non-superconducting domains leading to large (of the order of the samples thickness) unscreened areas within the sample. Provided that they are much larger than , its presence would not appreciably affect the temperature dependence given by Eq. (3). The solid lines are fits of a power law,
| (7) |
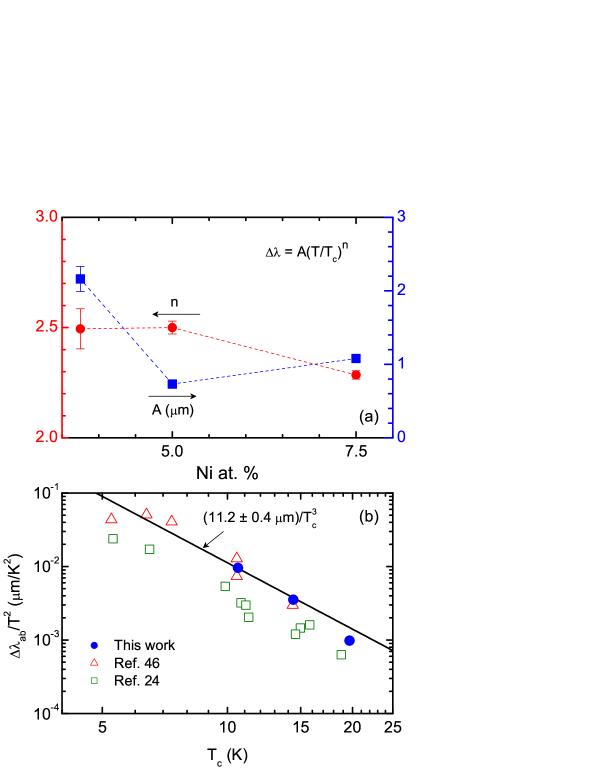
to the set of data for each composition up to . The fit qualities are excellent in all the reduced-temperature range, and lead to the amplitudes and exponents shown in Fig. 4(a). is about up to the optimal-doping level, and decreases to for .333Note that for the underdoped samples the temperature range is restricted to , and the conclusions about the low-temperature behavior are less robust than in optimally-doped and overdoped samples. It has been proposed that impurity scattering would strongly affect the low-temperature behavior of . In particular, superconductors with a fully-gapped order parameter or with a -wave symmetry, would change their exponential/linear temperature dependences in the clean limit to a power law with approaching 2 in the dirty limit.[2] Our present results, with values slightly above , would be then consistent with a nodeless order parameter for all doping levels, affected by the presence of impurity scattering.
It has been calculated that in the dirty limit the amplitude in the quadratic power law should be proportional to .[46] A fit to the experimental data by fixing (dashed lines in Fig. 3(a)) is still reasonably good up to . Also, as it is shown in Fig. 4(b), the resulting amplitude follows the the predicted dependence, and is close to the values found in several FeSC families including Ba(Fe1-xNix)2As2.[24, 46] This reinforces our above conclusion, and suggests that our crystals are close to the limit of strong impurity scattering.
Our results are consistent with recent TDR measurements in crystals with similar compositions.[24] They are also coherent with the results of Kim et al.[18], which showed that in optimally-doped Ba(Fe1-xNix)2As2 diminishes from to when defects are progressively introduced in the crystals through heavy-ion irradiation. However, there is a notable difference with the TDR measurements by Martin et al.[12, 13] who find that falls significantly below 2 in similarly overdoped crystals from the 122 family (BaFe2-xMxAs2 with M=Pd, Co, Co+Cu, and also Ni). This result led these authors to suggest that the superconducting gap is not universal even within the same 122 family, and that in the overdoped regime it may become highly anisotropic and nodal. In agreement with this proposal, measurements of the fluctuation-induced magnetoresistance above in crystals from the same batches as the ones used in the present work,[55] showed that the superconducting anisotropy factor increases with from at optimal-doping up to at high doping levels (7.5% Ni). In addition, studies of the low-temperature specific heat in in Ba(Fe1-xCox)2As2,[56] and of point-contact Andreev reflection in Ba(Fe1-xNix)2As2,[57] also suggest the possible presence of nodes in the overdoped region. However, as it is shown in the detailed log-log representation of Fig. 3(b), exponents below are clearly out of the experimental uncertainty in all our overdoped crystals.
3.2 Temperature dependence of the superfluid density
A more complete analysis of the superconducting gap structure may be done through the temperature dependence of the normalized superfluid density in the complete temperature range below . It may be obtained through,
| (8) |
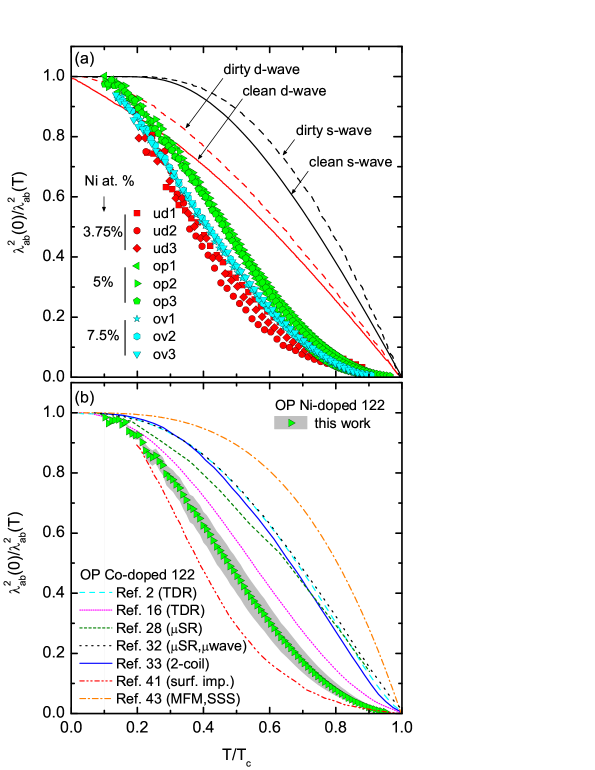
In this expression we used the vs dependence for the Ba(Fe1-xNix)2As2 system derived in Ref. [24] from local Hall magnetometry and, independently, from specific heat measurements. It leads to nm for 3.75% Ni, nm for 5% Ni, and nm for 7.5% Ni. These values are consistent with the ones obtained in Ref. [58] from optical reflectometry, and with the ones for Ba(Fe1-xCox)2As2 with equivalent electron concentrations obtained in Ref. [16] from TDR. The resulting is presented in Fig. 5 where, for comparison, it is also included the result for single-band -wave and -wave superconductors. Contrary to these conventional scenarios, the superfluid density presents a notable positive curvature for temperatures just below for all studied doping levels, which is a sign of two-gap superconductivity.[59] This curvature is more pronounced in the overdoped and underdoped crystals, although the differences are close to the uncertainties in the values (a representative example for one of the optimally-doped crystals is shown as a shaded area in Fig. 5b).
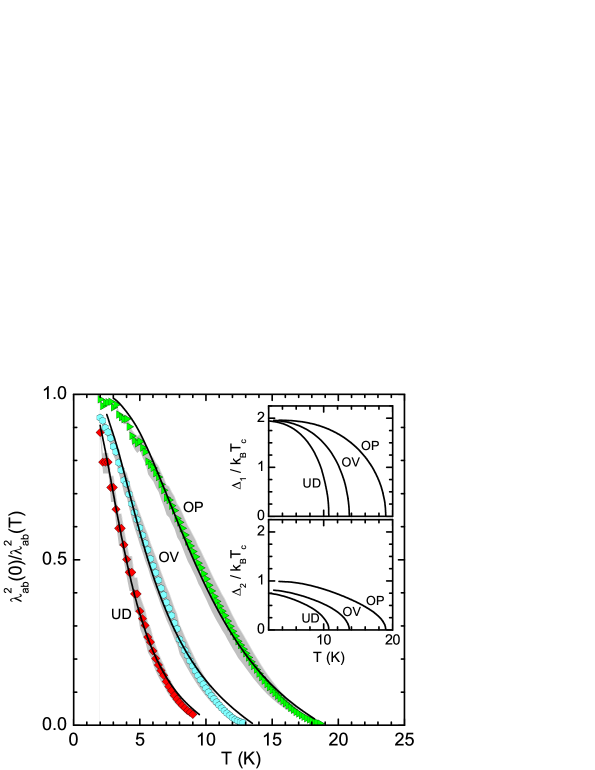
A quantitative analysis of our data is presented in Fig. 6 in the framework of a self-consistent isotropic -wave two-gap model (the so-called gamma model).[59] This model depends on parameters like the in-band ( and ) and inter-band () couplings, the relative density of states ( and ), and the parameter determining the partial contribution to the superfluid density from each band, . This clean -wave model should not work at low temperatures, where we observe a power-law behavior, but it is expected to provide a reasonable description at higher temperatures.[14] To limit the number of the fitting parameters, we have considered that both bands have the same partial density of states, , while was set to give the correct , assuming a Debye temperature of K.[60] The lines in the main panel of Fig. 6 are the fits to the data for temperatures above . The resulting fitting parameters are presented in Table 2, and the corresponding temperature-dependent superconducting gaps, and , are presented in the insets. As in other FeSC’s and, in view of the small value, the main contribution to comes from the band with a smaller gap.[14, 19, 21] However, the existence of the larger gap and a small interband coupling is needed to account for the high .
To our knowledge, there are no data for Ba(Fe1-xNix)2As2 to compare with. However, some works studied it in the very similar Ba(Fe1-xCox)2As2. In the TDR measurements by Gordon et al. in these compounds,[16] an analogous positive curvature was also observed near (see the pink dotted line in Fig. 5b for the optimal doping level). In the same work it is also found a similar dependence of with the doping level, which was attributed to an enhanced gap anisotropy when departing from the optimal doping. However, authors using other techniques obtain results significantly different in the same compounds.[28, 32, 33, 41, 43] As an example, in Fig. 5b we compare the data in the literature for optimally doped Ba(Fe1-xCox)2As2, with our data for Ba(Fe1-xNix)2As2. As it may be seen, in data from Refs. [28], [32], [33], and [43] the positive curvature is much less pronounced or even is not observed, while in the most recent Ref. [41] it is larger. It is also significant the notable differences observed by using the same technique in crystals coming from different batches (see Refs. [2, 16]), which was attributed to differences in the impurity scattering between the samples used.
4 Conclusions
We have shown that measurements of the shielding magnetic susceptibility in the Meissner region allow a direct and reliable determination of the temperature dependence of the in-plane magnetic penetration depth in easily exfoliable Fe-based superconductors. By using high-quality Ba(Fe1-xNix)2As2 single crystals we studied the evolution of with the doping level. At low temperatures we find that it follows a power-law with an exponent almost independent of the doping level, and an amplitude roughly proportional to . These results are consistent with a nodeless order parameter in the limit of strong impurity scattering. This is in agreement with results obtained by using other experimental procedures in the same compounds,[18, 24] but contrasts with the results of Martin et al.[12, 13] who find an exponent significantly below 2 in the strongly overdoped regime, consistent with an order parameter with line nodes in this region.
When combined with the values in the literature, our measurements also allowed to study the temperature dependence of the superfluid density in the full temperature range below . We find a marked positive curvature of in a wide temperature region below (slightly increasing for doping levels away from the optimal one) which is interpreted in the framework of a self-consistent isotropic -wave two-gap model (the so-called gamma model) [59]. These results agree with the TDR measurements of Gordon et al. [16] in the very similar Ba(Fe1-xCox)2As2 system, but present notable differences with other works in the same compound.[2, 28, 32, 33, 41, 43] More measurements are needed in order to determine the evolution of the gap symmetry with the doping level and across the different FeSC families.
References
References
-
[1]
For reviews see, e.g.,
Johnston D C 2010 Adv. Phys. 59 803
Mazin I I 2010 Nature 464 183
Paglione J and Greene R 2010 Nat. Phys. 6 645
Wang F and Lee D -H 2011 Science 332 200
Stewart G R 2011 Rev. Mod. Phys. 83 1589 - [2] Prozorov R and Kogan V G 2011 Rep. Prog. Phys. 74 125505
- [3] Fletcher J D, Serafin A, Malone L, Analytis J G, Chu J -H, Erickson A S, Fisher I R and Carrington A 2009 Phys. Rev. Lett. 102 147001
- [4] Prozorov R, Tanatar M A, Gordon R T, Martin C, Kim H, Kogan V G, Ni N, Tillman M E, Bud’ko S L, Canfield P C 2009 Physica C 469 582
- [5] Tanatar M A, Ni N, Martin C, Gordon R T, Kim H, Kogan V G, Samolyuk G D, Bud’ko S L, Canfield P C and Prozorov R 2009 Phys. Rev. B 79 094507
- [6] Gordon R T et al. 2009 Phys. Rev. Lett. 102 127004
- [7] Gordon R T, Martin C, Kim H, Ni N, Tanatar M A, Schmalian J, Mazin I I, Bud’ko S L, Canfield P C and Prozorov R 2009 Phys. Rev. B 79 100506(R)
- [8] Malone L, Fletcher J D, Serafin A, Carrington A, Zhigadlo N D, Bukowski Z, Katrych S and Karpinski J 2009 Phys. Rev. B 79 140501(R)
- [9] Martin C et al. 2009 Phys. Rev. Lett. 102 247002
- [10] Martin C et al. 2009 Phys. Rev. B 80 020501(R)
- [11] Kim H, Martin C, Tillman M E, Kim S K, Bud’ko S L, Canfield P C, Tanatar M A and Prozorov R 2010 Physica C 470 S363
- [12] Martin C, Kim H, Gordon R T, Ni N, Kogan V G, Bud’ko S L, Canfield P C, Tanatar M A and Prozorov R 2010 Phys. Rev. B 81 060505(R)
- [13] Martin C, Kim H, Gordon R T, Ni N, Thaler A, Kogan V G, Bud’ko S L, Canfield P C, Tanatar M A and Prozorov R 2010 Supercond. Sci. Technol. 23 065022
- [14] Kim H et al. 2010 Phys. Rev. B 81 180503(R)
- [15] Hashimoto K et al. 2010 Phys. Rev. B 81 220501(R)
- [16] Gordon R T et al. 2010 Phys. Rev. B 82 054507
- [17] Hashimoto K et al. 2010 Phys. Rev. B 82 014526
- [18] Kim H et al. 2010 Phys. Rev. B 82 060518(R)
- [19] Kim H, Tanatar M A, Song Y J, Kwon Y S and Prozorov R 2011 Phys. Rev. B 83 100502(R)
- [20] Cho K, Kim H, Tanatar M A, Hu J, Qian B, Mao Z Q and Prozorov R 2011 Phys. Rev. B 84 174502
- [21] Cho K, Tanatar M A, Kim H, Straszheim W E, Ni N, Cava R J and Prozorov R 2012 Phys. Rev. B 85 020504(R)
- [22] Hashimoto K, Kasahara S, Katsumata R, Mizukami Y, Yamashita M, Ikeda H, Terashima T, Carrington A, Matsuda Y and Shibauchi T 2012 Phys. Rev. Lett. 108 047003
- [23] Cho K, Tanatar M A, Spyrison N, Kim H, Song Y, Dai P, Zhang C L and Prozorov R 2012 Phys. Rev. B 86 020508(R)
- [24] Rodière P et al. 2012 Phys. Rev. B 85 214506
- [25] Murphy J, Strehlow C P, Cho K, Tanatar M A, Salovich N, Giannetta R W, Kobayashi T, Miyasaka S, Tajima S and Prozorov R 2013 Phys. Rev. B 87 140505(R)
- [26] Luetkens H et al. 2008 Phys. Rev. Lett. 101 097009
- [27] Khasanov R, Luetkens H, Amato A, Klauss H -H, Ren Z -A, Yang J, Lu W and Zhao Z -X 2008 Phys. Rev. B 78 092506
- [28] Williams T J et al. 2009 Phys. Rev. B 80 094501
- [29] Khasanov R, Bendele M, Amato A, Conder K, Keller H, Klauss H -H, Luetkens H and Pomjakushina E 2010 Phys. Rev. Lett. 104 087004
- [30] Bendele M et al. 2010 Phys. Rev. B 81 224520
- [31] Shermadini Z et al. 2010 Phys. Rev. B 82 144527
- [32] Ofer O et al. 2012 Phys. Rev. B 85 060506(R)
- [33] Yong J, Lee S, Jiang J, Bark C W, Weiss J D, Hellstrom E E, Larbalestier D C, Eom C B and Lemberger T R 2011 Phys. Rev. B 83 104510
- [34] Choi K -Y, Kim S H, Choi C, Jung M -H, Wang X F, Chen X H, Noh J D, Lee S -I 2010 Physica C 470 S506
- [35] Klein T et al. 2010 Phys. Rev. B 82 184506
- [36] Fischer T, Pronin A V, Wosnitza J, Iida K, Kurth F, Haindl S, Schultz L, Holzapfel B, Schachinger E 2010 Phys. Rev. B 82 224507
- [37] Valdés Aguilar R, Bilbro L S, Lee S, Bark C W, Jiang J, Weiss J D, Hellstrom E E, Larbalestier D C, Eom C B and Armitage N P 2010 Phys. Rev. B 82 180514(R)
- [38] Bobowski J S et al. 2010 Phys. Rev. B 82 094520
- [39] Hashimoto K et al. 2009 Phys. Rev. Lett. 102 207001
- [40] Hashimoto K et al. 2009 Phys. Rev. Lett. 102 017002
- [41] Barannik A, Cherpak N T, Tanatar M A, Vitusevich S, Skresanov V, Canfield P C and Prozorov R 2013 Phys. Rev. B 87 014506
- [42] Luan L, Auslaender O M, Lippman T M, Hicks C W, Kalisky B, Chu J -H, Analytis J G, Fisher I R, Kirtley J R and Moler K A 2010 Phys. Rev. B 81 100501(R)
- [43] Luan L, Lippman T M, Hicks C W, Bert J A, Auslaender O M, Chu J -H, Analytis J G, Fisher I R and Moler K A 2011 Phys. Rev. Lett. 106 067001
- [44] Hicks C W, Lippman T M, Huber M E, Analytis J G, Chu J -H, Erickson A S, Fisher I R and Moler K A 2009 Phys. Rev. Lett. 103 127003
- [45] Lippman T M, Kalisky B, Kim H, Tanatar M A, Bud’ko S L, Canfield P C, Prozorov R, Moler K A 2012 Physica C 483 91
- [46] Gordon R T, Kim H, Tanatar M A, Prozorov R and Kogan V G 2010 Phys. Rev. B 81 180501(R)
- [47] Vorontsov A B, Vavilov M G and Chubukov A V 2009 Phys. Rev. B 79 140507(R)
-
[48]
Klein T, Rodière P and Marcenat C 2012 Phys. Rev. B 86, 066501
Cho K, Tanatar M A and Prozorov R 2012 Phys. Rev. B 86 066502 - [49] Krusin-Elbaum L, Greene R L, Holtzberg F, Malozemoff A P and Yeshurun Y 1989 Phys. Rev. Lett. 62 217
- [50] Hebard A F, Fiory A T and Harshman D R 1989 Phys. Rev. Lett. 62 2885
-
[51]
Bean C P and Livingston J B 1694 Phys. Rev. Lett. 12 14
Konczykowski M, Burlachkov L I, Yeshurun Y and Holtzberg F 1991 Phys. Rev. B 43 13707 - [52] Chen Y, Lu X, Wang H, Luo H and Li S 2011 Supercond. Sci. Technol. 24 065004
- [53] Osborn J A 1945 Phys. Rev. 67 351
- [54] Schoenberg D 1965 Superconductivity (Cambridge: Cambridge University Press) p 233
- [55] Rey R I, Carballeira C, Mosqueira J, Salem-Sugui Jr. S, Alvarenga A D, Luo H-Q, Lu X-Y, Chen Y-C and Vidal F 2013 Supercond. Sci. Technol. 26 055004
- [56] Mu G, Tang J, Tanabe Y, Xu J, Heguri S and Tanigaki K 2011 Phys. Rev. B 84 054505
- [57] C. Ren, Z-S. Wang, Z-Y. Wang, H-Q. Luo, X-Y. Lu, B. Sheng, C-H. Li, L. Shan, H. Yang, and H-H. Wen, arXiv:1106.2891.
- [58] Wu D et al. Phys. Rev. B 81 100512(R)
- [59] Kogan V G, Martin C and Prozorov R 2009 Phys. Rev. B 80 014507
- [60] Kant C, Deisenhofer J, G nther A, Schrettle F, Rotter A L M, Johrendt D 2010 Phys. Rev. B 81 014529
| Ni % | crystal | dimensions | |||
|---|---|---|---|---|---|
| (mm3) | (K) | ||||
| 3.75 | ud1 | 10.5 | 0.047 | -0.479 | |
| ud2 | 10.6 | 0.037 | -0.895 | ||
| ud3 | 10.7 | 0.043 | -0.694 | ||
| 5 | op1 | 19.7 | 0.005 | -0.998 | |
| op2 | 19.6 | 0.010 | -0.994 | ||
| op3 | 19.7 | 0.005 | -0.992 | ||
| 7.5 | ov1 | 14.3 | 0.076 | -0.985 | |
| ov2 | 14.1 | 0.049 | -0.984 | ||
| ov3 | 14.8 | 0.080 | -0.984 |
| Ni % | |||||
|---|---|---|---|---|---|
| 3.75 | 0.5 | 0.68 | 0.32 | 0.120 | 0.02 |
| 5 | 0.5 | 0.84 | 0.49 | 0.148 | 0.08 |
| 7.5 | 0.5 | 0.75 | 0.35 | 0.148 | 0.07 |