ALMA Results of the Pseudodisk, Rotating disk, and Jet in Continuum and HCO+ in the Protostellar System HH 212
Abstract
HH 212 is a nearby (400 pc) Class 0 protostellar system showing several components that can be compared with theoretical models of core collapse. We have mapped it in 350 GHz continuum and HCO+ J=4-3 emission with ALMA at up to resolution. A flattened envelope and a compact disk are seen in continuum around the central source, as seen before. The HCO+ kinematics shows that the flattened envelope is infalling with small rotation (i.e., spiraling) into the central source, and thus can be identified as a pseudodisk in the models of magnetized core collapse. Also, the HCO+ kinematics shows that the disk is rotating and can be rotationally supported. In addition, to account for the missing HCO+ emission at low-redshifted velocity, an extended infalling envelope is required, with its material flowing roughly parallel to the jet axis toward the pseudodisk. This is expected if it is magnetized with an hourglass B-field morphology. We have modeled the continuum and HCO+ emission of the flattened envelope and disk simultaneously. We find that a jump in density is required across the interface between the pseudodisk and the disk. A jet is seen in HCO+ extending out to 500 AU away from the central source, with the peaks upstream of those seen before in SiO. The broad velocity range and high HCO+ abundance indicate that the HCO+ emission traces internal shocks in the jet.
1 Introduction
Stars are formed inside molecular cloud cores by means of gravitational collapse. The details of the process, however, are complicated by the presence of magnetic fields and angular momentum. As a result, in addition to infall (or collapse), rotation and outflow are also seen toward star-forming regions. In theory, a rotationally supported disk (RSD) is expected to form inside a collapsing core around a protostar, from which part of the material is accreted by the protostar and part is ejected away. The RSD is expected to be Keplerian when the mass of the protostar dominates that of the disk. Observationally, however, when and how such a disk is actually formed are still unclear, because of the lack of detailed kinematic studies inside the collapsing core in the early phase of star formation.
RSDs have been seen with a radius of 500 AU in the late (i.e., Class II or T Tauri) phase of star formation (see, e.g., Simon et al., 2000). Such disks must have formed early in the Class 0 phase, as claimed in a few Class 0 sources, e.g., HH 211 (, 80 AU, Lee et al., 2009), NGC 1333 IRAS 4A2 (, 130 AU, Choi et al., 2010), L 1527 (, 125 AU, Tobin et al., 2012), and recently VLA 1623 (, 150 AU, Murillo et al., 2013). In models of non-magnetized core collapse, a RSD can indeed form as early as in the Class 0 phase (Terebey et al., 1984). However, a realistic model should include magnetic field, because recent survey toward a few Class 0 sources shows that molecular cores are magnetized and likely to have an hourglass B-field morphology (Chapman et al., 2013). Unfortunately, in many current models of magnetized core collapse, the magnetic field produces an efficient magnetic braking that removes the angular momentum and thus prevents a RSD from forming at the center (Allen, Li, & Shu, 2003; Mellon & Li, 2008). In those cases, only a flattened envelope called the pseudodisk can be formed around the central source (e.g., Allen, Li, & Shu, 2003). Magnetic-field-rotation misalignment is sometimes able to solve this so-called magnetic braking catastrophe (Joos et al., 2012; Li et al., 2013), but not always.
This paper is a follow-up study of the HH 212 protostellar system. This system is deeply embedded in a compact molecular cloud core in the L1630 cloud of Orion at a distance of 400 pc. The central source is the Class 0 protostar IRAS 05413-0104, with a bolometric luminosity 9 (updated for the distance of 400 pc) (Zinnecker et al., 1992). It drives a powerful bipolar jet (Zinnecker, McCaughrean, & Rayner, 1998; Lee et al., 2007). A RSD must have formed in order to launch the jet, accordingly to current jet models. Previous observations in C18O () and 13CO () with the Submillimeter Array (SMA) at resolutions showed a flattened envelope around the central source (Lee et al., 2006). It is infalling with small rotation (i.e., spiraling) into the central source, and thus can be identified as a pseudodisk. The derived infall velocity and rotation velocity in the flattened envelope suggested a small RSD to be present at the center with a radius of 100 AU. However, previous HCO+ J=4-3 observations toward the inner part of the flattened envelope with the SMA at resolution failed to confirm the presence of such a disk (Lee et al., 2007). Later observations at higher angular resolution in continuum suggested again a compact disk around the central source (Codella et al., 2007; Lee et al., 2008).
In order to confirm the presence of a RSD in this system, we have mapped this system in 350 GHz continuum and HCO+ J=4-3 using Atacama Large Millimeter/Submillimeter Array (ALMA) at higher resolution and sensitivity. As before, we can identify a disk around the central source inside the flattened envelope. We model the continuum and HCO+ emission simultaneously, deriving the kinematic and physical properties of both the flattened envelope and the disk. The disk indeed could have a Keplerian rotation profile. In addition, in our model, in order to produce enough continuum emission of the disk, a density jump is required across the interface between the envelope and the disk. We will discuss how the disk can be formed inside the envelope. Since HCO+ also traces the jet close to the central source, we will also discuss the properties and origin of the HCO+ emission in the jet.
2 Observations
Observations of the HH 212 protostellar system were carried out with ALMA on 2012 December 1 during the Early Science Cycle 0 phase. Two scheduling blocks (SBs) were obtained in Band 7 at 350 GHz with 21-24 antennas in the (Cycle 0) extended configuration, with projected baselines ranging from 20 to 360 m. The correlator was set up to have 4 spectral windows, with one for CO J=3-2, one for SiO J=8-7, one for HCO+ J=4-3, and one for the continuum. The spectral resolution for the first 3 windows was set to have a velocity resolution of 0.2 km s-1 per channel. A 9-pointing mosaic was used to observe the jet in this system within from the central source. In this paper, we only present the observational results in HCO+ and continuum, discussing the envelope and disk around the central source. Since HCO+ also traces the jet close to the central source, we will discuss the jet there too. Observational results in CO and SiO will be presented in next paper to discuss the jet further out from the central source.
The data were calibrated with the CASA package, with Quasars J0538-440 (a flux of 1.55 Jy) and J0607-085 (a flux of 1.1 Jy) as passband calibrators, Quasar J0607-085 as a gain calibrator, and Callisto and Ganymede as flux calibrators. With super-uniform weighting, the synthesized beam has a size of at a position angle (P.A.) of 52∘ in continuum, and at a P.A. of 26∘ in HCO+. The rms noise level is 0.61 mJy beam-1 (i.e., 27 mK) for the continuum, and 10 mJy beam-1 (i.e., 0.45 K) for the HCO+ channel maps. The velocities in the channel maps are LSR. The systemic velocity in this region is assumed to be km s-1 LSR, as in Lee et al. (2007). Throughout this paper, we define an offset velocity to facilitate our presentation.
3 Results
3.1 350 GHz Continuum
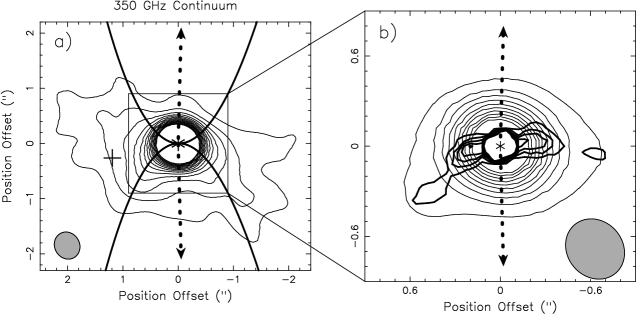
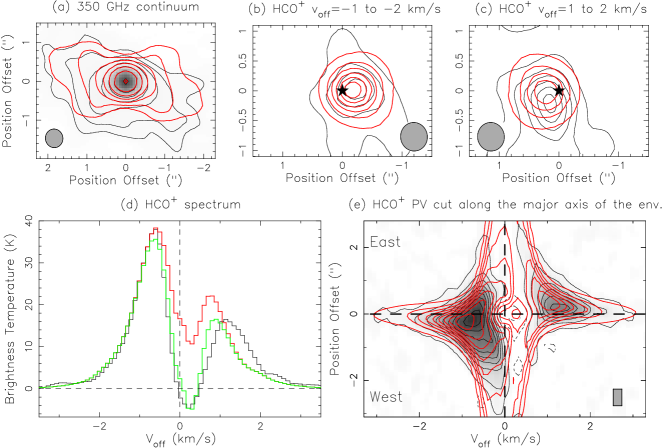
The continuum emission at 350 GHz has been detected before with the SMA (Lee et al., 2007, 2008). It is thermal dust emission arising from a flattened envelope perpendicular to the jet axis and a compact disk at the center. With high sensitivity of ALMA, the flattened envelope is seen extending out to (800 AU) from the central source (Figure 1a), further away than that seen before. It has a mean half thickness of (400 AU). Its inner part, however, is shaped by the cavity walls (outlined by the parabolic curves obtained by fitting the CO outflow shells, Lee et al. in prep). The continuum peak is at , , and it is shifted by to the southeast as compared to that seen before. This shift is only a tenth of the beam size and thus could be due to a position uncertainty in our observations. In the following, this position is used as the source position. The symmetry axis (i.e., minor axis) of the flattened envelope appears to be slightly () misaligned with the jet axis. Part of this misalignment could be caused by an outflow contamination and by a lack of emission in the northwest. In previous observation, a secondary continuum peak was detected at to the southeast of the source (Lee et al., 2008). As seen in our map, this peak (marked as a cross) is likely to be a part of the flattened envelope in the southeast.
Figure 2 shows the visibility amplitude versus -distance plot of the continuum emission. It can be fitted with two circular Gaussian components, one extended tracing the flattened envelope and one compact tracing the disk, as seen in Lee et al. (2008). The extended component has a Gaussian deconvolved size of and a flux of 260 mJy, as found before. On the other hand, the compact component has a Gaussian deconvolved size of , smaller than that found before, which was , but it has a flux of 200 mJy, higher than that found before, which was 120 mJy. The reason for this flux increase is unknown. It could be due to a phase decorrelation at long baselines and a poor -coverage in our previous SMA observations. The total flux integrated over a region within from the source is 460 mJy, about 80 mJy higher than that found before due to this flux increase of the compact component at the center.
The visibility data with -distance greater than 120 k trace only the compact component and thus can be used to reveal the disk structure of the compact component. As seen in Figure 1b, the map (thin contours) obtained with these visibility data shows an elongated structure perpendicular to the jet axis, with a peak brightness temperature of 10 K at the center. Its CLEAN component map clearly shows a disk structure with a radius of (120 AU). Therefore, the compact component at the center indeed traces a disk around the source.
3.2 HCO+ J=4-3
HCO+ J=4-3 emission has been detected before with the SMA at low velocity with 3 km s-1, tracing the inner part of the flattened envelope and outflow (Lee et al., 2007). With the high sensitivity of ALMA, we can map the envelope closer to the central source at higher angular and velocity resolutions in order to check the presence of a RSD at the center, as implied from the continuum result. In addition, HCO+ emission is also detected at high velocity with 3 km s-1, tracing the jet from the central source. It is faint and thus was not detected before.
3.2.1 Flattened Envelope, Disk, and Outflow
The HCO+ spectrum toward the central region ( oriented along the major axis) of the envelope shows that the HCO+ emission is detected with km s-1 in the envelope (Figure 3). The spectrum has two peaks, one in the blue and one in the red, with the one in the blue brighter than the one in the red. It also has a dip in between at km s-1 on the redshifted side. These two spectral features suggest an infall motion in the envelope (Evans, 1999). In order to see the velocity structure in detail, we divide the velocity into 3 ranges: km s-1, km s-1, and km s-1.
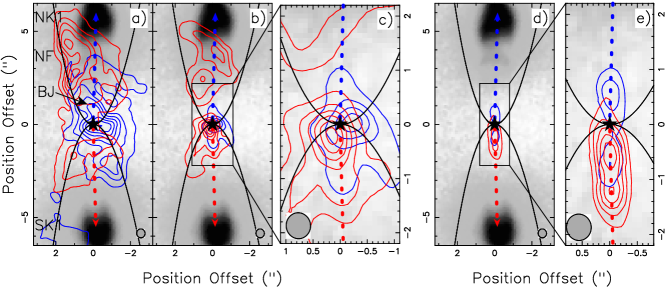
The HCO+ emission with km s-1 is shown in Figure 4a. In the equator, the emission traces the flattened envelope. The blueshifted emission is seen across the central source with a peak to the west. The redshifted emission is much weaker and is seen mainly in the east. This spatial distribution has been seen before in 13CO J=2-1 in Lee et al. (2006), and it indicates that the envelope mainly has infall motion, and some small rotation with the redshifted side in the east and blueshifted side in the west. The redshifted emission is fainter due to a self-absorption in the near side of the envelope (Evans, 1999) and it is shifted to the east due to rotation motion. Away from the equator, the emission in the south shows a parabolic shell tracing the outflow cavity wall opening to the south, with the blueshifted emission to the west and redshifted emission to the east of the jet axis. The velocity sense is the same as that of the envelope, suggesting that the cavity wall consists of swept-up material originally in the envelope. In the north, the emission structure is complicated by bow shock interactions. Redshifted emission is seen around bow shocks NF and NK1, and faint blueshifted emission is seen around bow shock NF. These emissions could trace the bow shock wings interacting with the outflow cavity wall outlined by the parabolic curve. Also, a bright blueshifted jet-like structure (labeled as BJ) is seen extending from the inner blueshifted part of the envelope to the northeast. It could trace a low-velocity part of a jet or a jet interaction with the outflow cavity wall.
The HCO+ emission with km s-1 is shown in Figure 4b, with a zoom-in shown in Figure 4c. In the equator, the redshifted and blueshifted emissions are seen with their peaks on the opposite sides within of the central source (Figure 4c), spatially coincident with the disk-like continuum emission seen in Figure 1b. The redshifted peak is shifted slightly to the south due to a contamination of a redshifted jet-like emission extending to the south. Therefore, that part of the envelope indeed has become a rotating disk around the central source. Also, jet-like emission starts to show up clearly, extending to the north and south out from the disk. Thus, the spectrum shown in Figure 3 also includes some of these emissions at the base. In the south, the parabolic outflow shell is still seen, tracing the outflow cavity wall at higher velocity. In the north, redshifted emission is seen mainly around bow shock NF, tracing the bow shock wings. However, no blueshifted emission is seen around that bow shock. In previous study, CO emission was detected around that bow shock not only in redshifted velocity but also in blueshifted velocity extending to 5 km s-1 (see Fig. 5 in Lee et al., 2007), indicating that the blueshifted emission has a wider spread of velocities, and thus lower intensity per velocity. This is because that bow shock is tilted toward us, so that its back wall is projected on the low redshifted side, while its front wall is projected to a wide range of blueshifted velocities (Lee et al., 2001). Thus, the blueshifted HCO+ emission is likely lost in the noise.
At higher velocity with km s-1, the redshifted and blueshifted emission in the equator are also seen on the opposite sides of the central source but closer in (Figures 4d and 4e for a zoom-in), tracing the disk emission. Jet emission is clearly seen extending out to the north and south, and it seems to connect to the disk emission. At this high velocity, neither shell-like emission nor emission around the bow shocks are detected.
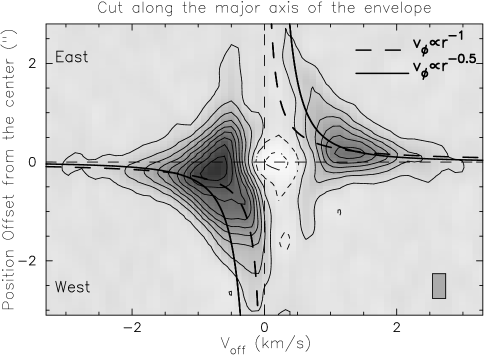
Figure 5 shows the PV diagram of the HCO+ emission cut along the equator in order to further study the kinematics of the envelope and disk. The blueshifted peak is brighter than the redshifted peak and the emission is missing at low redshifted velocity ( 0 to 0.5 km s-1), consistent with that seen in the spectrum in Figure 3. As mentioned earlier, these are the well-known signatures for an infall motion in the envelope (Evans, 1999), and the missing of the redshifted emission is due to a self absorption in the near side of the envelope. At low velocity, a triangular PV structure is seen on the blueshifted side with its base extending from the west to the east across the central position and its tip pointing toward the high blueshifted velocity, also as expected for an infall envelope (Ohashi et al., 1997). A similar triangular PV structure could also be seen on the redshifted side, although its base is almost gone due to the self-absorption. Therefore, the low-velocity part indeed traces the infalling envelope. Since the triangular PV structure on the blueshifted side is shifted slightly to the west and the triangular PV structure on the redshifted side is shifted slightly to the east, the infalling envelope also has a small rotation. As discussed later, the lack of emission in the low redshifted velocity is enhanced by a presence of an extended infalling envelope that is resolved out by the interferometer. The negative contours centered at 0.2 km s-1 around the source are due to an absorption of the bright continuum (disk) emission near the source by the near side of the envelope. At km s-1, the emission shrinks toward to the center, with the blueshifted emission mostly shifted to the west and the redshifted emission mostly shifted to the east. This is because the rotation starts to dominate and the innermost part of the envelope has become a rotating disk. The PV structure there seems to be better described by a Keplerian rotation curve than the rotation curve with conservation of specific angular momentum.
3.2.2 Extended infalling envelope
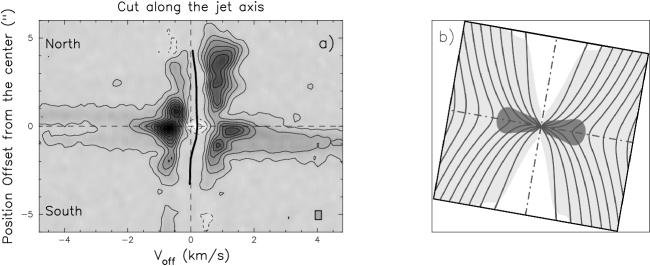
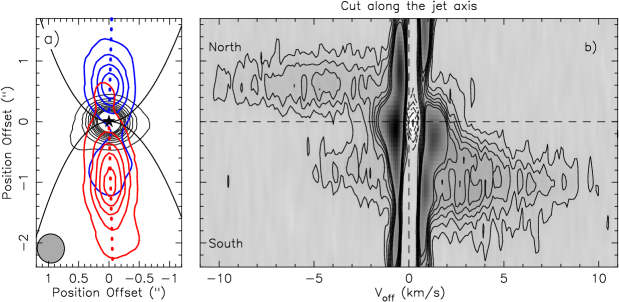
Figure 6a shows the PV diagram cut along the jet axis. The PV diagram is complicated, consisting of several components. The faint emission with km s-1 mainly traces the jet. The bright emission at low velocity (with km s-1) located within from the central source should mostly trace the flattened envelope. The low-velocity emission that extends further out ( to the north and to the south) from the central source should trace the outflow shells and bow shock wings. The emission is also missing at low velocity, with the mean velocity of the missing part indicated by the thick solid line. In the north, the mean velocity of the missing part is always on low redshifted side decreasing from 0.2 to 0.05 km s-1, while in the south, the mean velocity of the missing part goes from low redshifted velocity at 0.2 km s-1 around the source to near the systemic velocity at and beyond. This suggests a presence of an extended infalling envelope in the outer part of the system and its near side is projected at those velocities, absorbing the emission from the jet, flattened envelope, outflow shells, and bow shock wings, and then itself is resolved out by the interferometer.
In order to have those projected velocities, the material in the extended envelope is unlikely to be infalling radially toward the center, in which case, it would produce similar projected velocities in both the north and south. Since hourglass B-field morphology has been predicted in the extended infalling envelope in theoretical model of core collapse (Allen, Li, & Shu, 2003) and has also been claimed in a few Class 0 systems (Chapman et al., 2013), this B-field morphology is expected to be present in our system as well. Therefore, one likely possibility to produce those projected velocities is to have the material there flowing along the hourglass field lines toward the flattened envelope, as seen in theoretical model of core collapse (Allen, Li, & Shu, 2003). Since the jet is tilted at a small inclination angle with the north side toward us, the field lines are likely tilted toward us in the north while tilted to the plane of the sky in the south, as shown in Figure 6b. Therefore, the near side of the extended envelope is seen almost with redshifted velocity in the north, while first seen in redshifted velocity and then seen near the systemic velocity in the south, producing the missing part in the PV diagram.
3.2.3 Jet
Figure 7 shows the HCO+ jet and its PV diagram. Here the map of the jet is obtained using the emission with km s-1. This is because the emission with km s-1 is contaminated by the emission of the flattened envelope, disk, outflow cavity walls, and bow shock wings, as shown in Figure 4. The HCO+ jet is collimated. Its redshifted emission extends mainly to the south with a peak at , and its blueshifted emission extends mainly to the north with a peak at . Its emission peaks are located upstream of those seen before in SiO emission, which are at in the north and in the south (Lee et al., 2008). The PV diagram is the same one in Figure 5, but is focused on the jet and thus shown with a wider velocity range and a smaller contour step. It shows that the HCO+ emission of the jet has a broad range of velocities, indicating that it arises from internal shocks in the jet, like the SiO emission (Lee et al., 2008). The northern part of the jet emission extends from 10 to 3 km s-1, and the southern part from 5 to 10 km s-1. Thus, the HCO+ emission in the jet has a mean velocity range of 14 km s-1. The middle velocities of the jet emission are 3.5 km s-1 in the north and 2.5 km s-1 in the south, and thus much lower than the jet velocity (which is 100200 km s-1, Lee et al., 2008). This is consistent with the jet lying close to the plane of the sky.
4 Model of the envelope and disk
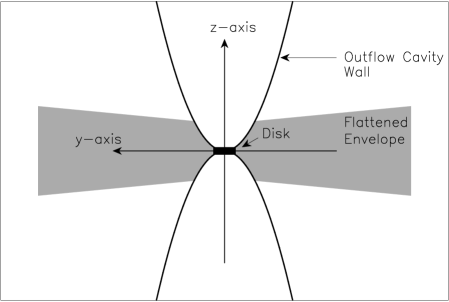
Here we construct a spatio-kinematic model to reproduce simultaneously the continuum and HCO+ emission of the flattened envelope and disk. Figure 8 shows the schematic diagram of the model in Cartesian coordinate system. The flattened envelope is in the equatorial plane ( plane) perpendicular to the jet axis (axis) and the compact disk is located at the center inside the flattened envelope. Two outflow cavities (obtained by fitting the CO outflows, Lee et al. in prep) are also included, excavating the innermost part of the flattened envelope. However, no extended infalling envelope is included due to a lack of physical information. For simplicity, dust and HCO+ gas are assumed to have the same temperature. The flattened envelope and disk are dusty and gaseous, producing both the continuum and HCO+ emissions.
Previously, the outer part of the flattened envelope was detected in C18O J=2-1 with an outer radius of (2000 AU) (Lee et al., 2006). Thus, the outer radius of the flattened envelope is assumed to have this value. The inner radius of the flattened envelope is set to the outer radius of the disk. The half thickness of the outer part of the flattened envelope is found to be in C18O J=2-1. From the HCO+ and continuum maps, the half thickness of the inner part of the flattened envelope is estimated to be . Thus in this model, the half thickness of the flattened envelope () is assumed to increase from from the inner radius to at the outer radius. The innermost part of the flattened envelope is excavated by the outflow.
In the flattened envelope, the temperature, number density of molecular hydrogen, infall velocity, and rotation velocity are assumed to follow those obtained from modeling the outer part of the flattened envelope in C18O, which are respectively
| (1) |
| (2) |
| (3) |
and
| (4) |
with being the radial distance from the central source. Here (400 AU) is the reference radius, and , , , and are the reference values at that radius. The density has a power-law index of , as predicted in infalling models (e.g., Nakamura, 2000). The temperature has a power-law index of , as found in the envelopes around other low-mass protostars. The flattened envelope has a radial infall velocity assumed to be that of free fall. Its rotation velocity is assumed to be that of constant specific angular momentum. Thus, the material in the flattened envelope is spiraling inward toward the central source.
The disk is not well resolved in our observations, especially in the minor axis. It is assumed to be a flat disk with an outer radius of (120 AU) and a constant half thickness of (40 AU), as judged from the Clean Component map. Note that this outer radius of the disk can be considered as an upper limit of the actual disk radius. The inner radius of the disk is unknown and set to a very small value of (4 AU). When the flattened envelope transforms into the disk, the rotation velocity becomes Keplerian, as predicted in core collapse model (e.g., Nakamura, 2000) and as seen in the older system HH 111 (Lee, 2010). Thus, the rotation velocity in the disk is assumed to be Keplerian. With the free-fall velocity of the flattened envelope, we can derive the mass of the central protostar to be
| (5) |
and then the rotation velocity of the disk to be
| (6) |
In the current models of disk formation (e.g., Krasnopolsky & Königl, 2002), there will be an accretion shock across the envelope-disk interface, producing a jump in the temperature, density, and infall velocity there. As discussed later, since the disk density is high there with a value cm-3, the cooling is efficient and thus the shock should be close to be isothermal. Therefore the temperature is assumed to be continuous across the interface. In addition, the temperature in the disk is assumed to increase with the decreasing radius with a power-law index , i.e.,
| (7) |
where is the envelope temperature at the disk radius.
The number density is discontinuous with a jump across the interface. The jump is assumed to be a free parameter to be obtained from our model. Therefore, the number density is assumed to be given by
| (8) |
where is the envelope number density at the disk radius. The density of the disk is assumed to have a power-law index of . With a constant thickness, the disk has a surface density with a power-law index of , similar to that found in the Class I disk (Lee, 2011) and T-Tauri disks (Andrews et al., 2009).
The infall velocity also has a jump across the interface. According to jump condition for mass conservation, the infall velocity at the interface drops to
| (9) |
where is the envelope infall velocity at the interface. In our model, the accretion velocity in the disk at the interface is assumed to be given by this infall velocity. The accretion velocity in the disk, , can then be derived, assuming a constant accretion rate across the disk, i.e., = constant. Since and =constant, the accretion velocity is constant and given by
| (10) |
A similar but more self-consistent model derived from the theoretical work of Ulrich (1976) has been applied to massive star-forming regions (Keto & Zhang, 2010). Our model here is simple and can be considered as a first step to disentangle the envelope and disk in our system. In our model calculations, radiative transfer is used to calculate the continuum and HCO+ emissions, with an assumption of local thermal equilibrium. To calculate the continuum emission, we assume a dust mass opacity law given by (see, e.g., Beckwith et al., 1990)
| (11) |
with , as found in Lee et al. (2007) from fitting the SED. To calculate the HCO+ emission, the abundance of HCO+ relative to molecular hydrogen, , is required and assumed to be a free parameter to be derived by fitting the continuum and the HCO+ emission simultaneously. The line width of the HCO+ emission is assumed to be given by the thermal line width only. The line width due to turbulence is not included in our model. We first calculate the channel maps with radiative transfer and next map them with the observed -coverage and velocity resolutions. The resulting channel maps can then be used to make the continuum map and HCO+ channel maps. The HCO+ channel maps can then be used to make the spectrum, integrated maps, and PV diagrams of HCO+.
In our model, there are 7 free parameters, with their best-fit values of K, cm-3, km s-1, km s-1, , , and . The distributions of the rotation velocity, infall velocity, sound speed, temperature, and density of the envelope and disk derived from these parameters are shown in Figure 9. The best-fit parameters are obtained by matching the continuum map, HCO+ channel maps, spectrum, and PV diagram in our model to those in the observations (Figure 10). As expected, the best-fit parameters in the envelope are similar to those obtained from modeling the outer part of the envelope seen in C18O (Lee et al., 2006). The HCO+ abundance is also similar to that found in molecular cloud cores, which is (Girart et al., 2000). The temperature power-law index of the disk is also similar to that found in the Class I disk in HH 111 (Lee, 2011). Notice that since the disk is not well resolved, this power-law index here should be considered as a rough value. The high density jump in the disk is required to produce the bright disk emission at the center. Without the density jump, the continuum flux at the center would be a factor of 7 lower than the observed. This density jump will be further discussed later.
Our model can reproduce the continuum and HCO+ emission of the flattened envelope and disk reasonably well. As can seen in Figure 10a, our model can reproduce the continuum structure and intensity for both the flattened envelope and compact disk. Our model is symmetric and thus is not intended to produce the emission extending only to the south. Our model can also reproduce the PV diagram of the HCO+ emission along the major axis (Figure 10e). Note that the low-velocity emission with km s-1 is expected to mostly disappear if an extended infalling envelope is included. To support our argument, we assume that the effect of the extended infalling envelope toward the center mimics a Gaussian spectrum centered at 0.2 km s-1. After we subtract this Gaussian component from our model spectrum (red spectrum), we can obtain a spectrum (green spectrum) that matches the observed spectrum toward the center at low velocity (Figure 10d). Our model can also reproduce the HCO+ maps at 2 km s-1 (Figures 10b and c). Since our model does not include the outflow and jet, it can not reproduce their emission seen in the observations. In the HCO+ spectrum, part of the observed redshifted emission with 1 km s-1 is from them, and thus can not be reproduced in our model.
4.1 Consistency Checks
Here in this section, we present consistency checks for the best-fit parameters in our model. Keplerian radius is the radius where the rotation velocity equals the Keplerian rotation. Thus, equaling the Keplerian rotation velocity to the rotation velocity in the flattened envelope, we can derive the Keplerian radius to be
| (12) |
With the best-fit parameters, the Keplerian radius is found to be , which turns out to be the same as the outer radius of the disk assumed here in our model. Therefore, the disk could indeed have an outer radius of (120 AU). Note that since the disk is not spatially resolved in our observations, this disk radius should be considered as an upper limit.
As discussed earlier, an accretion shock is expected to be present at the interface between the envelope and disk, producing a jump across the interface. At low angular resolution, a compact SO emission with a radius of AU was detected around the central source of HH 212, with a low-velocity component tracing the rotation (Lee et al., 2007). Since SO emission has been claimed to trace accretion shocks in the disks of other sources, e.g., HH 111 (Lee, 2010) and L1527 (Sakai et al., 2014), the SO emission in HH 212 could trace an accretion shock as well. Further observations at higher resolution are needed to confirm this. For an isothermal shock, the density is expected to have a jump factor of , where is the shock Mach number. The isothermal shock Mach number at the disk radius can be given by
| (13) |
where is the isothermal sound speed of the envelope at the disk radius. At the disk radius, the temperature of the envelope is 73 K and thus the isothermal sound speed is 0.51 km s-1, here as Helium is included with . The infall velocity of the envelope at the disk radius is km s-1 and thus . Therefore, , the same as that obtained from our model, and thus the jump condition is self-consistent in our model.
Initially, the shock should be adiabatic. According to shock jump condititons with , the gas should be compressed and heated by the shock to have a density of cm-3 and a temperature of 200 K. Since the density is high, the cooling due to dust grains is efficient. Using the cooling rate of dust grains in Suttner et al. (1997), the cooling time is estimated to be 1 yr. With the accretion velocity of 0.2 km s-1, the material only moves inward by a distance of 0.04 AU, much smaller than the disk size. Thus, the shock should quickly become radiative and isothermal, consistent with our model.
Using Eq. 5, the mass of the central star is found to be 0.18 . The disk mass is
| (14) |
We can check this disk mass using the observed continuum flux of the disk. Assuming that the observed disk continuum emission is optically thin, this mass requires the disk to have a representative temperature of 91 K. In our model, this temperature corresponds to the value at in the disk. In the observations, from the SED fitting, the representative temperature of the envelope and disk together was found to be 48 K (Lee et al., 2007). The disk is warmer and thus can have a representative temperature as high as 91 K. As a result, the disk mass derived here should be consistent with the observations. It is 8% of the stellar mass and thus the disk indeed can be formed. On the other hand, the mass in the flattened envelope is
| (15) |
which is 56% of the stellar mass.
In our model, the accretion velocity in the disk is assumed to be given by the infall velocity at the shock interface (see Eq. 10). It is 0.20 km s-1 and thus much smaller than the rotation velocity (Figure 9a), as expected for a RSD. The accretion rate in the disk is the same as the infall rate at the disk radius, and thus it is given by
| (16) |
Assuming the same accretion rate in the past, the accretion time would be yrs, as expected for a Class 0 source. The accretion luminosity is . Assuming , then L⊙, comparable to the bolometric luminosity of this source, which is 9 L⊙ (Zinnecker et al., 1992, corrected for the new distance of 400 pc).
5 Discussion
5.1 Comparing to Class 0 and I disks
Our model is a simple spatio-kinematic model, consisting of a flattened envelope with its material spiraling toward the central source and a RSD at the center. This model is inspired by the previous work on the Class I system HH 111 in Orion in the later stage of star formation (Lee, 2010). In that system, the rotation velocity is found to change from that of conserving angular momentum in the flattened envelope to that of Keplerian in the disk. Here we assume the same change of rotation velocity here in HH 212. Judging from the Clean Component map of the continuum, the disk can have a radius of 120 AU (). This disk radius turns out to be the same as the Keplerian radius derived from the infall velocity and rotation velocity profiles found in our model. This disk radius is also similar to those claimed in other Class 0 systems (Lee et al., 2009; Choi et al., 2010; Tobin et al., 2012; Murillo et al., 2013). This radius is much smaller than that in HH 111, which is 2000 AU. This is likely because the disk size grows with time (Terebey et al., 1984). The accretion age is yrs in HH 111 (Lee, 2010), a factor of 10 older than that in HH 212. In addition, the specific angular momentum in the infalling flattened envelope is 1550 AU km s-1 in HH 111, also a factor of 10 larger than that in HH 212, which is 140 AU km s-1. Therefore, in HH 111, the expansion wave could have expanded 10 times further away, bringing in more material with higher specific angular momentum from a much larger distance (Terebey et al., 1984). A few other Class I Keplerian disks have been recently claimed in Taurus in Harsono et al. (2013). Those disks have a disk radius of 100 AU, similar to that found in the Class 0 disks. The small radius of those disks could be due to the low specific angular momentum of 200 AU km s-1 in their infalling envelopes. In another word, the disk radius could depend significantly on the environmental conditions.
In our model of HH 212, there is a huge jump (a factor of 8) in density and infall (radial) velocity across the interface between the envelope and disk in the equatorial plane. This is because the infall velocity is much higher than the isothermal sound speed at the interface, producing a (accretion) shock Mach number . In HH 111, on the other hand, the infall velocity is only slightly higher than the isothermal sound speed at the interface, resulting in a small Mach number . Thus, the jump in density and infall velocity is not significant. In another word, accretion shock and thus density jump would be less obvious in the later phase of star formation as the disk grows larger, because infall velocity decreases faster with the increasing distance from the source than the sound speed.
The formation of Class 0 disk is still unclear in theory because some of the current models of magnetized core collapse include significant magnetic braking (Krasnopolsky & Königl, 2002; Allen, Li, & Shu, 2003; Mellon & Li, 2008), large enough to hinder disk formation unless somehow overcome through the effects of (e.g.) turbulence, asymmetry, or non-ideal MHD. In HH 212, the formation of the disk could be facilitated by the outflow walls at the base, which force the material to flow in a small channel toward the central protostar. Further observations are needed to check this possibility.
5.2 Pseudodisk and Extended Envelope
The flattened envelope is infalling with rotation (i.e., spiraling) into the central source, and thus can be identified as a pseudodisk found in the models of magnetized core collapse (see, e.g., Allen, Li, & Shu, 2003). The outer radius of this pseudodisk could be 2000 AU, judging from previous C18O observations (Lee et al., 2006). Using the mean isothermal sound speed in the pseudodisk, which is 0.4 km s-1 (see Figure 9a), the dynamical age of the pseudodisk could be yrs. This age is about two-third of the accretion time estimated earlier, acceptable in the models of magnetized core collapse (see, e.g., Allen, Li, & Shu, 2003). Since the pseudodisk is essentially a magnetic feature, polarization observations with ALMA in thermal dust emission are needed to confirm the presence of magnetic field in the pseudodisk and check if the field axis is aligned with the the symmetry axis of the pseudodisk. As mentioned earlier, the symmetry axis of the flattened envelope appears to be slightly () misaligned with the jet axis. Further work is needed to study if this misalignment could be due to a magnetic-field-rotation misalignment that could help the formation of the disk (Joos et al., 2012).
In addition, an extended infalling envelope is required to be present surrounding the pseudodisk in order to produce the missing flux in the PV diagram (Fig. 6) and the spectrum in HCO+ (Fig. 3) at low-redshifted velocity. This extended envelope, however, is resolved out by ALMA in our observations. In this extended envelope, the material is required to be flowing roughly parallel to the jet axis toward the pseudodisk. This is expected if the envelope is magnetized with an hourglass B-field morphology roughly parallel to the jet axis. Since the material can flow along the field lines, the material can flow parallel to the jet axis into the pseudodisk. In order to confirm this scenario, future polarization observations with ALMA (with Compact Array) in thermal dust emission are really needed to map the B-field morphology in the extended envelope.
5.3 HCO+ Jet and Abundance
The jet is clearly seen in HCO+. The HCO+ abundance there could be highly enhanced in order for the HCO+ emission to be detected. To explore this possibility, here we derive the HCO+ abundance using the constraint on the mass-loss rate to be derived from the HCO+ emission. Since the jet emission with km s-1 is partly missing and is partly contaminated by the outflow/envelope/disk emission, the real flux of the HCO+ emission in the jet can be estimated by first measuring the flux with km s-1, and then multiplied it by 14/10 = 1.4, where 14 km s-1 is the mean velocity range of the jet and 10 km s-1 is the velocity range used in the measurement of the flux. The HCO+ jet using 2 km s-1 has a mean flux of 0.7 Jy beam-1 km s-1 along the jet axis. Thus, the corrected mean flux is 1.0 Jy beam-1 km s-1. The excitation temperature of the HCO+ emission of the jet is assumed to be 50 K, like that of the CO emission of the jet (Lee et al., 2007; Cabrit et al., 2012). The HCO+ emission of the jet has a brightness temperature of only 2-10 K, and thus can be assumed to be optically thin. Therefore, the mean column density of HCO+ is cm-2. Note that an increase of 50 K in the excitation temperature only produces an increase of 30% in the column density.
The mean density in the jet can be given by
| (17) |
where is the beam size across the jet axis as the jet is not resolved and is the jet diameter. Thus, the mass-loss rate in two sides of the jet can then be given by
| (18) |
where km s-1 is the jet velocity (Lee et al., 2008), and is the HCO+ abundance to be derived. In the current MHD jet launching models, the mass-loss rate can have a mean of 20% of the accretion rate (Shu et al., 2000; Konigl & Pudritz, 2000). Therefore, with the accretion rate derived earlier, we have yr-1. As a result, we have , higher than that derived in the flattened envelope by a factor of 100. This abundance is also consistent with that found in other sources, in which the HCO+ abundance has been greatly enhanced in shocks with a range from to (Viti, Natarajan, & Williams, 2002; Dent et al., 2003; Rawlings et al., 2004).
We now can derive the mean density in the jet using Equation 17 and the HCO+ abundance. The jet was found to have a diameter of (80 AU) (Cabrit et al., 2007; Lee et al., 2008), thus the mean density in the jet is cm-3. For the two HCO+ emission peaks in the jet, their fluxes are 60% higher than the mean flux of the jet, and thus their density can be 60% higher, or cm-3. This density is more than 10 times lower than the critical density of HCO+ J=4-3 line, which is cm-3.
The two HCO+ peaks in the jet are seen with a broad velocity range of 14 km s-1, suggesting that they are produced by internal shocks of 14 km s-1 in the jet. Previous observations show that SiO emissions are seen downstream produced by stronger shocks of 20 km s-1 (Lee et al., 2008). That no HCO+ emission is seen downstream suggests that HCO+ is either destroyed by stronger shocks or excited to higher J levels in a warmer environment. In any case, the shock seems to become stronger with the increasing distance from the source, as expected if the shock is produced by a variation in jet velocity (Raga et al., 1990). The peak positions are asymmetric with the northern one at (220 AU) and the southern one at (400 AU). Assuming a jet velocity of 150 km s-1, the dynamical ages are 8 and 13 yrs, respectively. Thus, the abundance enhancement can take place in less than 10 yrs. The process for this enhancement is unclear. It is possibly the result of ice mantle evaporation and/or sputtering and may also be due to enhanced gas-phase production in dense and warm environments (Rawlings et al., 2013). Further study is really needed to determine the process that can lead to this abundance enhancement in the internal shocks of the jet.
6 Conclusions
We have mapped the HH 212 protostellar system in the dust continuum at 350 GHz and the HCO+ (J=4-3) line. Our primary conclusions are the following:
-
•
A flattened envelope is seen in continuum and HCO+ around the central source, extending out to 800 AU (). The HCO+ kinematics shows that the flattened envelope is infalling with rotation (i.e., spiraling) into the central source, and thus can be identified as a pseudodisk found in the models of magnetized core collapse.
-
•
Inside the flattened envelope, a bright compact disk is seen in continuum at the center with an outer radius of 120 AU (). This disk is also seen in HCO+ and the HCO+ kinematics shows that the disk is rotating.
-
•
HCO+ emission is missing at low-redshifted velocity centered at 0.2 km s-1. To account for this missing, an extended infalling envelope is required, with its material flowing roughly parallel to the jet axis toward the pseudodisk. This is expected if the envelope is magnetized with an hourglass B-field morphology. Since the material can flow along the field lines and the field lines are roughly parallel to the jet axis, the material can flow parallel to the jet axis into the pseudodisk.
-
•
We have modeled the continuum and HCO+ emission of the flattened envelope and disk simultaneously. In our model, we assume a change of rotation profile from that of conserving specific angular momentum in the flattened envelope to that of Keplerian in the disk, as inspired by theoretical models of core collapse and previous observations of HH 111. In order to reproduce enough disk continuum emission at the center, a jump in density with a factor of 8 is required across the interface between the flattened envelope and the disk. This jump turns out to be consistent with an isothermal shock at the interface. In our model, the disk only has 8% of the stellar mass and thus can indeed be formed. However, further observations at higher resolution are needed to confirm its Keplerian rotation and its radius.
-
•
A collimated jet is seen in HCO+ extending out to 500 AU from the central source (and disk?), with its peaks located upstream of those seen before in SiO. The HCO+ emission is seen with a broad range of velocities. The HCO+ abundance is highly enhanced by a factor of 100, comparing to that of the flattened envelope. All these suggest that the HCO+ emission traces internal shocks in the jet.
References
- Allen, Li, & Shu (2003) Allen, A., Li, Z., & Shu, F. H. 2003, ApJ, 599, 363
- Andrews et al. (2009) Andrews, S. M., Wilner, D. J., Hughes, A. M., Qi, C., & Dullemond, C. P. 2009, ApJ, 700, 1502
- Beckwith et al. (1990) Beckwith, S. V. W., Sargent, A. I., Chini, R. S., & Guesten, R. 1990, AJ, 99, 924
- Cabrit et al. (2007) Cabrit, S., Codella, C., Gueth, F., Nisini, B., Gusdorf, A., Dougados, C., & Bacciotti, F. 2007, A&A, 468, L29
- Cabrit et al. (2012) Cabrit, S., Codella, C., Gueth, F., & Gusdorf, A. 2012, A&A, 548, L2
- Chapman et al. (2013) Chapman, N. L., Davidson, J. A., Goldsmith, P. F., et al. 2013, ApJ, 770, 151
- Choi et al. (2010) Choi, M., Tatematsu, K., & Kang, M. 2010, ApJ, 723, L34
- Codella et al. (2007) Codella, C., Cabrit, S., Gueth, F., Cesaroni, R., Bacciotti, F., Lefloch, B., & McCaughrean, M. J. 2007, A&A, 462, L53
- Dent et al. (2003) Dent, W. R. F., Furuya, R. S., & Davis, C. J. 2003, MNRAS, 339, 633
- Evans (1999) Evans, N. J., II 1999, ARA&A, 37, 311
- Girart et al. (2000) Girart, J. M., Estalella, R., Ho, P. T. P., & Rudolph, A. L. 2000, ApJ, 539, 763
- Harsono et al. (2013) Harsono, D., Jorgensen, J. K., van Dishoeck, E. F., et al. 2013, arXiv:1312.5716
- Joos et al. (2012) Joos, M., Hennebelle, P., & Ciardi, A. 2012, A&A543, A128
- Keto & Zhang (2010) Keto, E., & Zhang, Q. 2010, MNRAS, 406, 102
- Krasnopolsky & Königl (2002) Krasnopolsky, R., & Königl, A. 2002, ApJ, 580, 987
- Konigl & Pudritz (2000) Konigl, A., & Pudritz, R. E. 2000, Protostars and Planets IV, 759
- Lee (2010) Lee, C.-F. 2010, ApJ, 725, 712
- Lee (2011) Lee, C.-F. 2011, ApJ, 741, 62
- Lee et al. (2009) Lee, C.-F., Hirano, N., Palau, A., et al. 2009, ApJ, 699, 1584
- Lee et al. (2000) Lee, C.-F., Mundy, L.G., Reipurth, B., Ostriker, E.C., & Stone, J.M. 2000, ApJ, 542, 925
- Lee et al. (2001) Lee, C.-F., Stone, J. M., Ostriker, E. C., & Mundy, L. G. 2001, ApJ, 557, 429
- Lee et al. (2006) Lee, C.-F., Ho, P. T. P., Beuther, H., Bourke, T. L., Zhang, Q., Hirano, N., & Shang, H. 2006, ApJ, 639, 292
- Lee et al. (2007) Lee, C.-F., Ho, P. T. P., Hirano, N., Beuther, H., Bourke, T. L., Shang, H., & Zhang, Q. 2007, ApJ, 659, 499
- Lee et al. (2008) Lee, C.-F., Ho, P. T. P., Bourke, T. L., et al. 2008, ApJ, 685, 1026
- Li et al. (2013) Li, Z.-Y., Krasnopolsky, R., & Shang, H. 2013, ApJ, 774, 82
- McCaughrean et al. (2002) McCaughrean, M., Zinnecker, H., Andersen, M., Meeus, G., & Lodieu, N. 2002, The Messenger, 109, 28
- Mellon & Li (2008) Mellon, R. R., & Li, Z.-Y. 2008, ApJ, 681, 1356
- Murillo et al. (2013) Murillo, N. M., Lai, S.-P., Bruderer, S., Harsono, D., & van Dishoeck, E. F. 2013, A&A, 560, A103
- Nakamura (2000) Nakamura, F. 2000, ApJ, 543, 291
- Ohashi et al. (1997) Ohashi, N., Hayashi, M., Ho, P. T. P., & Momose, M. 1997, ApJ, 475, 211
- Raga et al. (1990) Raga, A. C., Binette, L., Canto, J., & Calvet, N. 1990, ApJ, 364, 601
- Rawlings et al. (2004) Rawlings, J. M. C., Redman, M. P., Keto, E., & Williams, D. A. 2004, MNRAS, 351, 1054
- Rawlings et al. (2013) Rawlings, J. M. C., Redman, M. P., & Carolan, P. B. 2013, MNRAS, 435, 289
- Sakai et al. (2014) Sakai, N., Sakai, T., Hirota, T., et al. 2014, Nature, 507, 78
- Shu et al. (2000) Shu, F. H., Najita, J. R., Shang, H., & Li, Z.-Y. 2000, Protostars and Planets IV, 789
- Simon et al. (2000) Simon, M., Dutrey, A., & Guilloteau, S. 2000, ApJ, 545, 1034
- Suttner et al. (1997) Suttner, G., Smith, M. D., Yorke, H. W. & Zinnecker, H. 1997, A&A, 318, 595
- Terebey et al. (1984) Terebey, S., Shu, F. H., & Cassen, P. 1984, ApJ, 286, 529
- Tobin et al. (2012) Tobin, J. J., Hartmann, L., Chiang, H.-F., et al. 2012, Nature, 492, 83
- Ulrich (1976) Ulrich, R. K. 1976, ApJ, 210, 377
- Viti, Natarajan, & Williams (2002) Viti, S., Natarajan, S., & Williams, D. A. 2002, MNRAS, 336, 797
- Zinnecker, McCaughrean, & Rayner (1998) Zinnecker, H., McCaughrean, M. J. & Rayner, J. T. 1998, Nature, 394, 862
- Zinnecker et al. (1992) Zinnecker, H. , Bastien, P. , Arcoragi, J. -P. & Yorke, H. W. 1992, A&A, 265, 726