The HiSCORE concept for gamma-ray and cosmic-ray astrophysics beyond 10 TeV
Abstract
Air-shower measurements in the primary energy range beyond 10 TeV can be used to address important questions of astroparticle and particle physics. The most prominent among these questions are the search for the origin of charged Galactic cosmic rays and the so-far little understood transition from Galactic to extra-galactic cosmic rays. A very promising avenue towards answering these fundamental questions is the construction of an air-shower detector with sufficient sensitivity for gamma-rays to identify the accelerators and large exposure to achieve accurate spectroscopy of local cosmic rays. With the new ground-based large-area (up to 100 km2) wide-angle (0.6–0.85 sr) air-shower detector concept HiSCORE (Hundred*i Square-km Cosmic ORigin Explorer), we aim at exploring the cosmic ray and gamma-ray sky (accelerator-sky) in the energy range from few 10s of TeV to 1 EeV using the non-imaging air-Cherenkov detection technique. The full detector simulation is presented here. The resulting sensitivity of a HiSCORE-type detector to gamma-rays will extend the energy range so far accessed by other experiments beyond energies of 50 –100 TeV, thereby opening up the ultra high energy gamma-ray (UHE gamma-rays, E10 TeV) observation window.
keywords:
cosmic rays , gamma-rays , instrumentation , air Cherenkov astronomy , pevatrons1 Introduction
The current knowledge about the origin of cosmic rays has been accumulated following two different approaches: (i) by measuring in detail the energy spectrum and mass composition of the local cosmic-ray population and (ii) by gamma-ray ( MeV) observations of both individual astrophysical objects as well as the diffuse emission from the interstellar medium. Both approaches provide complementary information/constraints on the most relevant quantities: e.g. the measurement of spallation products and cosmo-genic nuclei provides information on the energy dependence of cosmic-ray transport and the escape time of cosmic rays out of the Galaxy. Gamma-ray observations constrain the spatial distribution and properties of the cosmic ray accelerators and the density of cosmic rays in the interstellar medium.
Cosmic-ray measurements through air-shower techniques are the only means to collect sufficient event statistics to measure cosmic rays at energies close to the knee (eV) in the all-particle energy spectrum. The traditional air-shower detectors sample the lateral density function (LDF) of secondary particles or photons on the ground. Given the large intrinsic fluctuations in the shower development and that only a small fraction of the particles are sampled (), the energy resolution and sensitivity to different primary particles is rather limited. Combining detection of different components of the air shower as e.g. realised in the KASCADE air shower field [1], improves the situation considerably but suffers from limited collection area. Established techniques to follow the longitudinal air shower development include muon tracking, air Cherenkov, and air fluorescence observations.
The latter technique has been realised quite early and remains one of the most sensitive techniques at ultra-high energies [Linsley, Fly’s eye, HiRes, Pierre-Auger Observatory, Telescope-Array, see 2, and references therein]. The non-imaging air Cherenkov technique measures the arrival time and the LDF of the Cherenkov photons in the air shower front. This technique is sensitive to the longitudinal air shower development (mainly position of the shower maximum) as demonstrated with e.g. Themistocle [3], AIROBICC [4], Blanca [5], Tunka [6], Jakutsk [7]. The longitudinal air shower development is sensitive to the initial particle species. Both techniques allow a comparably good energy resolution which suffers less from the fluctuations and the limited sampling. A number of new approaches for air shower detection have been proposed and partially tested including long-wavelength (MHz) radio measurements111the dominant emission processes are geo-synchrotron and charge separation [see e.g. 8], and molecular Bremsstrahlung emission at GHz frequencies [9, 10]. In the sense of shower-front sampling, the long-wavelength radio observations are comparable to the air Cherenkov technique while the molecular Bremsstrahlung has analogies to the air fluorescence (mostly isotropic emission) and would allow for imaging of the air shower development.
For approach (i) – spectroscopy and measurement of chemical composition of cosmic rays in the energy range from below the knee to the ankle ( eV) – the air Cherenkov approach appears to be among the best choices, considering its good energy resolution of the order of 10 %, and a typical resolution of the shower maximum of the order of 30 g/cm2 [6]. See also Section 3.3. For approach (ii) – gamma-ray observations – the currently most succesfull technique is the imaging air Cherenkov technique with multiple telescopes (imaging air Cherenkov telescopes: IACTs). A large array of IACTs is currently under design to achieve a ten-fold improvement in flux sensitivity as compared to current generation instruments: the Cherenkov Telescope Array [CTA, see 11]. Nevertheless CTA is designed to achieve optimum sensitivity at TeV energies and will suffer from its limited collection area at energies beyond 100 TeV. The non-imaging air Cherenkov technique allows to extend the collection area to several square kilometers with a moderate number of read-out channels222there are complementary approaches using large field of view cameras which would allow to increase the spacing of individual telescopes [12]. In combination with the demonstrated good angular resolution in non-imaging Cherenkov air shower arrays, a multi-km2 array with good sensitivity above 10 TeV appears feasible and is explored here.
With the Hundred*i Square-km Cosmic ORigin Explorer HiSCORE, we want to cover both approaches (i) and (ii) described above. A central question will be the search for the elusive pevatrons [13], the accelerators of cosmic rays up to the PeV energy regime. For more details on physics topics for HiSCORE, see [14] and references therein.
2 HiSCORE detector design
2.1 Detector array layout
HiSCORE will consist of an array of wide-angle light-sensitive detector stations, distributed over an area of the order of 100 km2. As compared to previous experiments, important aspects of HiSCORE are different (see Table 1): an instrumented area larger by more than an order of magnitude, up to a factor 16 larger light-collecting area per station, and the usage of fast GHz waveform sampling electronics.
| Parameter: | |||||
| Unit | |||||
| HiSCORE | 100 | 0.5 | 0.60–0.85 | 150a | 4489 |
| Tunka-133 | 1b | 0.031 | 1.8 | 85 | 133 |
| Blanca | 0.2 | 0.1 | 0.12 | 35 | 144 |
| AIROBICC | 0.04 | 0.13 | 1 | 15–30 | 49 |
| Themistocle | 0.08 | 0.5 | 0.008 | 50–100 | 18 |
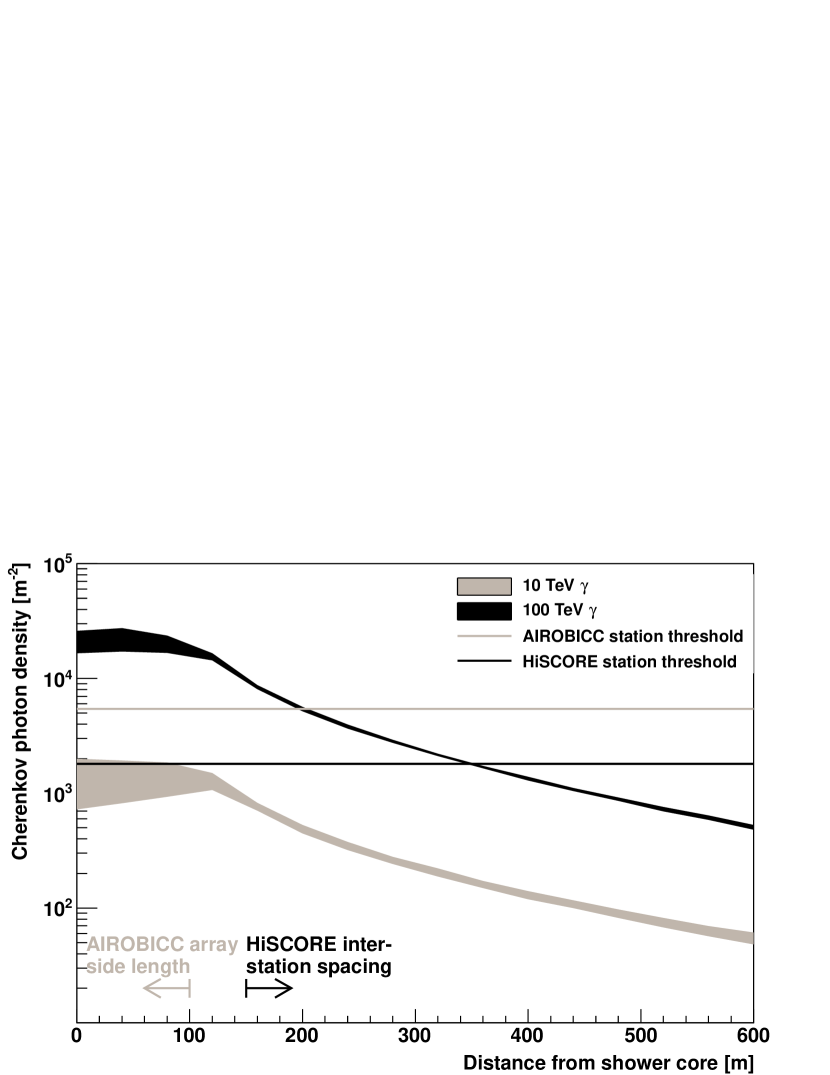
Since we aim at a very large instrumented area, a low array density with large inter-station spacings is favoured. Figure 1 shows the lateral photon density function (LDF) of Cherenkov light on the ground. Within a radius of 120 m around the shower core position, the LDF is roughly constant. Beyond 120 m, the photon density decreases following a power law. With a station spacing of 100 m or more (depending on the array layout and partly variable), HiSCORE will primarily measure the outer part of the LDF, i.e. most stations will sample the LDF beyond 120 m distance from the shower core. Still, a few stations will lie within the central 120 m of the lightpool. Due to the low Cherenkov photon density far away from the shower core, a large light collection area of the individual detector stations is needed. With the standard array configuration and a chosen area m2, on average 3 stations within 120 m of the shower core are found to be above threshold for showers at 50 TeV primary energy. The energy threshold for gamma-rays at reconstruction level therefore is 50 TeV. When using alternative layouts with partly higher station densities or larger PMTs (see section 4), the energy threshold at reconstruction level can be reduced towards our aim of 10 TeV. At 100 TeV, the LDF can be sampled in the power law part up to core distances of 450 m. In Figure 1, the basic difference in scale becomes apparent: The inter-station spacing of the HiSCORE array is of the same order of magnitude as the total side-length of the AIROBICC detector.
2.2 Detector station
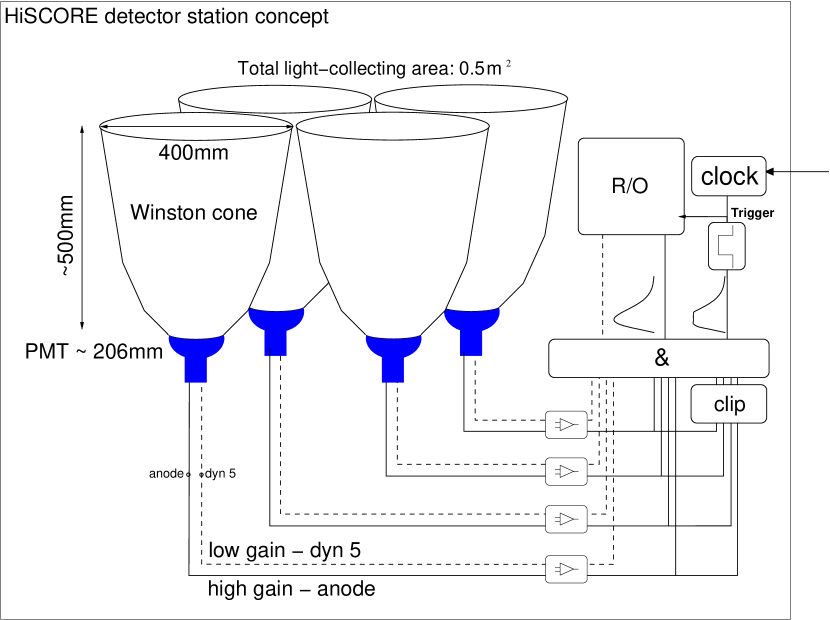
A HiSCORE detector station consists of four photomultiplier tubes (PMTs), each equipped with a light-collecting Winston cone of 30∘ half-opening angle pointing to the zenith. The advantages of using four PMT channels per station are on the one hand the suppression of random triggers from nightsky background (NSB) light through a local coincidence trigger condition, and on the other hand an increase of the light collecting station area (). When using four 8” PMTs and a height of 0.5 m of the Winston cones is achieved. A schematical view of the station concept is given in Figure 2.
The PMTs have to fulfill two basic requirements: The operational gain must be such that the anode current stays within manufacturer limits under the expected NSB conditions. With a nominal gain of 104, the 6-stage PMT KB9352 from Electron Tubes fulfills this requirement. A modified R 5912 Hamamatsu PMT with six dynodes is an interesting alternative. The dynamic range has to be as high as 105, since we aim at measurements between 10 TeV and 1 EeV. This could be achieved by reading out one or two dynodes in addition to the anode signal. Assuming a voltage range of the readout of 14 mV to 1 V (e.g. DRS4 evaluation board, [15]), the anode (high gain, first readout stage) channel provides a dynamic range of 70. At the upper end of this voltage range, the actual anode signal is 100 mV (when using a premplification of a factor 10), i.e. well within the linear anode voltage range which extends up to roughly 2 V. With a dynode (low gain, second readout stage) channel at a factor 50 lower amplification, sufficient overlap between both channels is given. The total dynamic range then is 3500. An additional, second dynode readout would provide a further extension of the dynamic range up to 105. Alternatively, without a third readout stage, events at the highest energies could also be reconstructed using stations far away from the shower core, and applying appropriate low weights for the inner (saturated) stations. While such methods of increasing the dynamic range are feasible, they will require careful calibration and will ultimately be a source of systematic errors towards the high energy end of the sensitive detector range.
The Winston cones can be conveniently built from segments of reflective aluminum layer on a synthetic, flexible carrier material (Alanod 4300UP). Ten segments are cut out from this material and assembled similarly to a barrel. The Winston cone shape is well reproduced along the optical axis.
The inside of the station box is equipped with slow-control electronics, a lid motor, high-voltage (HV) systems, a local station trigger, and a read-out system (pre-amplifiers, analog signal sampling board). A fast signal read-out and digitization in the GHz regime is provided by a read-out board with up to 8 channels based on the DRS 4 chip [15], with a depth of 1024 cells at a resolution of up to 0.2 ns per cell (5 GHz). In order to retain a sufficiently wide read-out window, a sampling frequency of 1 GHz is used corresponding to a read-out window of 1 s.
For a large array such as HiSCORE, with large inter-station spacings, accurate relative timing is crucial. Simulations show that a relative timing accuracy between stations of the order of 1 ns is required to optimize the angular resolution as well as the reconstruction accuracy of the position of shower maximum. Systems for relative synchronisation at the (sub)-ns accuracy level are currently under study. Possible approaches are WhiteRabbit (PTP over synchronuous ethernet [16]), with sub-ns resolution reached in the HiSCORE prototype [17, 18, 19], or a system based on the ethernet carrier frequency such as used by the Tunka-133 array [20], or radio signal phase synchronisation [21].
2.3 Trigger and read-out
The station trigger is illustrated in Figure 3 (also see Figure 2). The analog PMT signals are clipped to a pre-defined amplitude level and then summed. The clipped sum then passes a discriminator set to a threshold level , with . The exact value of the ratio is a free parameter. In the simulation presented here, this ratio was set to 3.8. A local station trigger is issued when the time-over-threshold of the clipped sum is larger than . The clipped sum trigger prevents false triggers from large signal fluctuations in individual PMTs, therewith suppressing afterpulses, NSB photons, and triggers from uncorrelated cosmic-ray muons (see also Section 3.2), allowing a lower station trigger threshold. The value of depends upon the choice of the discriminator. Here, = 7 ns was used.

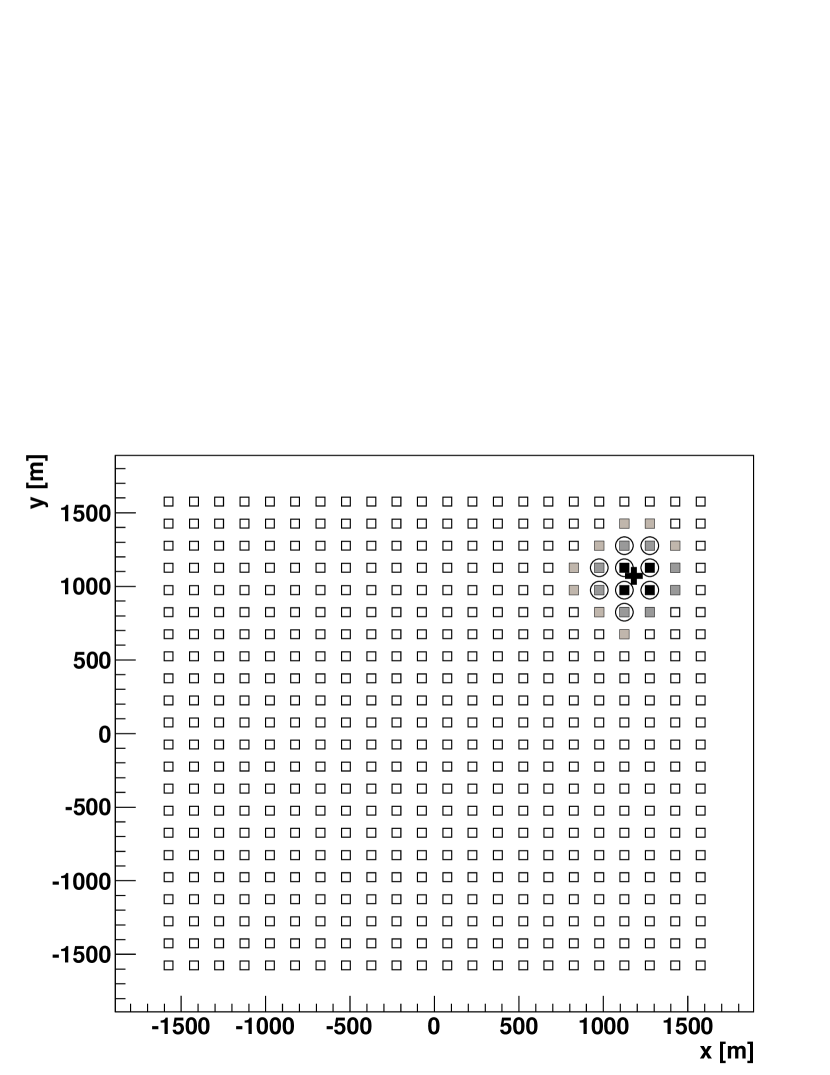
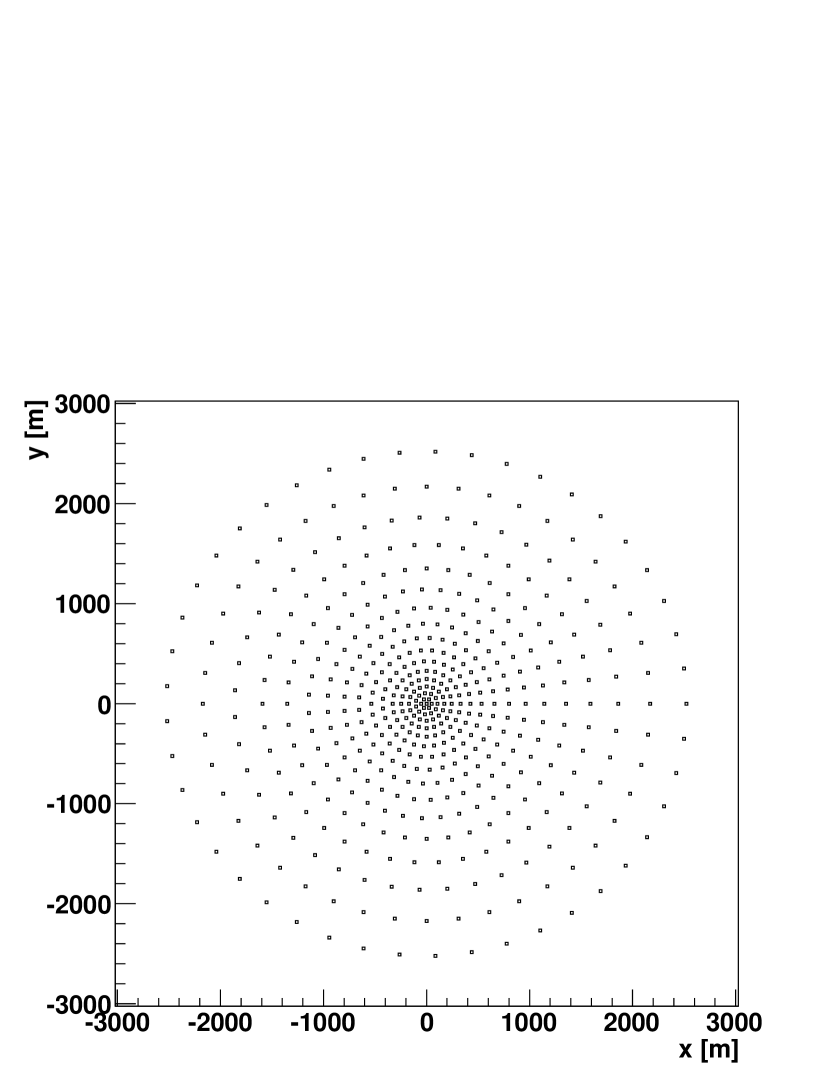
At each local station trigger, the data are read out and sent to a central PC farm. Additionally, all neighbouring stations which have not issued a trigger are read out as well. In the simulated array setup (150 m grid constant), a typical gamma-ray event with 200 TeV primary energy triggers of the order of 10 stations. A distribution of photon counts in the simulated array is shown in Figure 4 for a simulated gamma-ray event at 187 TeV. Stations that issue a local trigger in the simulation are additionally marked with a grey circle.
3 HiSCORE simulation results
3.1 Simulation of air showers and detector response
Simulation software
Air showers were simulated with CORSIKAv675 [22] using the hadronic interaction models QGSJET01c.f [23], and GHEISHA [24], and the electromagnetic interaction model EGS4. The systematic error on the background estimation is due to the limited accuracy of hadronic interaction models, and to the lack of precise knowledge of the chemical composition of hadrons. While the former will be improved with models modified on the basis of LHC data [25], the latter is one result to be deduced from HiSCORE data in the future. Gamma rays, protons, helium- nitrogen- and iron-nuclei were simulated in the energy range from 10 TeV to 5 PeV following a power law distribution resulting in equal numbers of events per decade. Additionally, protons from 5 TeV to 10 TeV were simulated for the estimation of the detector trigger rate (see section 3.2). Due to our focus to high energies, we require a large Cherenkov light pool. Thus, the detector array was simulated at an altitude of 0 m above sea-level. Simulations at higher altitudes show that a benefit at low energies is only achieved when using a smaller inter-station spacing, and thus a smaller overall instrumented area [26]. Within CORSIKA, the IACT option [27] was used, storing Cherenkov photons in spheres of 1 m radius at sea-level, each sphere representing one detector station. Different geometrical array layouts were simulated. The standard array layout consists of 484 stations distributed over a regular square grid as shown in Figure 4. The standard array covers a total instrumented area of roughly 10 km2 (3.15 km side length). Each station in the standard configuration was simulated based on 8” PMTs as described above. Air showers were simulated with uniformly distributed impact position in a square with side length 3.8 km, corresponding to a simulated area of 14.44 km2. The directions were simulated randomly with a uniform density in solid angle up to a zenith angle of 30∘.
A full detector simulation (sim_score) was implemented on the basis of the IACT package [27]. At the position of each CORSIKA sphere, a detector station with 4 PMT-channels is simulated in sim_score. In detail, sim_score comprises the following elements:
-
1.
Winston cone acceptance tables based on ray-tracing simulations [28].
-
2.
Atmospheric scattering of the Cherenkov photons is calculated using MODTRAN [29].
-
3.
PMT quantum efficiency (wave-length dependent) as in ElectronTubes data sheet for KB9352 (29 % at maximum).
-
4.
Overall PMT photoelectron collection efficiency of 90 %.
- 5.
-
6.
Station trigger: the clipped sum station trigger as in Figure 3.
-
7.
The NSB photon baseline is simulated separately and added to the signals at read-out level (pulse shaping and afterpulses are included in this simulation).
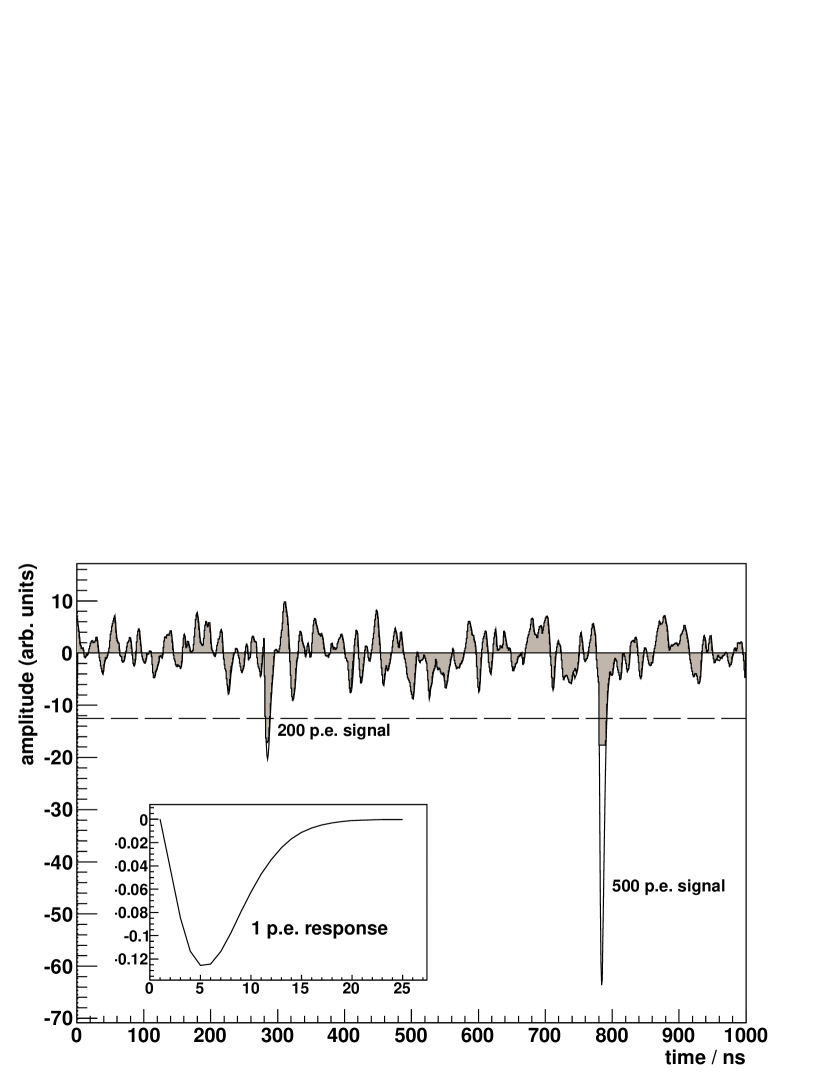
An interval of 2 s of NSB noise is simulated as an array of photons uniformly distributed over time, and corresponding to a constant flux of photons/(m2 sr s). An average quantum efficiency for NSB photons of 0.1 (calculated using the wavelength dependent quantum efficiency of the PMTs and a spectrum for NSB photons), and a constant photo electron conversion efficiency of 0.9 were used. Each photo electron is stored in a read-out array (each array element corresponding to a 1 ns DRS 4 cell), according to the shape and amplitude response described above. A 1 s interval of simulated NSB noise after subtraction of the average baseline is shown in Figure 5, along with two signals corresponding to 200 and 500 photoelectrons (p.e). The results presented in this paper were obtained using a clipped sum threshold corresponding to 180 p.e (, see Figure 3).
3.2 Trigger rates
The relevant contributions to the trigger rate are night-sky background (NSB) photons, and cosmic rays. In the following paragraphs, we present estimations of these rates, and show that the flux of uncorrelated atmospheric muons does not contribute.
Hadron trigger rates
The differential trigger rate of an array can be calculated in the following way:
| (1) |
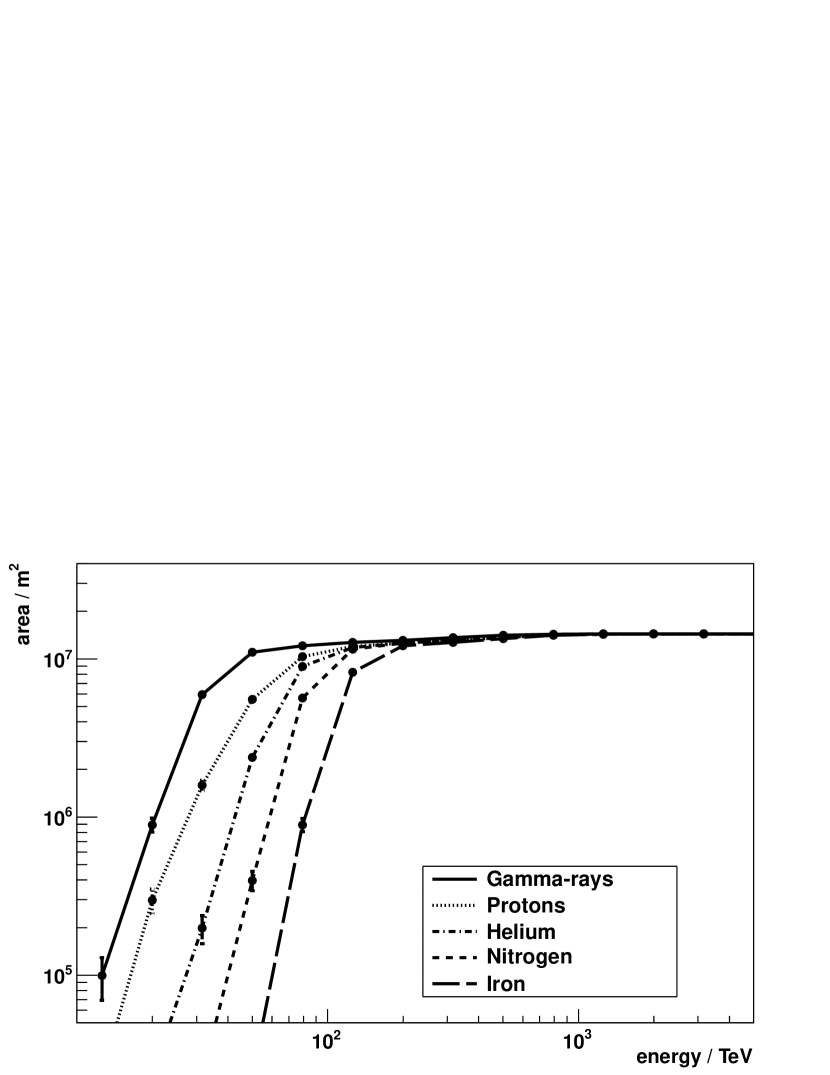
where the sum runs over the individual cosmic-ray fluxes of the elements as provided by Hörandel [31] and the effective areas for cosmic ray nuclei have been derived for representative elements: Helium for the light (L: Z=2-5), Nitrogen for the medium (M: Z=6-24), and iron for the heavy (H: Z24) groups. The effective area is given as the ratio of triggered to simulated events multiplied by the simulated area. The effective area depends in principle on the zenith angle as well as on the azimuth angle . The simulations show however, that up to , the effective area does not vary strongly which justifies a simplified treatment: the effective area is assumed to be constant over and the effective solid angle within the constant region () is sr. In Figure 6, is given for gamma-rays and the 4 hadronic particle types (H, He, N, Fe - corresponding to protons, light, medium and heavy groups), requiring only one station to trigger at a single station threshold of 180 p.e. and using the trigger scheme described in Figure 3.
A parametrization of the cosmic ray spectrum [31] is weighted with the corresponding effective areas to calculate the expected trigger rates for hadronic cosmic ray events. The resulting trigger rate as a function of energy for an individual HiSCORE station is shown in Figure 7.
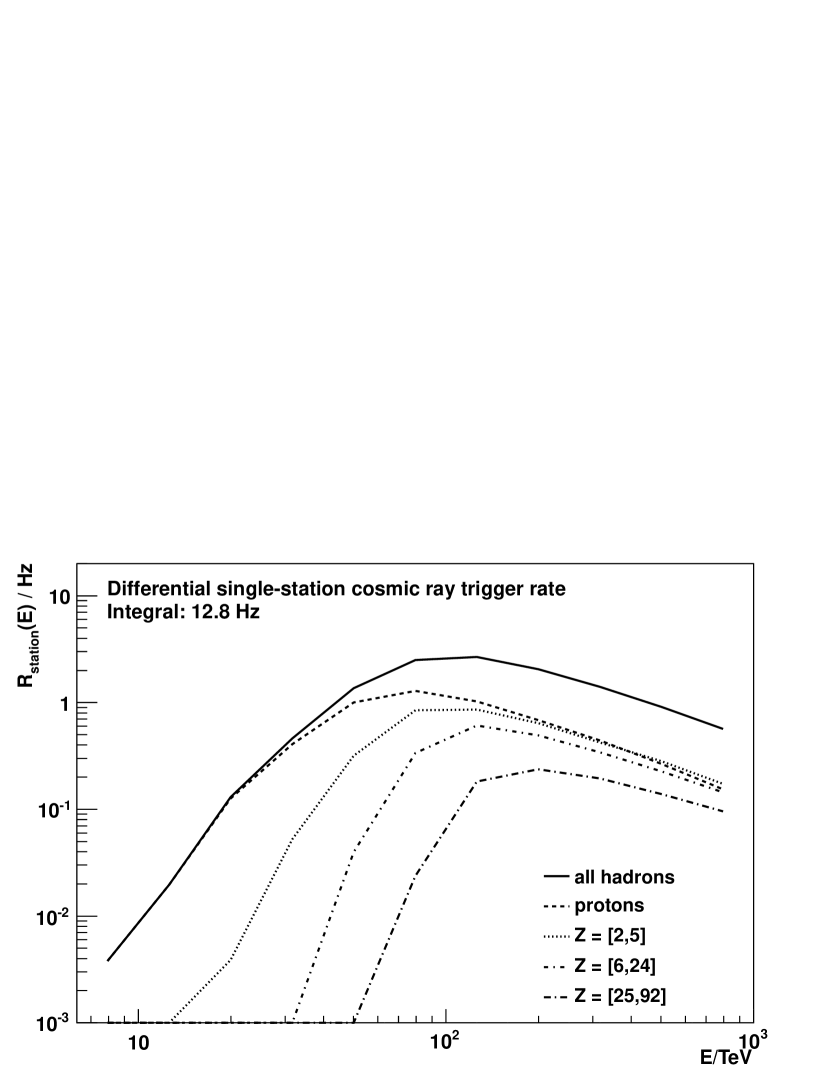
The integral single-station local trigger rate is found to be 12.8 Hz. The hadron trigger rate of the full 10 km2-array of 484 stations is 1.77 kHz (p: 875 Hz, L: 505 Hz, M: 290 Hz, H: 100 Hz).
Night-sky background trigger rates
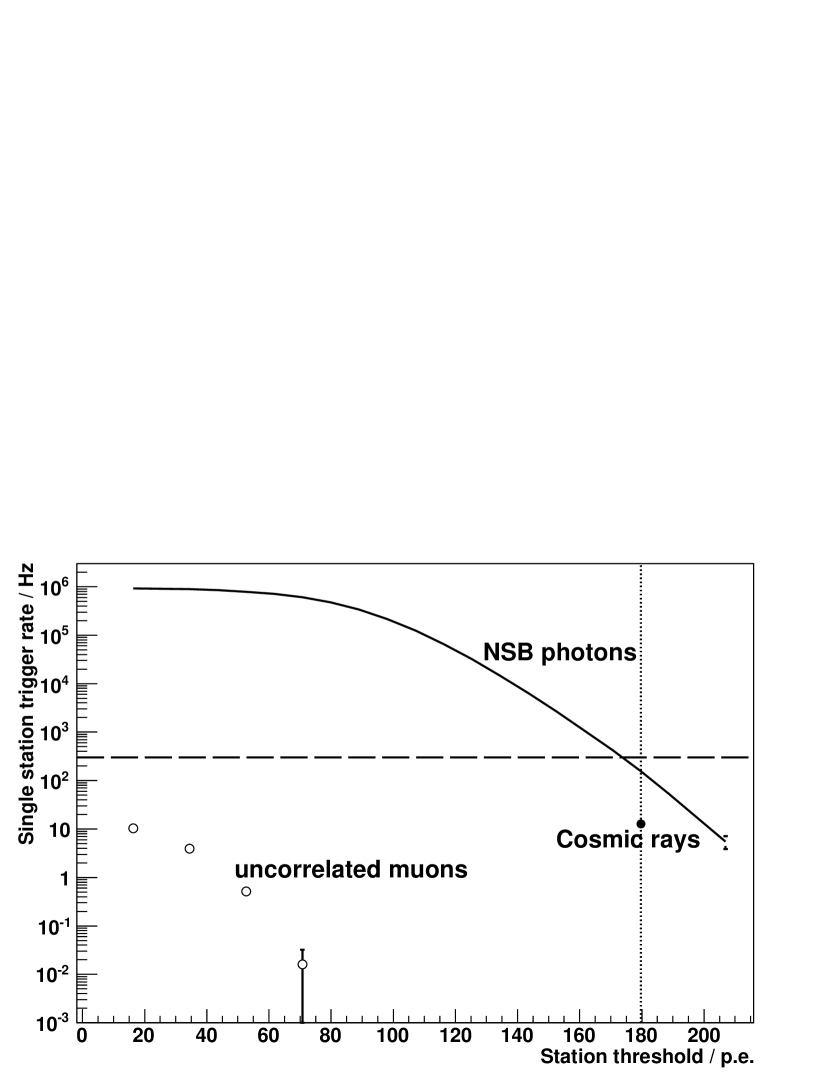
The night-sky background (NSB) is induced by light sources outside of the atmosphere including direct and scattered starlight, scattered moon light, zodiacal light and light produced within the atmosphere including air glow and human-made light sources. The expected trigger rate induced by NSB photons was simulated using a dedicated simulation of a full 4-channel station including the pulse shaping and trigger scheme. Measurements of the NSB level at Fowlers gap in Australia [32] were used as input for these simulations. An NSB-induced single-station local trigger rate of 100 Hz was found at a clipped sum threshold of 180 p.e., demonstrating that the single-station trigger rate is clearly dominated by NSB photons (see Figure 8). A reduction of the data flow could be achieved when also using a second trigger level, requiring coincident (s-window) triggers of 2 neighbouring stations. This could be realized on software level and is not necessary on hardware level as long as the total data flow from single-station triggers can be handled (e.g. using a central PC farm). Alternatively, slightly increasing the station discriminator threshold to 190 p.e. results in an NSB trigger rate of 50 Hz without significantly affecting the sensitivity, and only raising the energy threshold (linearly) by 5 %.
Uncorrelated cosmic ray muon trigger rate
The overall flux of vertical incidence atmospheric muons measured at sea level is 160 particles m-2s-1 [33]. Taking into account the detector properties, the total average signal from one muon in one station is of the order of 100 p.e. The trigger rate for uncorrelated muons as shown in Fig. 8 was calculated with the full simulation chain (CORSIKA & sim_score), using different clipped sum thresholds. As can be seen from Figure 8, the muon trigger rate is found to be negligible in comparison with the rate of NSB photon induced triggers. The rate was calculated for a trigger setup with a clipped sum threshold of 180 p.e. and ns.
3.3 Air shower reconstruction
Air shower reconstruction algorithms for HiSCORE were introduced in [34, 28]. The arrival direction is reconstructed using an analytical model for the arrival time of Cherenkov photons at the detector stations. The primary particle energy is reconstructed from the light density value at a fixed distance from the shower core, as reconstructed from the lateral density function of a shower event. As shown in [34], the standard array configuration achieves an angular resolution of 0.25∘ at 100 TeV and 0.1∘ at 1 PeV. The achieved energy resolution is 20 % at 100 TeV, improving to better than 10 % at 1 PeV. The resolution of the height of the shower maximum is 70 g/cm2 at 50 TeV and reaches 40 g/cm2 at 1 PeV. These numbers, even though obtained with very basic reconstruction algorithms, are comparable to the energy and shower maximum resolutions of the Tunka-133 array (15 % energy-, and 25 g/cm2 shower maximum resolution at higher energies) [6]. Primary particle identification is done on the basis of the reconstructed energy and shower height. At the energy threshold and up to 100 TeV, the gamma-hadron separation is inefficient (quality factor of 1.0). Beyond 100 TeV, the quality factor gradually improves to 2.0 at 1 PeV. A comprehensive discussion can be found in [28]. The quality of spectroscopic measurements of the all-particle cosmic ray spectrum will depend on the energy resolution and the total effective area of the instrument. At 10 % energy resolution and an instrumented area of 100 km2, HiSCORE will allow a high accuracy for spectroscopic reconstruction of cosmic rays around the knee region and beyond.
3.4 Sensitivity to gamma-rays
The point-source survey sensitivity (for a definition see below) to gamma-rays was calculated on the basis of the simulation and reconstruction described above.
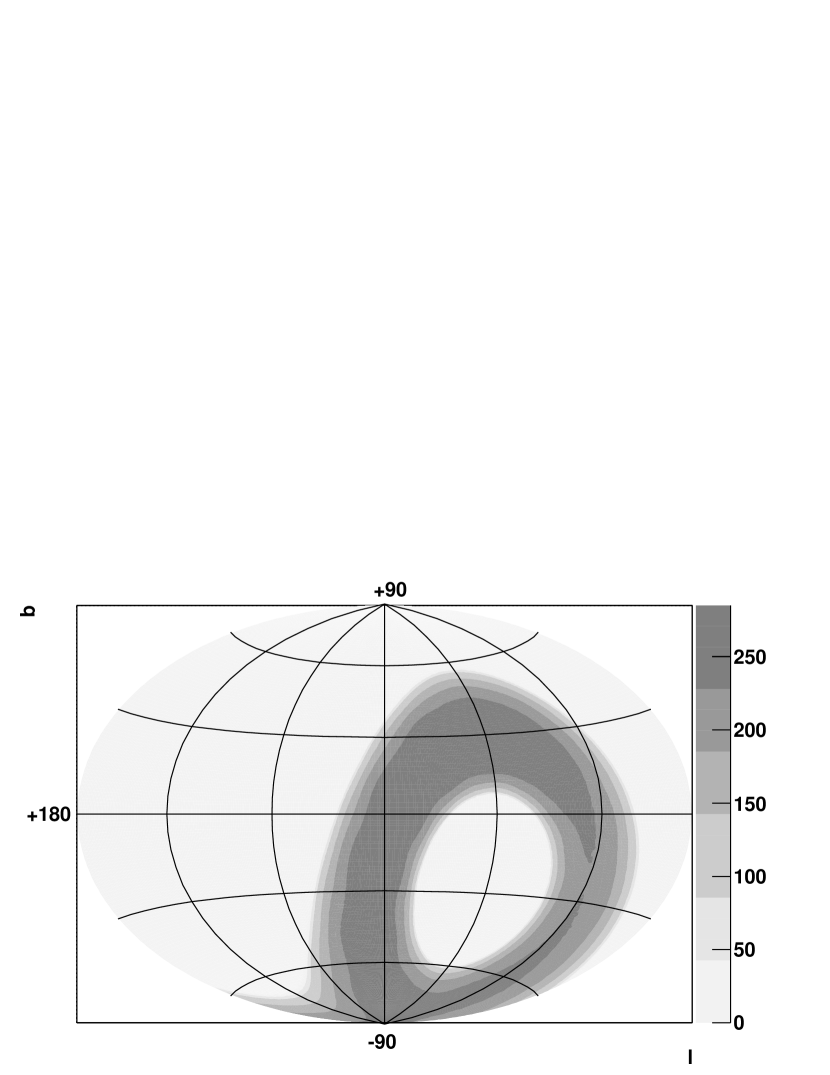
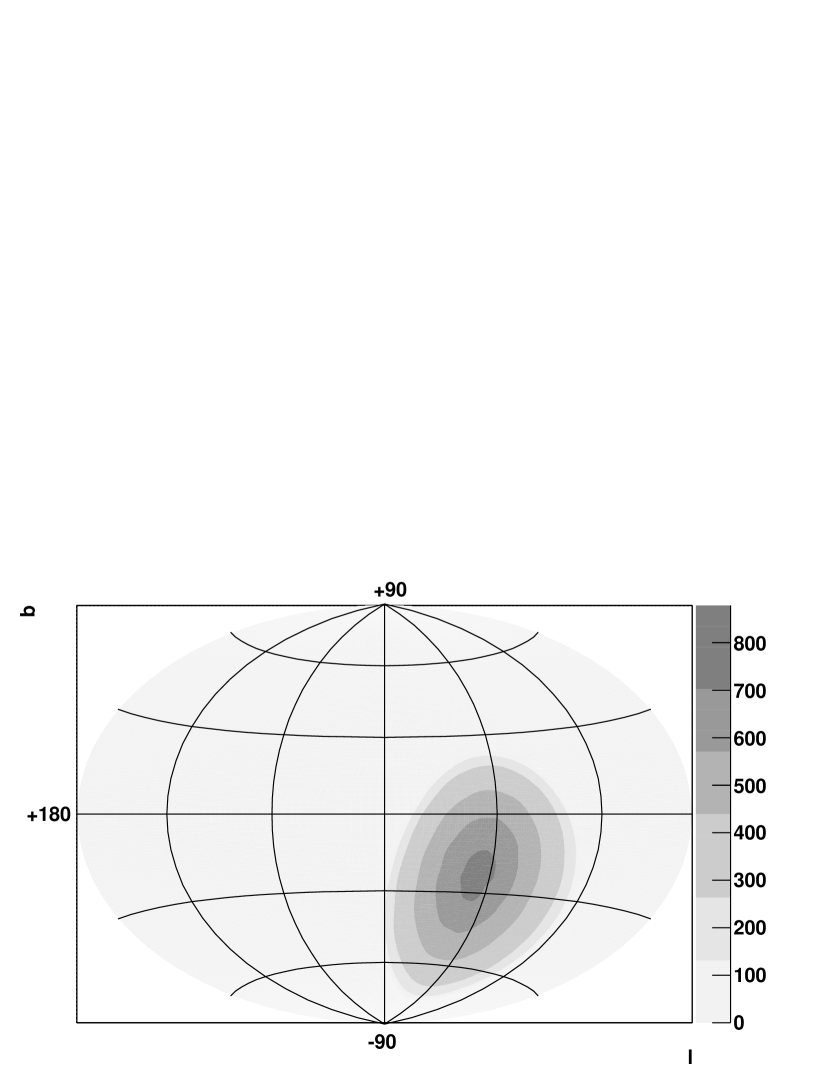
HiSCORE always operates in survey mode, i.e. all objects which are visible during darkness time within the visible cone of the instrument are observed. In the standard observation mode, the optical axis of the detector stations points to the zenith. The observation time for any given position in the sky was calculated for an observation site at 31∘ southern geographical latitude. The accumulated exposure time for a celestial position is derived using an acceptance cut taking into account only events within 25∘ half opening angle [26]. While the region of the sky covered is restricted by the detector site, the large effective field of view of 0.6 sr leads to a total sky coverage of sr in one year at an exposure depth ranging from 200 h to 283 h, as illustrated in Figure 9.
For comparison, the first survey of the inner Galaxy with H.E.S.S. covered a total solid angle of the order of 0.1 sr at an exposure level of the order of 10 h. The amount of survey time that can be allocated with a pointing instrument (IACT) depends on the time dedicated for deep exposure of individual objects, which might have precedence over a survey. The advantage of IACTs is their flexibility when determining the exact region to survey. The situation is different for HiSCORE. The region that is surveyed is defined by the region covered by the (fixed) instrument within a year. We plan to improve this situation using a reorientation of the detectors along their north-south axis (tilting), allowing to access different regions of the sky. This way, after a given operation time in standard observation mode (e.g. few years without tilting), the total sky coverage can be increased, by consecutively tilting the detector stations to the south (tilted south observation mode) and to the north for additional operation periods of a few years. For illustration, using a tilting angle of 30∘ towards the south (for a southern observation site), the sky covered is extended to the region shown in Figure 10, with a significantly deeper exposure per source within this region.
We used a total observation time of 1000 h, corresponding to 5 years of standard mode operation and roughly 1.4 years of tilted mode operation.
A minimum of 5 detection significance333The significance is calculated using eqn. 9 of [35] and 50 gamma-rays were required to define the flux sensitivity. The background numbers were calculated in an analogous way as described in Sect. 3.2 using however effective areas after quality cuts [34]. The resulting point-source sensitivity for 100 km2 instrumented area is shown in Figure 11. The dark shaded area shows the range of sensitivities achieved when using pessimistic (upper bound) and optimistic (lower bound) assumptions [also see 34]. The pessimistic bound was obtained by using a conservative alpha factor (ratio of solid angles of source to background measurements in Eq. 9 of Li and Ma [35]) of and an angular gamma-ray point source cut (the size of the source region around a test position) efficiency of 0.68. In the optimistic scenario, . Additionally, the gamma-ray efficiency of the point source cut was set to 1 in the background free regime, i.e. above 2.1 PeV. Also shown in Figure 11 are representative flux measurements from H.E.S.S. [36], ARGO-YBJ [37], Milagro [38], and an upper limit from KASCADE [1].
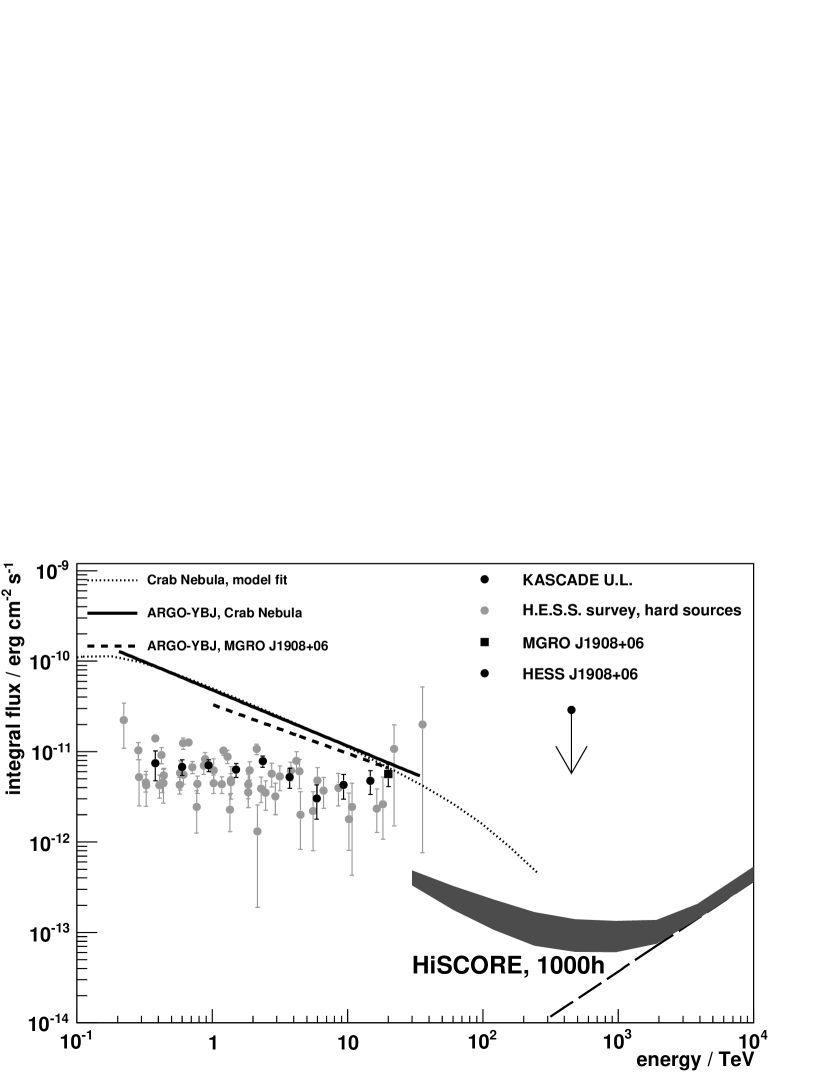
At the energy threshold, the sensitivity of HiSCORE is mainly limited by the angular resolution and secondarily by the gamma-hadron separation (See Section 3.3). At the upper energy end, the sensitivity is limited by count statistics and depends linearly on the inverse of the product of total detector area and the exposure time, forming the background free regime (straight black dashed line in Figure 11). In the central energy regime, the sensitivity is limited by the gamma-hadron separation. Here, we only show the sensitivity for the standard layout. Improvements of the angular resolution or to the gamma-hadron separation (large PMTs, graded array, muon detectors, see Section 4) are not included. Such detector enhancements will cause the background free regime to extend to lower energies, effectively pushing down the sensitivity curve toward the straight black dashed line. With HiSCORE, it will be possible to study the continuation of the spectra of known Galactic sources up to several 100 TeV. In this context, it will be important to investigate whether some of these sources could be cosmic ray pevatrons [13], [also see 14, 43].
A comparison of the senstivity of the HiSCORE standard configuration to point-source sensitivities of other gamma-ray experiments (CTA [11, 44], HAWC [45], and LHAASO [46, 47], the latter being valid for an exposure of one calendar year, and adapted to a minimum statistics requirement of 50 events) is shown in Figure 12. The sensitivity of IceCube for detecting a excess of neutrinos after 4.5 years of observation from stacked gamma-ray sources as explained in Gonzalez-Garcia et al. [48] is also included. Here, the underlying assumption is that the entire gamma-ray emission is of hadronic origin.
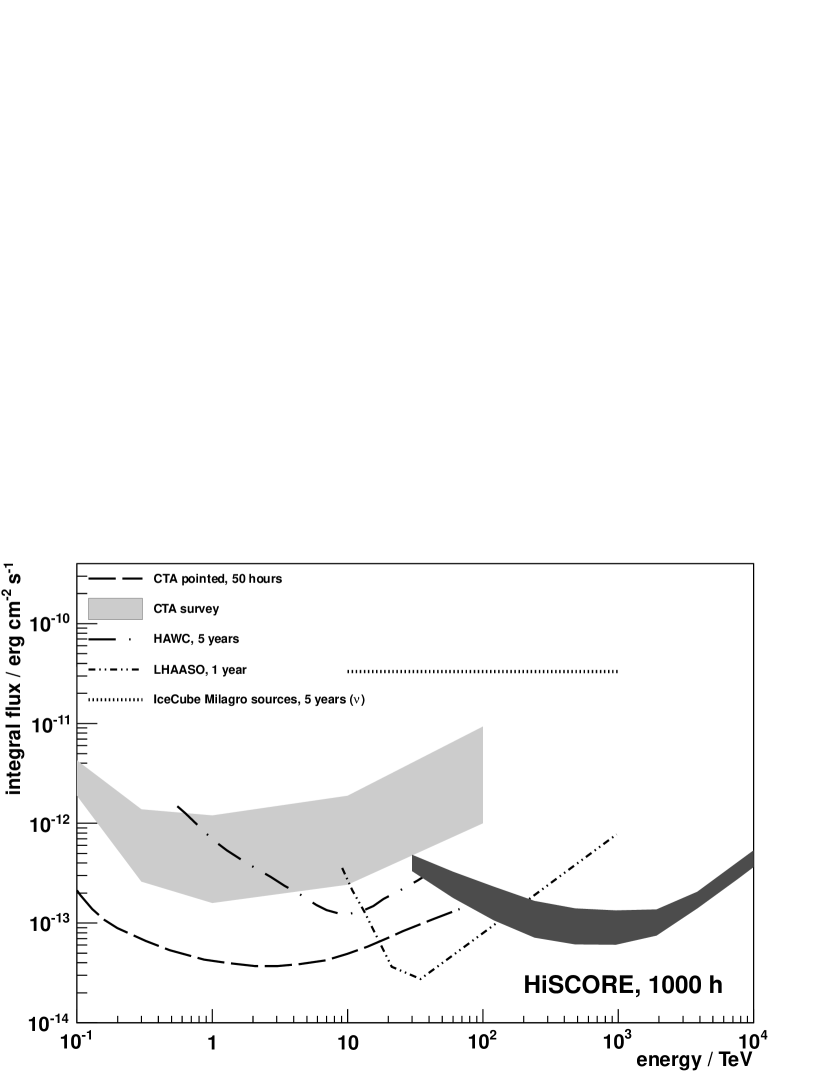
For comparison of sensitivities, it is important to note that the sensitivity shown for HiSCORE is the point-source survey sensitivity for sr of the sky. While the shown sensitivities for HAWC, LHAASO, and IceCube are also valid for surveys, the CTA sensitivity is given for pointed observations of 50 h in a small field of view of the order of sr (dashed line), for a survey of sr (upper bound of grey area) and a survey of the Galactic plane (lower bound of grey area). Furthermore, it has to be noted that the total observation time available per year to HiSCORE depends on the observation mode (see above).
4 Alternative array configurations
For comparison to the standard array geometry and station configuration presented above, two further configurations were tested using the same simulation framework.
Alternative configuration (a) – 12” PMTs
This configuration consists of a standard geometry array configuration equipped with 12” PMTs and correspondingly larger Winston cones, resulting in a 2.25-fold increase in light collection area per station. As can be expected, the usage of larger PMTs allows to detect lower Cherenkov photon densities on the ground, therewith lowering the energy threshold of the detector array for air showers, i.e. maximizing the effective area at low energies. For this array configuration, a higher individual station threshold (factor 1.5) was used to limit the expected data rate to a level comparable to the expected rate for the standard array.
Alternative configuration (b) – graded array
A circular graded array layout of 493 stations with a dense core and inter-station distances gradually decreasing towards the edge of the array is shown in Figure 13. At a comparable cost in number of stations, this layout results in improved effective areas at low energies (small inter-station distances in the array core) and at the same time optimizes the area at large energies due to the much larger area covered by the total array.
Performance of alternative arrays
The resulting effective gamma-ray trigger areas for these configurations are shown in Figure 14.
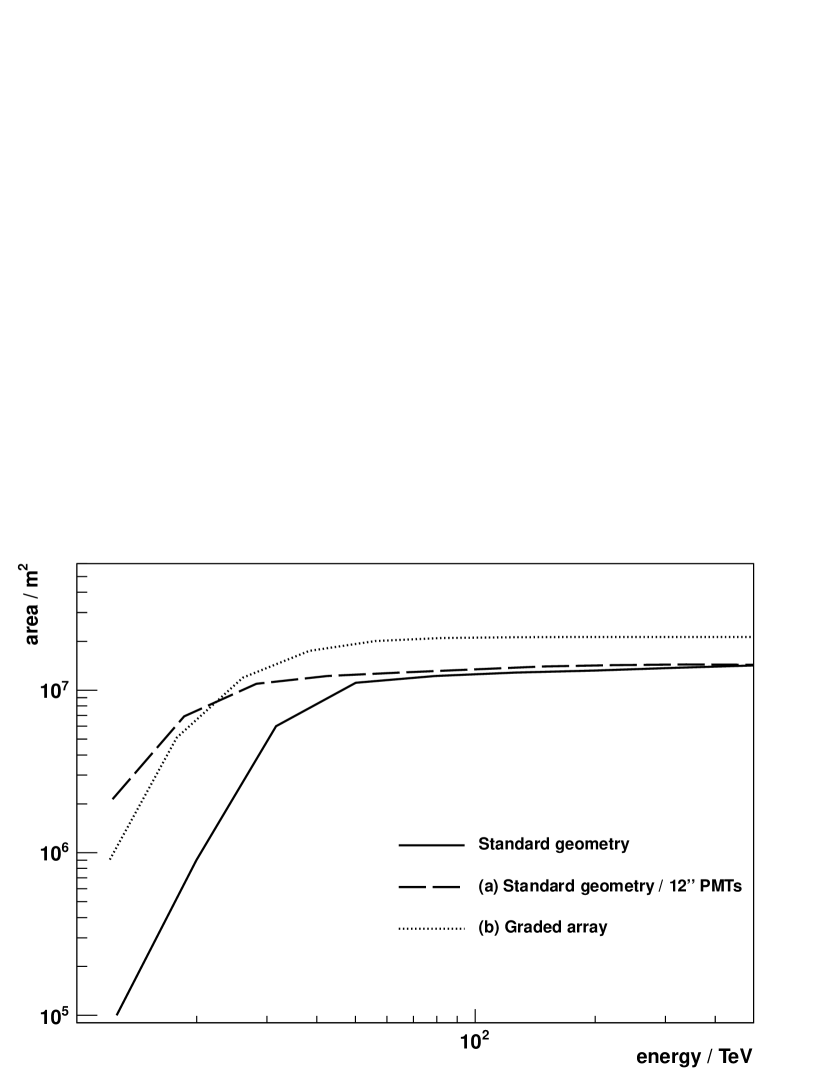
The described maximization of the effective area is clearly visible for configuration (a) at low energies and configuration (b) over the full energy range.
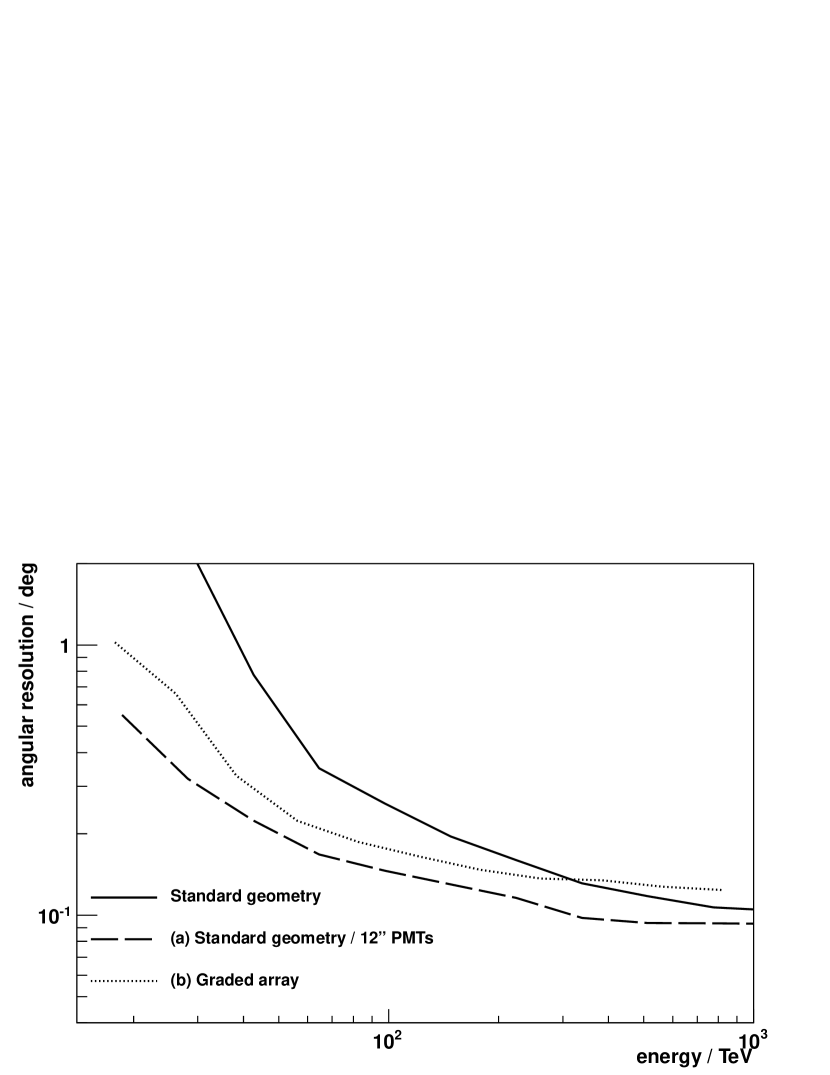
A comparison of the angular resolutions for both alternative configurations and the standard configuration is shown in Figure 15. Configuration (a) shows an improvement of the angular resolution primarily at low energies, where the larger light collecting area of the 12” PMT stations improves the signal to noise ratio in each station and, more importantly, increases the number of stations per shower event, the stations being more sensitive to low light levels, i.e. larger core distances (also see Figure 1). Towards high energies the latter advantage becomes less significant because the relative increase in number of stations is less strong for large shower events. The dense core of the graded array layout (b) also leads to a larger number of stations at lower energies (a larger number of stations being located inside the inner Cherenkov light pool, also see Figure 1), i.e. an improved angular resolution as compared to the standard configuration. However, at higher energies (E 330 TeV) a slight deterioration as compared to the standard configuration is seen. This can be explained by the fact that most events at higher energies are detected by the low-density part of the array, with fewer stations per shower event than in the standard configuration.
Adaptations of the reconstruction (especially gamma-hadron separation) to different detector configurations are work in progress and will be the subject of a future publication. Quite obviously, a combination of a graded array also equipped with large PMTs would further improve the performance as compared to configurations (a) and (b) alone. Here, we aim at showing the effect of both alterations to the standard layout separately, for clarity.
5 Outlook
More complex array layouts, such as combining partly large PMTs with a graded design or different variants of graded designs, are under study. Moreover, for a further improvement at low energies, a cell solution is envisaged in which the four individual PMT channels are separated by 5–10 m, building small sub-arrays (cells). Such cells could provide a better sampling of the central part of the LDF, and better reconstruction (thus sensitivity) at low energies (10 TeV to 100 TeV). Simulations have shown that a cell solution can lower the energy threshold (defined as the energy at which the effective area reaches 50 % of the instrumented area) considerably [26]. An extension of the concept we studied so far is to equip the underside of each sliding lid of the station boxes with scintillator material. With such a setup, continuation of data taking during daytime would allow to use HiSCORE as a very large charged particle shower front sampling array, effectively increasing the duty cycle by a factor of 9. Finally, we are also studying the benefits of a combination of the non-imaging technique simulated here with the imaging technique.
6 Summary
We have described the HiSCORE concept for a large-area wide-angle air shower experiment, based on an array of non imaging light collecting detector stations. A comprehensive simulation of the detector was performed including all relevant components (atmosphere, light-collection with Winston cones, photomultiplier, pulse shaping with afterpulses, station trigger). The resulting effective areas for various primary particles and the expected trigger rates for background have been calculated for different assumptions on the trigger threshold. The complete Monte Carlo simulation of the HiSCORE detector concept shows that such a non-imaging air-Cherenkov detector will be sufficiently sensitive to survey a large fraction () of the sky for gamma-ray sources above 10–50 TeV (depending on the final array layout) at an energy flux level of a few ergs/cm2s. This sensitivity is comparable to the planned next-generation Cherenkov telescope array (CTA) at lower energies, effectively extending the sensitive energy range into the UHE gamma-ray regime. Furthermore, HiSCORE will provide high-statistics measurements of cosmic ray spectra and composition above 100 TeV primary energy, covering the energy range of transition between Galactic and extragalactic origin of cosmic rays, and up to 1018 eV.
An engineering array with is planned for deployment 2014/2015, aiming at proof-of-principle measurements and first physics results.
Acknowledgements
We gratefully acknowledge valuable discussions on physics and hardware aspects with F. Aharonian, R. Antonini, N. Budnev, E. Lorenz, B.K. Lubsandorzhiev, R. Mirzoyan, G.P. Rowell, F. Schröder, T. Schweitzer, and M. Teshima. This research has made use of NASA’s Astrophysics Data System Bibliographic Services. We acknowledge the support of the Helmholtz Russia Joint Research Group (HRJRG-303). We acknowledge funding for the initiation of international cooperation (TL 51-3) by the Deutsche Forschungsgemeinschaft, DFG, and the Russian RFFI (13-02-12095). Furthermore, we acknowledge funding provided by the Helmholtz Gemeinschaft in the framework of the Helmholtz Alliance for Astroparticle Physics (HAP).
Appendix A Pulse shape parametrization
The single photo-electron response of a PMT is determined by the pulse shape as a function of time, and a probability distribution of the amplitude response including afterpulses. Here, we used a probability for a response amplitude at 4 p.e. of 10-4. The normalized pulse shape () used in this work was taken from Henke [30]. This shape was used to describe the response of AIROBICC, which was using the same PMT as envisaged for HiSCORE. The pulse shape is shown as inlay in Figure 5. It can be described as
| (2) |
where is a normalisation constant, , , , and the time t (in ns) is included in . The response function is a parametrization of the normalized, dimension-less single photo-electron response function. The parameters a, b, and c are dimension-less as well.
References
References
- Antoni et al. [2004] T. Antoni, W. D. Apel, A. F. Badea, et al., Search for Cosmic-Ray Point Sources with KASCADE, The Astrophysical Journal 608 (2004) 865.
- Kotera and Olinto [2011] K. Kotera, A. V. Olinto, The astrophysics of ultrahigh energy cosmic rays, Annual Review of Astronomy and Astrophysics 49 (2011) 119.
- THEMISTOCLE Collaboration et al. [1993] THEMISTOCLE Collaboration, P. Baillon, L. Behr, S. Danagoulian, et al., Gamma ray spectrum of the Crab nebula in the multi TeV region k20, Astroparticle Physics 1 (1993) 341.
- Karle et al. [1995] A. Karle, M. Merck, R. Plaga, et al., Design and performance of the angle integrating Cerenkov array AIROBICC, Astroparticle Physics 3 (1995) 321.
- Fowler et al. [2001] J. W. Fowler, L. F. Fortson, C. C. H. Jui, et al., A measurement of the cosmic ray spectrum and composition at the knee, Astroparticle Physics 15 (2001) 49.
- Berezhnev et al. [2012] S. F. Berezhnev, D. Besson, N. M. Budnev, et al., The Tunka-133 EAS Cherenkov light array: Status of 2011, Nuclear Instruments and Methods in Physics Research A 692 (2012) 98.
- Dyakonov et al. [1986] M. N. Dyakonov, S. P. Knurenko, V. A. Kolosov, et al., The use of Cherenkov detectors at the Yakutsk cosmic ray extensive air shower array, Nuclear Instruments and Methods in Physics Research A 248 (1986) 224.
- Huege et al. [2012] T. Huege, W. D. Apel, J. C. Arteaga, T. Asch, et al., The LOPES experiment - Recent results, status and perspectives, Nuclear Instruments and Methods in Physics Research A 662 (2012) 72.
- Gorham et al. [2008] P. W. Gorham, N. G. Lehtinen, G. S. Varner, et al., Observations of microwave continuum emission from air shower plasmas, Physical Review D 78 (2008) 032007.
- Šmída et al. [2013] R. Šmída, S. Baur, M. Bertaina, et al., Observation of microwave emission from extensive air showers with CROME, European Physical Journal Web of Conferences 53 (2013) 8010.
- CTA Consortium et al. [2011] CTA Consortium, M. Actis, G. Agnetta, F. Aharonian, A. Akhperjanian, et al., Design concepts for the Cherenkov Telescope Array CTA: an advanced facility for ground-based high-energy gamma-ray astronomy, Experimental Astronomy 32 (2011) 193.
- Rowell et al. [2008] G. Rowell, V. Stamatescu, R. Clay, et al., Tenten: A new IACT array for multi-TeV gamma-ray astronomy, Nuclear Instruments and Methods in Physics Research A 588 (2008) 48.
- Gabici and Aharonian [2007] S. Gabici, F. A. Aharonian, Searching for Galactic Cosmic-Ray Pevatrons with Multi-TeV Gamma Rays and Neutrinos, The Astrophysical Journal Letters 665 (2007) L131.
- Tluczykont et al. [2011] M. Tluczykont, D. Hampf, D. Horns, et al., The ground-based large-area wide-angle -ray and cosmic-ray experiment HiSCORE, Advances in Space Research 48 (2011) 1935.
- Ritt et al. [2010] S. Ritt, R. Dinapoli, U. Hartmann, Application of the DRS chip for fast waveform digitizing, Nuclear Instruments and Methods in Physics Research A 623 (2010) 486.
- Serrano et al. [2009] J. Serrano, P. Alvarez, M. Cattin, E. G. Cota, P. M. J. H. Lewis, T. Wlostowski, et al., The white rabbit project, in: Proceedings of ICALEPCS TUC004, Kobe, Japan. Also see: http://www.ohwr.org/projects/white-rabbit/.
- M.Brueckner and R.Wischnewski [2013] M.Brueckner, R.Wischnewski, A white rabbit setup for sub-nsec synchronization, timestamping and time calibration in large scale astroparticle physics experiments, in: Proceedings of the 33rd ICRC, Rio de Janeiro. To appear, paper 1146.
- Brueckner et al. [2013] M. Brueckner, R. Wischnewski, S. Berezhnev, et al., Results from the whiterabbit sub-nsec time synchronization setup at HiSCORE-Tunka, in: Proceedings of the 33rd ICRC, Rio de Janeiro. To appear, paper 1158.
- Wischnewski et al. [2013] R. Wischnewski, S. Berezhnev, M. Brueckner, et al., Status of the HiSCORE experiment, 2013. To appear, paper 1164.
- Budnev et al. [2008] N. M. Budnev, O. B. Chvalaev, O. A. Gress, et al., Data Acquisition System for the TUNKA-133 Array, Astroparticle, Particle and Space Physics, Detectors and Medical Physics Applications (2008) 287.
- Schröder et al. [2010] F. G. Schröder, T. Asch, L. Bähren, et al., New method for the time calibration of an interferometric radio antenna array, Nuclear Instruments and Methods in Physics Research A 615 (2010) 277.
- Heck et al. [2012] D. Heck, T. Pierog, J. Knapp, CORSIKA: An Air Shower Simulation Program, 2012. Astrophysics Source Code Library.
- Kalmykov et al. [1997] N. N. Kalmykov, S. S. Ostapchenko, A. I. Pavlov, Quark-Gluon-String Model and EAS Simulation Problems at Ultra-High Energies, Nuclear Physics B Proceedings Supplements 52 (1997) 17.
- Fesefeldt [1985] H. Fesefeldt, 1985. Report PITHA-85/02, RWTH Aachen.
- Pierog [2013] T. Pierog, LHC data and extensive air showers, European Physical Journal Web of Conferences 52 (2013) 03001.
- Hampf et al. [2010] D. Hampf, M. Tluczykont, D. Horns, Simulation of the expected performance for the proposed gamma-ray detector HiSCORE, 2010. Proceedings of Science (Texas 2010) 245.
- Bernlöhr [2008] K. Bernlöhr, Simulation of imaging atmospheric Cherenkov telescopes with CORSIKA and sim_telarray, Astroparticle Physics 30 (2008) 149.
- Hampf [2012] D. Hampf, Study for the wide-angle air cherenkov detector HiSCORE and time gradient event reconstruction for the H.E.S.S. experiment, 2012. PhD thesis, University of Hamburg, http://ediss.sub.uni-hamburg.de/volltexte/2012/5699/.
- Kneizys et al. [1996] F. Kneizys, L. Abreu, G. Anderson, et al., The modtran 2/3 report and lowtran 7 model, 1996. Edited by: Abreu, L.W., Anderson, G.P.
- Henke [1994] V. Henke, Studie zur Auswertung der Ankunftszeitverteilung des Cerenkov-Lichts ausgedehnter Luftschauer., 1994. Diploma thesis, University of Hamburg.
- Hörandel [2003] J. R. Hörandel, On the knee in the energy spectrum of cosmic rays, Astroparticle Physics 19 (2003) 193.
- Hampf et al. [2011] D. Hampf, G. Rowell, N. Wild, T. Sudholz, D. Horns, M. Tluczykont, Measurement of night sky brightness in southern Australia, Advances in Space Research 48 (2011) 1017.
- Nakamura et al. [2010] K. Nakamura, et al., Particle Data Group, Journal of Physics G 37 (2010) 075021.
- Hampf et al. [2013] D. Hampf, M. Tluczykont, D. Horns, Event reconstruction techniques for the wide-angle air Cherenkov detector HiSCORE, Nuclear Instruments and Methods in Physics Research A 712 (2013) 137.
- Li and Ma [1983] T.-P. Li, Y.-Q. Ma, Analysis methods for results in gamma-ray astronomy, The Astrophysical Journal 272 (1983) 317.
- Aharonian et al. [2006] F. Aharonian, A. Akhperjanian, K.-M. Aye, et al., The H.E.S.S. survey of the inner galaxy in very high-energy gamma-rays, The Astrophysical Journal 636 (2006) 777.
- Bartoli et al. [2013] B. Bartoli, P. Bernardini, X. J. Bi, et al., TeV Gamma-Ray Survey of the Northern Sky Using the ARGO-YBJ Detector, The Astrophysical Journal 779 (2013) 27.
- Abdo et al. [2007] A. A. Abdo, B. Allen, D. Berley, et al., Discovery of TeV Gamma-Ray Emission from the Cygnus Region of the Galaxy, The Astrophysical Journal 658 (2007) L33.
- Meyer et al. [2010] M. Meyer, D. Horns, H.-S. Zechlin, The Crab Nebula as a standard candle in very high-energy astrophysics, Astronomy and Astrophysics 523 (2010) A2.
- Abdo et al. [2007] A. A. Abdo, B. Allen, D. Berley, et al., TeV Gamma-Ray Sources from a Survey of the Galactic Plane with Milagro, The Astrophysical Journal 664 (2007) L91.
- Aharonian et al. [2009] F. Aharonian, A. G. Akhperjanian, G. Anton, et al., Detection of very high energy radiation from HESS J1908+063 confirms the Milagro unidentified source MGRO J1908+06, Astronomy and Astrophysics 499 (2009) 723.
- Bartoli et al. [2012] B. Bartoli, P. Bernardini, X. J. Bi, et al., Observation of the TeV Gamma-Ray Source MGRO J1908+06 with ARGO-YBJ, The Astrophysical Journal 760 (2012) 110.
- Tluczykont et al. [2012] M. Tluczykont, D. Horns, D. Hampf, R. Nachtigall, et al., HiSCORE: A new detector for astroparticle and particle physics beyond 10 TeV, Nuclear Instruments and Methods in Physics Research A 692 (2012) 246.
- Dubus et al. [2013] G. Dubus, J. Contreras, S. Funk, et al., Surveys with the Cherenkov Telescope Array, Astroparticle Physics 43 (2013) 317.
- Sinnis [2005] G. Sinnis, HAWC: A Next Generation VHE All-Sky Telescope, in: F. A. Aharonian, H. J. Völk, D. Horns (Eds.), Heidelberg Gamma-Ray Symposium, volume 745 of American Institute of Physics, p. 234.
- Cao [2010] Z. Cao, A future project at Tibet: the large high altitude air shower observatory (LHAASO), Chinese Physics C 34 (2010) 249.
- Cui et al. [2014] S. Cui, Y. Liu, Y. Liu, X. Ma, Simulation on gamma ray astronomy research with LHAASO-KM2A, Astroparticle Physics 54 (2014) 86 – 92.
- Gonzalez-Garcia et al. [2009] M. C. Gonzalez-Garcia, F. Halzen, S. Mohapatra, Identifying Galactic PeVatrons with neutrinos, Astroparticle Physics 31 (2009) 437.