Ranking structures and Rank-Rank Correlations of Countries.
The FIFA and UEFA cases
B-4031, Liege Angleur, Euroland
email: marcel.ausloos@ulg.ac.be
2 University of Liège,
Department of Chemistry, B6C LCIS - GreenMAT, B-4000 Liège
email: rcloots@ulg.ac.be
3 University of Technology and Life Sciences,
Department of Physics, Institute of Mathematics and Physics, PL-85-796 Bydgoszcz, Poland
email: agad@utp.edu.pl;agad@atr.bydgoszcz.pl
4 Bulgarian Academy of Sciences, Institute of Mechanics,
Acad. G. Bonchev Str., Bl. 4, BG-1113 Sofia, Bulgaria
email: vitanov@imbm.bas.bg)
Abstract
Ranking of agents competing with each other in complex systems may lead to paradoxes according to the pre-chosen different measures. A discussion is presented on such rank-rank, similar or not, correlations based on the case of European countries ranked by UEFA and FIFA from different soccer competitions. The first question to be answered is whether an empirical and simple law is obtained for such (self-) organizations of complex sociological systems with such different measuring schemes. It is found that the power law form is not the best description contrary to many modern expectations. The stretched exponential is much more adequate. Moreover, it is found that the measuring rules lead to some inner structures, in both cases.
1 Introduction
.
It is of common knowledge that in life one has often to choose some product. Similar products are ranked, usually according to some criterion. Several criteria can be employed for influencing one’s choice. However the criteria may lead to different ranking lists, albeit the bare quality of the product should rationally be taken as criterion-independent. In several cases, this leads to incompatibility. One famous example, known as Arrow’s theorem [1] implies that a choice might not be always logically possible. Practical cases for example occur in sports, like college football in the NCAA, where the best teams are ranked according to voting procedures, by different media. Another team sport, soccer, is worldly known as also enticing enthusiasm and discussions. Teams (clubs or countries) are ranked through results of various competitions. However round robin tournaments, to decide the best team, are rare, although in theory are the fairest ways to determine a champion among a given number of participants. Of course, a round robin tournament can also be used to determine which teams are the poorest performers.
It is well known that a knockout tournament where half of the participants are eliminated after each round is a faster method of selection, but the method is highly debatable since it matches teams (or players) somewhat randomly. The final results being therefore often dependent of the draw, i.e. with biased initial conditions.
Finally, the so called Swiss system tournaments attempt to combine elements of the round-robin and elimination formats. This is very usual: the ranking of soccer countries, studied here, belongs to such a category .
Note that the same considerations can be made for players in individual sports and also when players are grouped by pairs or triplets, e.g., in golf, tennis or billiards, petanque (french game of bowls), or more.
The specific scientific literature on soccer themes seems limited to (i) a 2001 paper by Kern and Paulusma [2] who discussed FIFA rules complexity for competition outcomes leading to ranking and (ii) a 2007 paper by Macmillan and Smith, explaining ranking [3]. From a more general point of view, one should mention Churilov and Flitman [4] model for producing a ranking of participating teams or countries, like in olympics games.
There are other papers, quite interesting, - since at the interfaces of various disciplines, often tied to various technical questions or limited to the analysis of distribution functions, - thus without conveying questions on e.g. (self-) organizations of complex sociological systems.
From a scientific point of view, ranking is an old problem with a long history. The comparison of ”values”, through ranking, has produced dozens of ranking methods, not only in sports [5], but also for ranking candidates in a political context, scientists, webpages or various types of ”goods” or ”agents”. Among many nonparametric procedures relying on counting and ranking processes applied either directly to the sample data or to some natural function, the most basic, but immediately useful, analysis pertains to ideas following Zipf ranking considerations [6]. Thereafter several empirical laws can be imagined as recalled in Sect. 2.
However, measurements or ranking in sport competitions, though frequently reported in the media, often lack the necessary descriptive power, as the physics of complex systems usually present, - with a recent exception [7]. Here below, an analysis of some ranking data from a specific nonlinear complex system, i.e. soccer country ranking, as a specific modern society interesting example, is reported. Two systems, i.e. the FIFA and the UEFA ”measures” are explained and illustrated in Sect. 3. The section presents a short description of the studied data and of the ranking rules. The rank-size relationship is searched for the FIFA or UEFA ranking, respectively. At first, as in most modern studies on ranking in complex systems of interacting agents, power laws are expected. It will be found that they are subsequently observed in neither cases. A general discussion of the displayed features and specific comments, leading to some understanding of the findings, are presented.
The article ends with a discussion of rank-rank correlations as can be proposed from these two sets of data, - and the measuring criteria, in Sect.4, before a brief pragmatic discussion of findings in Sect. 5 and conclusions in Sect.6. Two Appendices are also attached to this article. In Appendix A, the ranking of FIFA countries is briefly analyzed for completeness. Another (Appendix B) shows the unexpectedly simple, but yet not explained, ”trivial” correlation between two UEFA ranking coefficients.
2 On Ranking Laws
Ranking analysis has been performed for a long time since Zipf [6] who observed that a large number of size distributions, can be approximated by a simple scaling (power) law , where is the ranking parameter, with , (and obviously ). Many developments followed such an observation, e.g. of course in linguistics, but also in many domains [8]. Whence, Zipf ideas has led to a flurry of log-log diagrams showing a straight line through the displayed data. It is obvious that a more flexible equation/law,
| (2.1) |
is of greater interest, since it has two parameters; it is called the rank-size scaling law. The particular case is thought to represent a desirable situation, in which forces of concentration balance those of decentralization [8]. Such a case is called the rank-size [8]-[12]. The scaling exponent can be used to judge whether or not the size distribution is close to some optimum (equilibrium) state.
The rank-size relationship has been frequently identified and sufficiently discussed to allow us to base much of the present investigation on such a simple law. This may be ”simply” because the rank-size relationship can be reached from a wide range of specific situation [10]-[12].
However, the mere exponential (2 parameter fit) case
| (2.2) |
should be also considered. For short hand notations, these two analytic forms are called Pwl2 and Exp2 in the figures.
In the present paper, three other often used 3-parameter statistical distributions, generalizing the power and/or exponential law are used to examine the UEFA data: (i) the Zipf-Mandelbrot-Pareto (ZMP) law reads
| (2.3) |
(ii) the power law with cut-off reads
| (2.4) |
(iii) while the stretched exponential is
| (2.5) |
For short hand notations, these three analytic forms are called ZMP3, Pwco3, and Stx3, respectively, in the figures. Since , in Eq.(2.3), is not necessarily found to be an integer in a fit procedure, can be considered as a continuous variable, for mathematical convenience, without any loss of mathematical rigor; the same for the fit parameters , , (or ), , and , and for the ”relaxation ranks” and (and ). Note that both and exponents, in Eq.(2.1), and Eq.(2.3). must be greater than 1 for the distributions to be well-defined (also greater than 2 for the mean to be finite, and greater than 3 for the variance to be finite).
| FIFA | UEFA | UEFA | FIFA | ||
| (UEFA) | ”mean” | ”points” | all | ||
| min | 0 | 0 | 0.92 | 0 | |
| Max | 1617 | 20.857 | 84.41 | 1617 | |
| Sum | 32647 | 234.41 | 1098.5 | 81830 | |
| mean () | 615.98 | 4.4229 | 20.726 | 391.53 | |
| median (m) | 606 | 2.3 | 14.25 | 328 | |
| RMS | 711.23 | 6.460 | 29.75 | 501.17 | |
| Std. Dev. () | 358.95 | 4.753 | 21.553 | 313.6 | |
| Var. | 128846.7 | 22.59 | 464.5 | 98346.1 | |
| Std. Err. | 49.306 | 0.65287 | 2.960 | 21.692 | |
| Skewn. | 0.6268 | 1.470 | 1.486 | 1.065 | |
| Kurt. | 0.054 | 1.646 | 1.517 | 1.069 | |
| 1.716 | 0.930 | 0.962 | 1.248 | ||
| 3 | 0.0834 | 1.340 | 0.901 | 0.608 | |
| 53 | 53 | 53 | 209 | ||
| 1 | 2 | 0 | 4 |
3 Country ranking
First, let the major difference in the ranking of national squads by FIFA [13] and the ranking of countries222More exactly called ”Association Members”: often each ”agent” represents one country, though not necessarily: e.g., England, Scotland, Wales, Northern Ireland, Faroe Islands, New Caledonia, etc. are distinguished. by UEFA [14] be emphasized. The former results from ranking following a set of matches between national teams, the latter is deduced from team ranking of the Association Members [15]. The former serves to allocate primacy in drawing of groups at the World Cup, the latter to calculate how many teams per ”country” are allowed to play in the Champions League and in the Europa League. Both rankings serve a priori different competitions and aims, both tied to different economic conditions or interests, - a discussion outside our present purposes. However, the fact that such rankings are for the same ”objects” or ”agents” is the underlying signature of the present scientific questions, mentioned in the Sect.1.
In Sept 2012, FIFA [16], made of 6 confederations [17], grouped 209 Member Associations squads, , 53 of them being in the UEFA. Therefore the FIFA ”country” rank value, , has to be ”projected” into the UEFA rank space, , eliminating out-of-UEFA squads, - thereby giving an appropriate new rank value for subsequent data analysis, and for comparison with the UEFA rank, .
In the following there is no discussion of the evolution of the rank of any country; the data pertains to both ranking exclusively in Sept 2012. Nevertheless, it is expected that the chosen date, relatively arbitrary, away from major events, can serve as a valid one for the questions and discussions pertaining to such a type of data set .
3.1 FIFA Country ranking
The FIFA Country ranking system is based on results over the previous four years (instead of the previous eight years) since July 2006. It is briefly described for completeness in Box#1.
Box
FIFA points system
The total number of points depends on results over a period as determined by adding:
•
the number of points gained from matches during the past 12 months
•
and the number of points gained from matches older than 12 months, thus over the 3 previous years
The number of points that can be won in a match depends on (*)
•
the match result (win, draw, loss) ()
•
the match importance ()
•
the ranking of the opposite country (),
and
•
the confederation to which the opponent belongs ()
The total number of points () is found from
(3.1)
(*) In short,
•
=3, 1, 0 for a win, draw, loss
•
= 1.0, 2.5, 3.0, 4.0 respectively for any friendly, world cup qualification, confederation level final competition, world cup final competition match
•
= 200 - the ranking position of the opponent333
As an exception to this formula, the team at the top of the ranking is always assigned the value 200 and the teams ranked 150-th and below are assigned
an equal value of 50..
The ranking position is taken from the opponent ranking in the most recent rank list published by FIFA,
and
•
= 1.0 for UEFA and CONMEBOL, 0.88 for CONACAF, 0.86 for AFC and CAF, and 0.85 for OFC (see [17] for acronyms)
3.2 FIFA(UEFA) ranking data analysis
First, the UEFA countries, as ranked by FIFA, are first extracted from the overall rank distribution, and their order reconstructed such that there is no gap in the ranking, . The statistical characteristics of this ”projected” rank distribution are given in Table 1.
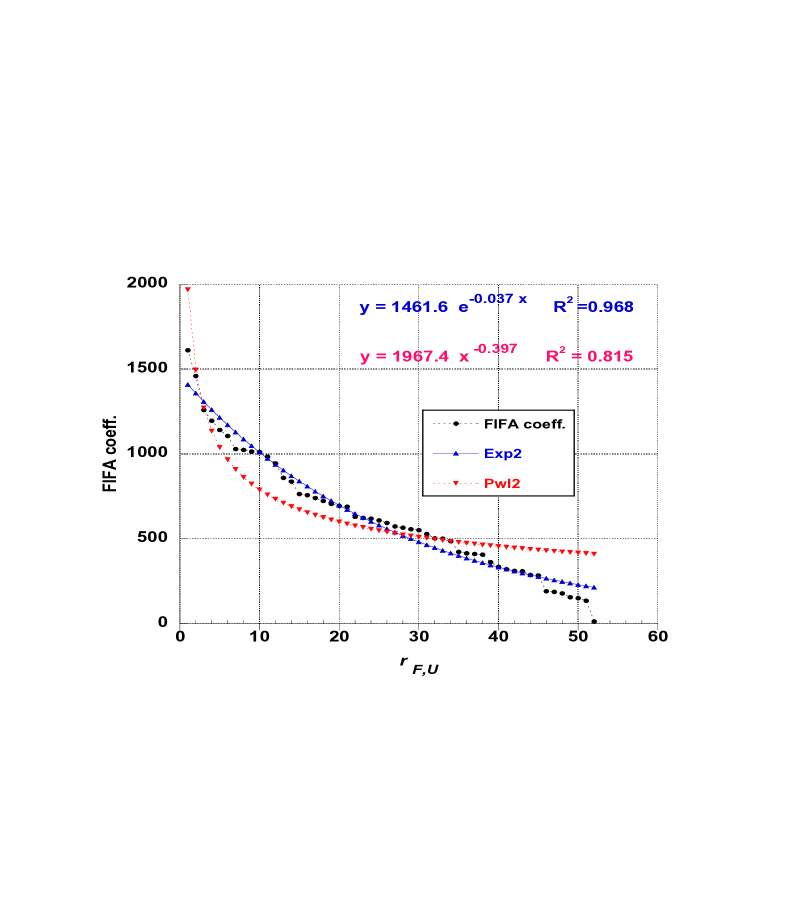
Next, the simple exponential and the power law as fitted to the FIFA coefficient for the ranked, in descending order, 53 UEFA ”Association Members” in Sept. 2012 are shown in Fig.1. The numerical values of parameter fits and the corresponding regression coefficient are given. It is at once remarkable that the power law fit is a poor approximation to fit the data.
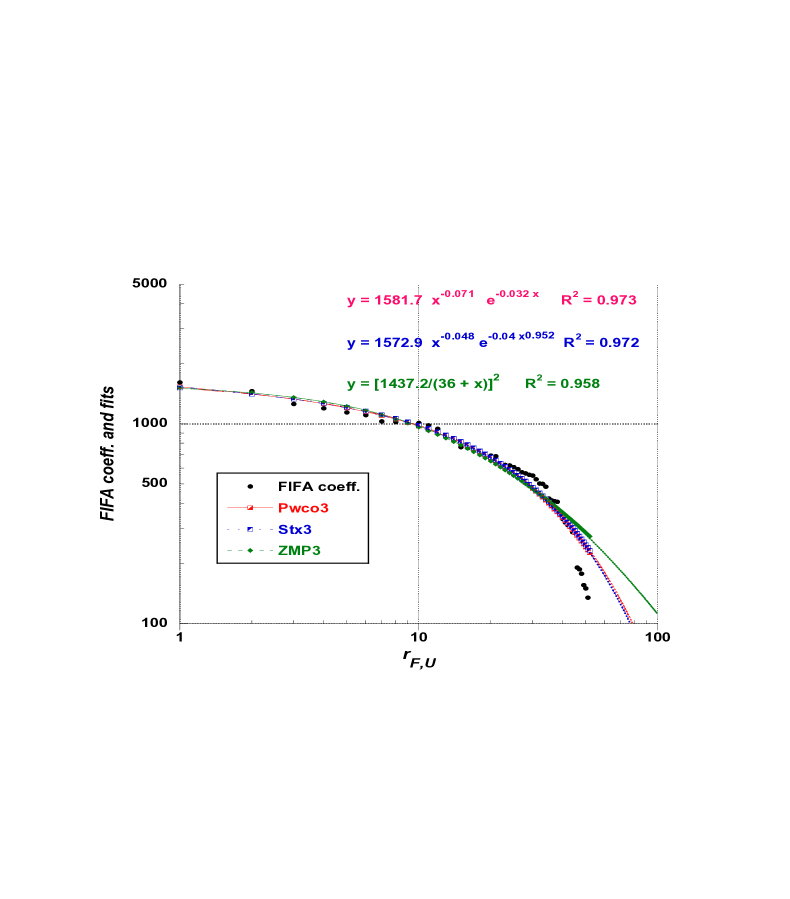
Possible other empirical relationships between the FIFA coefficient for the 53 UEFA ”Association Members” (ranked in descending importance order) in Sept. 2012 are shown on a log-log plot in Fig.2. The last 3 data points, at high rank, with FIFA coefficient less than 100, are not displayed for enhancing clarity. The three 3-parameter law fits are astoundingly similar and rather undistinguishable. However, the ZMP3 fit, i.e. the more simple generalizing the power law, appears to be the worse of the three fits. The corresponding regression coefficient are also given in Table 2 for comparison with other fits.
From the classical linear-linear axes plot in Fig.1 and also from the log-log plot in Fig.2, some deviation can be observed. However there are not irregularly distributed on both sides of the fits, but appear as ”regimes”, through jumps at specific data points, apparently rather regularly spaced.
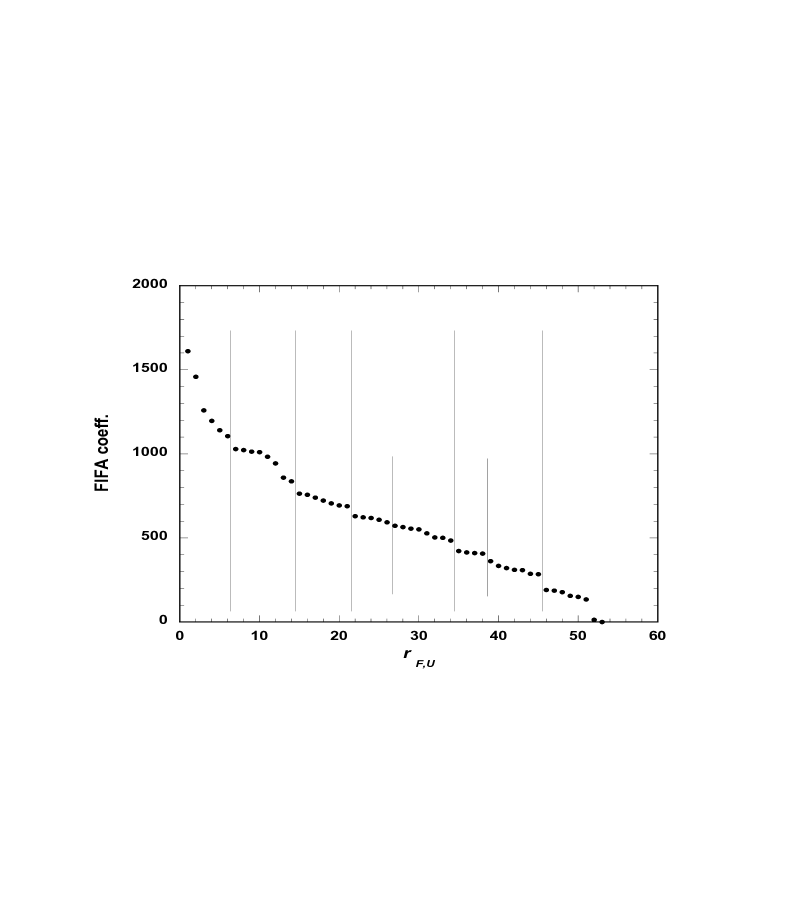
The UEFA distribution coefficient characteristics are given in Table 1. The kurtosis and skewness suggest the existence of ”structures”. They are pointed out in Fig. 3, displaying the Sept. 2012 FIFA coefficient for the 53 UEFA ”Association Members” ( ) ranked in decreasing order. The ”regimes” are pointed out by vertical lines. The average regime size is remarkably well defined, i.e. with a = 0.994.
A posteriori, it might have been expected that a regime size = 8 might have been underlying, since 8 = 23 (!), which is, as other values of , usual integers for defining groups and pools in various tournament competitions. The value 6.7 seems to indicate that the intrinsic border between groups is fluctuating, i.e. only 1 or 2 teams can move from one group to another.
3.3 UEFA Country ranking
The UEFA (association member or) ranking takes into account the results of all from each association. (It is used to determine the number of entries an association is granted for forthcoming seasons.) This UEFA club coefficient ranking is based on the results of all European clubs in UEFA club competition, i.e. the UEFA Champions League and the UEFA Europa League, on the previous ”seasons”. The calculation of the ”country” coefficient is recalled in Box#2. The club coefficients of success is described on [15] and reworded for completeness in Box as well. Observe that the rules are more complicated than a ”win-draw-loss” rating.
Two UEFA country measures exist [14]: the point ranking and the mean ranking . A country rank, either or slightly differs according to the measure; see Appendix B. The mean ranking is used here below for analysis. The statistical characteristics of both distributions are given in Table 1.
Box
UEFA country ranking systems
The total number of points results from the sum of the number of points teams of an Association have won over a period.
•
The coefficient is calculated by working out an average score: dividing the number of points
(*)
obtained, by the total number of clubs having represented an association in both UEFA club competitions., within that season.
•
The resulting figure is then tallied with the results of the previous seasons to calculate the UEFA coefficient.
(*) In short, the number of points won by a team of an Association is calculated as follows:
•
A team gets 2 points for a win and 1 point for a draw, but
•
points are halved for matches in the qualifying and play-off rounds.
•
4 points are awarded for participation in the group stage of the UEFA Champions League and 4 points for qualifying for the round of 16.
•
Clubs that reach the round of 16, quarter-finals, semi-finals or final of the UEFA Champions League, or the quarter-finals, semi-finals or final of the UEFA Europa League, are awarded 1 extra point, for each round.
The UEFA rankings are updated after each round of UEFA club competition matches.
3.4 UEFA ranking data analysis
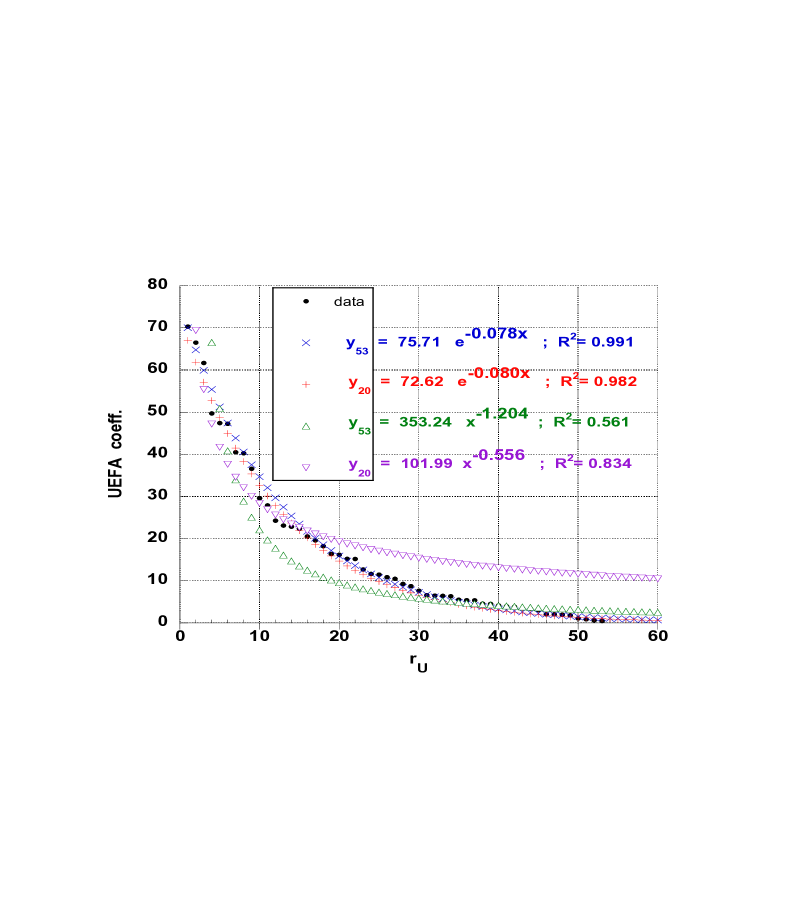
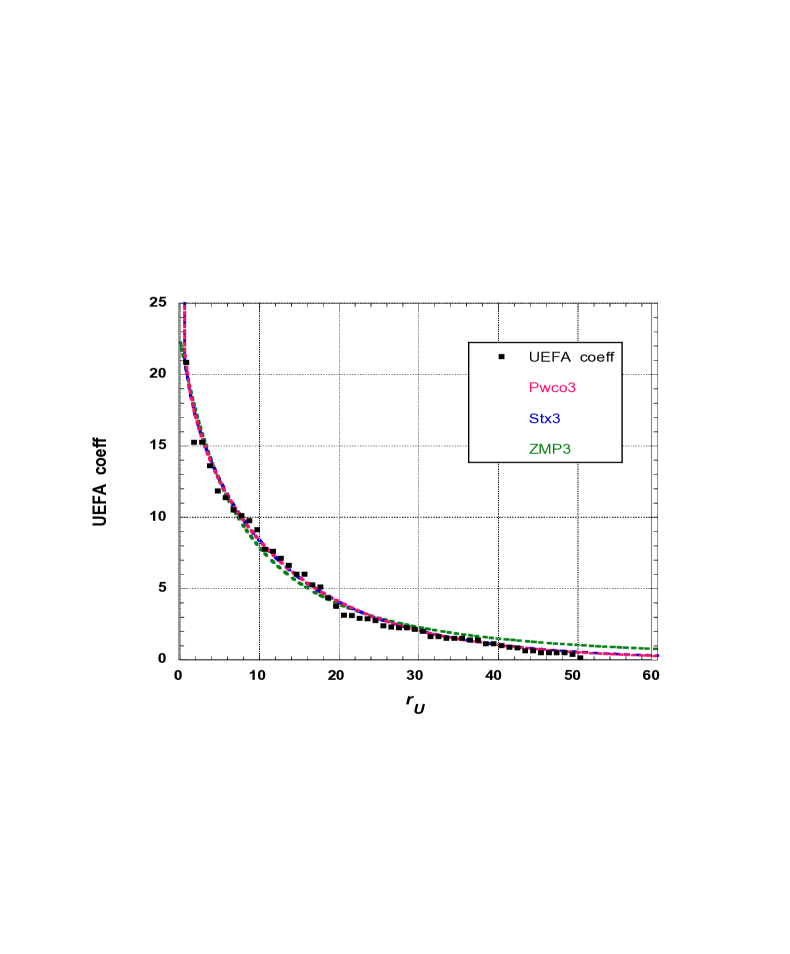
As above, several analytical expressions have been used, i.e. starting from an exponential law and a simple power law, and their generalization to a 3-parameter analytical form for searching an interesting empirical relationship between the UEFA coefficient for the 53 ”Association Members” ( ) and their rank in Sept. 2012, both the exponential and the power law fit, shown in Fig.4, are hardly convincing.
However, the 3-parameter laws are all very fine and quasi undistinguishable; see Fig 5. The high agreement between the resulting fits for the 53 UEFA members is somewhat interesting. Note that the 3-parameter generalized exponential behavior ”wins” much over the ZMP3 power law, from a rule point of view; see Table 2.
Nevertheless, as for the FIFA country ranking444and for the UEFA team ranking [18], some marked deviation seems to occur regularly. In order to emphasize the occurrence of ”regimes”, the mere 2-parameter exponential and the power law fits are also presented in Fig. 4 for the top 20 ”countries”. Somewhat surprisingly the value of the exponential fit slightly decreases (), while the value of the power law fit reasonably increases to . Observe that the numerical parameter of the exponential is . In fact, data steps can be read throughout the UEFA tables, near multiples of 6. On one hand, it can be claimed that such statistical results depend much on the finiteness of the data; thus, free to take these ”small sample statistics” results as trends, rather than securely established distributions. On the other hand, they also point to inner structures.
4 On Rank-Rank correlation Laws
In order to observe whether there is or not some correlation between the two ranking schemes, one may calculate the Kendall’s rank measure [19]. As done above, the FIFA all country ranking is projected onto the UEFA country set, and the ranking redefined as ranging from 1 to 53. The latter can be compared to the mean ranking (and also to the point ranking , not done here). The Kendall’s measure [19] compares the number of concordant pairs and non-concordant pairs through
| (4.1) |
Of course, , where is the number of ”agents” in the two (necessarily equal size) sets. A website [20] allows its immediate calculation.
It is found that and , whence .
Under the null hypothesis of independence of the rank sets, the sampling would have an expected value . For large samples, it is common to use an approximation to the normal distribution, with mean zero and variance, in order to emphasize the coefficient significance, through calculating
| (4.2) |
Since , and one has , thereby indicating a large correlation between the two sets.
Finally, a word on the coefficient distributions is in order, before a specific discussion on country teams. The skewness is positive, in both cases, necessarily here, see Table 1. For such right skewed distributions, most data values are concentrated on left of the mean, with extreme values to the right. Pearson’s median (or second skewness coefficient) defined by given in Table 1 confirms that most of the ”area” is below the mean with many countries having a high rank and low FIFA or UEFA coefficient value. On the other hand, the kurtosis is much below 3, indicating a platykurtic distribution, i.e. the data values are widely spread around the mean, - here with a ”long” tail. In some sense, one obtains a picture of the Matthew effect: the winning countries are always the same ones, and stay more at the top than others.
| R2 for | ZMP3 | Pwco3 | Stx3 | Exp2 | fits |
|---|---|---|---|---|---|
| UEFA | 0.98 | 0.99 | 0.99 | 0.99 | |
| FIFA(UEFA) | 0.956 | 0.973 | 0.972 | 0.968 | |
| FIFA(all) | 0.962 | 0.984 | 0.981 | 0.967 |
| rank | FIFA | UEFA | UEFA | FIFA |
|---|---|---|---|---|
| (UEFA) | (mean) | (points) | all | |
| 1 | ESP | ESP | ESP | ESP |
| 2 | GER | ENG | ENG | GER |
| 3 | ENG | GER | GER | ENG |
| 4 | POR | ITA | NED | POR |
| 5 | ITA | POR | POR | URU |
| 6 | NED | NED | ITA | ITA |
| 7 | CRO | FRA | FRA | ARG |
| 8 | DEN | RUS | BEL | NED |
| 9 | GRE | BEL | RUS | CRO |
| 10 | RUS | UKR | CYP | DEN |
| 11 | FRA | GRE | UKR | GRE |
| 12 | SWE | CYP | GRE | BRA |
5 Discussion
From a pragmatic point of view, it might be worthwhile to list the few top countries according to their rank in Sep. 2012; see Table 3. The evolution of the country ranking in both schemes is outside the scope of the present study, concerned with finding empirical laws (as discussed above) and rank-rank comparison, see below. Nevertheless, some behavior of the dynamics of evolution is manifested in the above data analysis and through the finding of ”regimes”. Note that along the above assertion, some rational explanation of escaping from obeying exclusively either the power or the simple exponential laws can be imagined. This explanation also points implicitly to the classifying groups, and their size, imposed by the UEFA hierarchy in specific competitions.
In brief, England [ENG], Germany [GER] and Spain [ESP] come first. Next, [ITA], [NED], and [POR] follow the three top European nations555 After the 2013 all-German Champions League Final on May 25, 2013, between Borussia Dortmund and Bayern München, the position of Germany is necessarily strengthened in the ranking, shifting it up to the level of Spain. Due to Paris Saint Germain achievements, this club has substituted Twente Enschede from the Netherlands in the team ranking, - therefore dragging the Dutch score is as low as the Russian one, and pushing up France above these last two ”Members”. The position of Italy is rather stiff. A short comment about the ranking of other specific countries, under the logics of the presented comparison, seems in order here.. Note that the positions of Ukraine and Russia have become stiff or unchanged. However, Poland and Bulgaria seem to loose systematically, - in terms of football rankings, their reputation, although the two associations (countries) got EU membership after the great political turnover at the edge of the 1980s and the 1990s, - in contrast with Russia and Ukraine, both countries being still out of EU membership. Belgium, being ”exceptional”, implies a comment in the text. . There is a mild dissimilarity only between the two types of rankings. This is expected from a sport fan point of view. Nevertheless, the concordance seems somewhat puzzling because, on one hand the measures wear on different competitions, and on the other hand, the ”European club” teams are far from being composed of their citizens only. This remarks is substantiated by the case of Belgium, for which the national squad is quasi entirely made of players belonging to clubs outside Belgium, - the national squad having done rather well in the last few years, but the Belgian (club) teams made of diverse citizenship players are doing rather poorly in UEFA competitions.
As of now, something seems to be clear for the UEFA (indirect) classification of countries: namely, the majority rule of introducing (club) teams in the ranking by (national-like) UEFA Association Members goes in its first footing scheme via a Fibonacci rule or Pascal-like triangle. It may also be viewed as a saturation effect in a finite system, i.e. the number of ”valuable clubs’, - together with the finite size of the number of available days for a one year competition. Bear in mind, however, that the Fibonacci rule is a signature of deterministic chaos to which no single scaling law applies at a reasonable length. In addition, recall that the Fibonacci ordering is characteristic of tree or plant branches ramification to mention but two morphogenetic examples. On the other hand, it discloses the so called golden division (or, golden ratio) of the whole, thus, a fairly rational principle of partitioning a whole into smaller pieces.
Those inner structures might be mathematically further studied. Some hint for further investigation arises through some analogy. These structures qualitatively resemble those of polycrystalline type materials [21]. Namely, if a polycrystal had an intrinsically predetermined initial structure composed of a certain number of bigger-than-others grains, which is often the case, such grains would then ultimately survive following (e.g. temperature) cycling [22, 23] giving the largest contribution to the final structure. It is because such dominating (in size) grains suffer from more relaxed surface-tension conditions than their smaller neighbors. Intriguingly, the resulting grain distributions are found to be squeezed, as is also the Stx3 form used for appropriate fitting, Eq. (2.5). They can be found obeying the Weibull distributions [21], with a scaling factor ( therein), becoming time-independent in case when the final structure is formed. Thus, the structures pre-discovered in Fig. 3 can qualitatively reflect a hierarchy of grains in a polycrystal, grouping them in size-dependent pools. Note, however, that the process of long-time polycrystal formation undergoes better statistics [24] than the one presented here above, more considered as a trend in the present study.
For the ”countries” as for the team, the inner structure is likely tied to the pool, first rounds, then to the ”direct elimination” tournament-like process. The no-power law regime seems therefore to indicate that indeed a tree rather than a network structure is at hand. Studies of round-robin tournaments with a large number of competitors/agents seem to be of interest for confirming, or not, the present findings.
6 Conclusions
In conclusion, it has been searched whether two measuring schemes leading to ranking corroborate each other, although the schemes are geared toward different purposes. Moreover, it was searched whether the ranking leads to simple but empirical laws. The case of European countries ranked by UEFA and FIFA from different soccer competitions was taken for illustration. It is found that the power law form and subsequently the rank size rule obviously do not appear to be the best simple description contrary to many modern expectations. In fact, it is found that the measuring rules lead to some inner structures, in both cases. These structures are proposed to originate from the types of competition and point attribution rules intrinsic to this complex system, i.e. a tree-like structure in contrast to a network structure. The latter is likely more appropriate in round-robin competitions. In fine, Arrow’s impossibility theorem is also illustrated, since the ”ranked preferences” of teams are not univocal, due to not meeting a set of ”criteria” with three or more discrete options to choose from.
Acknowledgments
MA and NKV acknowledge some support through the project ’Evolution spatiale et temporelle d’infrastructures régionales et économiques en Bulgarie et en Fédération Wallonie-Bruxelles’, within the intergovernemental agreement for cooperation between the Republic of Bulgaria and the Communauté Française de Belgique. Moreover, this work has been performed in the framework of COST Action IS1104 ”The EU in the new economic complex geography: models, tools and policy evaluation”.
Appendix A. All FIFA countries For completeness, let this Appendix contain a display and short analysis of the FIFA ranking for the 206 countries which level was recorded in 2012. Note that beside the UEFA San Marino, three countries, i.e. Bhutan, Montserrat, and Turk and Caicos Islands, had a coefficient equal to 0.
Table A1: numerical values of parameter fits and the corresponding regression coefficient for all FIFA countries in Sept. 2012; see Fig1A for illustration
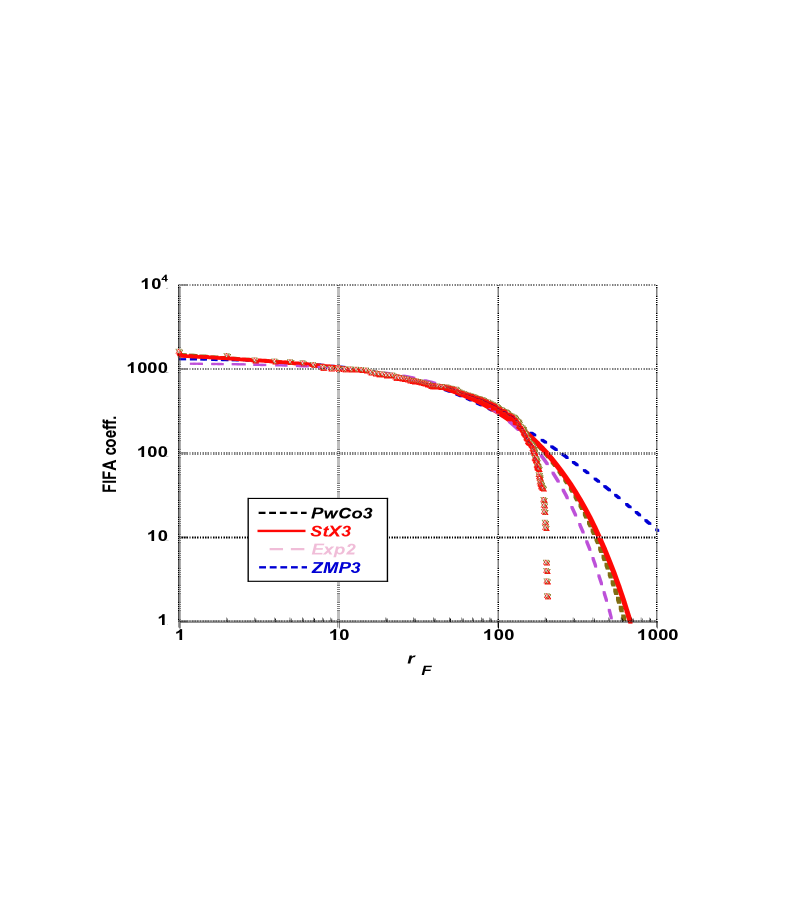
A few possible and simple empirical relationships, as proposed in the main text, between the FIFA country coefficient as ranked in Sept. 2012 are shown in Fig. 6 on log-log plots. Four fits are displayed; the corresponding regression coefficients are given in Table 2. Except for the Exp2 fit which seems to miss the low ranked data, the 3-parameter empirical laws seem to be equivalently precise.
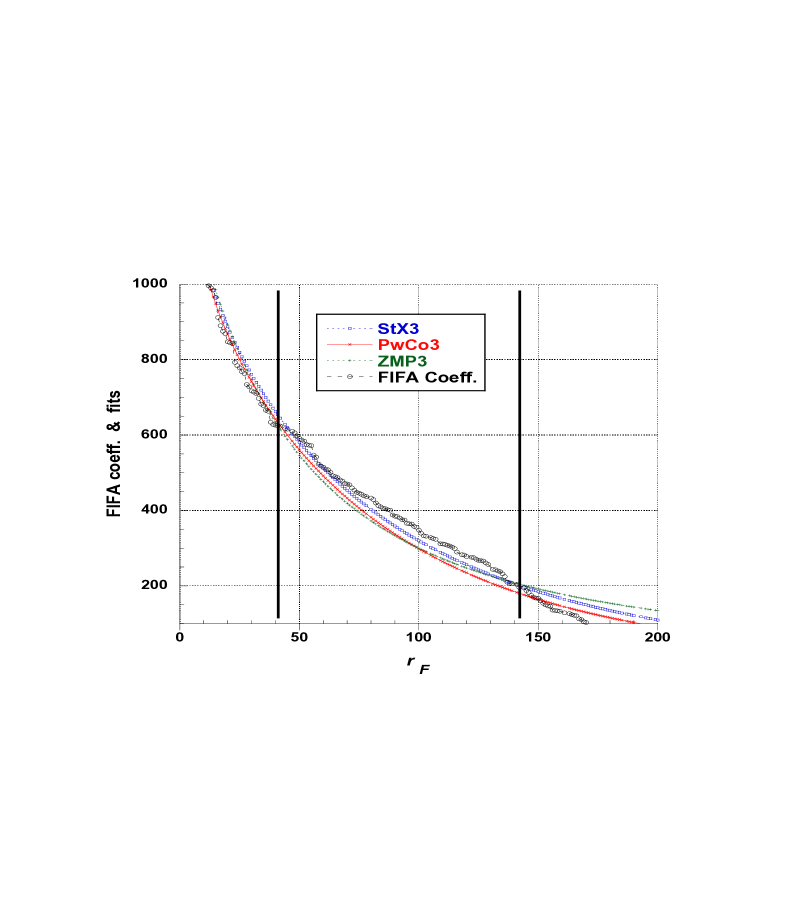
Nevertheless some marked deviation occurs for . A more detailed examination of the the difference between the data and the fits indicate large regions where the difference is either positive or negative. Intersection points depend on the empirical law, but occur in a close range. The sign of the difference defines regimes limited either by and for Stx3 and Pwco3 or by and for ZMP3. This is illustrated in Fig.7. In some colloquial way, one can thus point to three categories of countries: (i) the top ones, (i)) the ”soft belly”, and (iii) the ”small” ones.
Appendix B. Correlation between UEFA Points and UEFA Average Coefficients
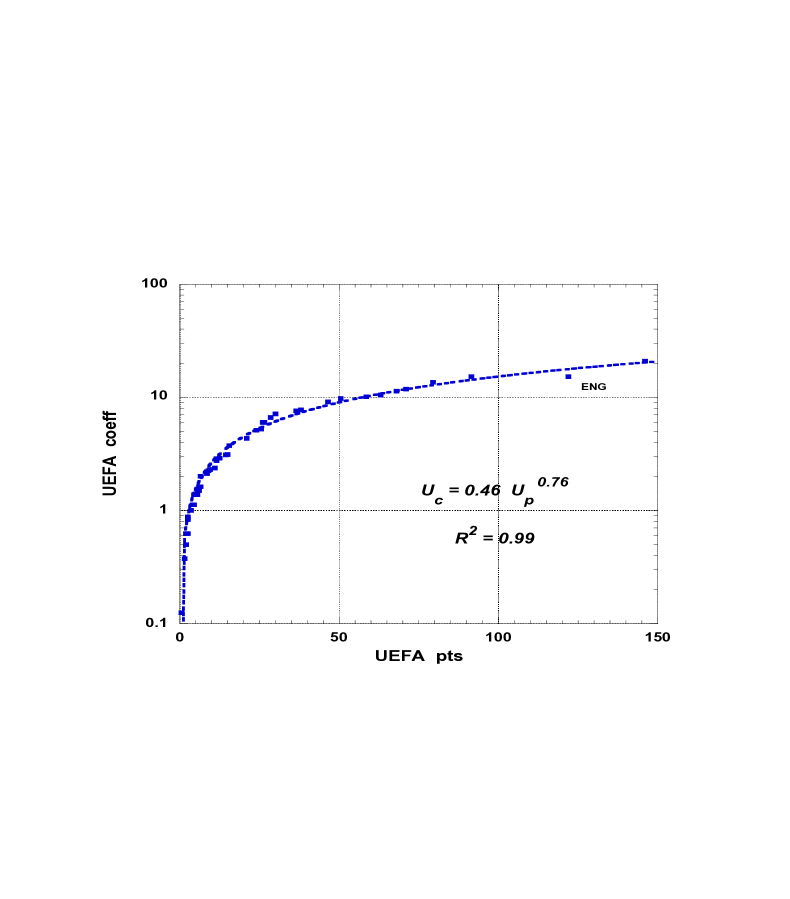
The correlation between reordered UEFA points () and UEFA coefficients () in Sept 2012
| (.1) |
is shown in Fig.8. There is hardly an explanation for this remarkable fit, nor any reason why ENG is outside the fit.
The number of concordance pairs and non-concordance pairs of the and leads to from Eq.(4.1); = 1292 and = 1378, or =1335 and = 43. This large value of indicates that the two measures strongly agree, thus are rather equivalent, on the ”evaluation of the countries”.
Moreover from Eq.(4.2), since , whence , one has , - quite large to reject the null hypothesis, indicating a high correlation between the two sets.
References
- [1] K.J. Arrow, A Difficulty in the Concept of Social Welfare, Journal of Political Economy 58, 328-346 (1950).
- [2] W. Kern and D. Paulusma, The new FIFA rules are hard: complexity aspects of sports competitions, Discrete Applied Mathematics 108, 317-323 (2001).
- [3] P. Macmillan and I. Smith, Explaining International Soccer Rankings, Journal of Sports Economics 8, 202-213 (2007).
- [4] L. Churilov and A. Flitman, Computers & Operations Research 33, 2057-2082 (2006).
- [5] R.T. Stefani, Survey of the major world sports rating systems, Journal of Applied Statistics 24, 635-646 (1997).
- [6] G.K. Zipf, Human Behavior and the Principle of Least Effort : An Introduction to Human Ecology (Cambridge, Mass.: Addison Wesley, 1949).
- [7] J. Park and M.E.J. Newman, A network-based ranking system for US college football, J. Stat. Mech. Theory Exp. P10014 (2005).
- [8] X. Gabaix, Zipf’s law for cities: An explanation, The Quarterly Journal of Economics 114, 739-767 (1999).
- [9] G. Brakman, H. Garretsen, C. van Marrewijk, and M. van den Berg, The Return of Zipf: Towards a Further Understanding of the Rank-Size Distribution, Journal of Regional Science 39, 182-213 (1999).
- [10] D.R. Vining, Jr., The rank-size rule in the absence of growth, Journal of Urban Economics 4, 15-29 (1977).
- [11] J.-C. Córdoba, On the distribution of budget sizes, Journal of Urban Economics 63, 177-197 (2008).
- [12] Yanguang Chen, The rank-size scaling law and entropy-maximizing principle, Physica A 391, 767-778 (2012).
- [13]
- [14]
- [15] .
- [16]
- [17]
- [18] M. Ausloos, A. Gadomski and N.K. Vitanov, unpublished
- [19]
- [20] P. Wessa, Kendall Rank Correlation (v1.0.11) in Free Statistics Software (v1.1.23-r7), Office for Research Development and Education, (2012).
- [21] A. Gadomski, Kinetic Approach to the Nucleation-and-Growth Phase Transition in Complex Systems, Nonlinear Phenomena in Complex Systems 3 321-352 (2000).
- [22] C. Hannay, R. Cloots, and M. Ausloos, Terrace structures in DyBa2C3O7-x grown in a magnetic field, Solid State Communications, 83, 349-354 (1992).
- [23] B. Guillaume, F. Boschini, I. Garcia-Cano, A. Rulmont, R. Cloots, and M. Ausloos, Optimization of BaZrO3 sintering by control of the initial powder size distribution; a factorial design statistical analysis, Journal of the European Ceramic Society, 25, 3593-3604 (2005).
- [24] A. Gadomski, Comment on How skew distributions emerge in evolving systems, Europhysics Letters 89, 40002 (2010).