Religious affiliation, education and Internet use
Abstract
Using data from the General Social Survey, we measure the effect of education and Internet use on religious affiliation.
We find that Internet use is associated with decreased probability of religious affiliation; for moderate use (2 or more hours per week) the odds ratio is 0.82 (CI 0.69–0.98, ). For heavier use (7 or more hours per week) the odds ratio is 0.58 (CI 0.41–0.81, ).
In the 2010 U.S. population, Internet use could account for 5.1 million people with no religious affiliation, or 20% of the observed decrease in affiliation relative to the 1980s. Increases in college graduation between the 1980s and 2000s could account for an additional 5% of the decrease.
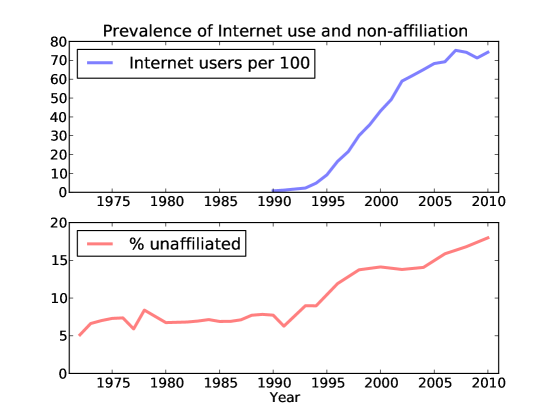
From 1990 to 2010 the fraction of people in the United States with no religious preference increased from 8% to 18%, based on data from the General Social Survey (GSS). At the same time, the fraction of Protestants dropped from 62% to 51%; the fraction of Catholics and Jews did not change significantly; the fraction of other religions increased from 3.3% to 4.2%.
During the same period, the prevalence of Internet use increased from essentially zero to nearly 80%. Figure 1 shows Internet users per 100 people and the fraction of the population with no religious preference. Also during this period, the fraction of the population graduating from college increased from 17% to 27%.
In this paper we explore the effect of increases in college education and Internet use on religious affiliation.
Of course there are other factors that might contribute to religious disaffiliation. Hout and Fischer investigate this trend (through 2000) and identify as causes political beliefs and generational effects, including a decrease in the fraction of people raised with no religion [1].
Smith and Kim study the decline in the Protestant majority, identifying as causes a decline in “the intergenerational retention rate for Protestants, … shifts in immigration, [and] an increasing share of people identifying as generic Christians.” [5].
Schwadel studies generational effects, especially people raised with no religion [3], and the effect of education [4].
Vargas investigates the effect of “political attitudes, religious skepticism, life stressors, and sociodemographic characteristics,” and finds that “each is associated with … leaving religion, but not necessarily in … expected directions.” [6].
Wilcox et al investigate the differential decline among the high school graduates, relative to college graduates, and identify as causes “economic characteristics, current and past family characteristics, and attitudes toward premarital sex [7].
Although prior studies have identified factors associated with disaffiliation, none have quantified what fraction of the observed change can be attributed to each factor. We believe that this is the first study to show that Internet use is associated with disaffiliation, and to estimate the magnitude of the effect.
1 Methodology
We selected the following variables from the General Social Survey (GSS), available from http://www3.norc.org/gss+website/:
- RELIG
-
: “What is your religious preference?”
- RELIG16
-
: “In what religion were you raised?”
- AGE
-
: Respondent’s age when surveyed.
- YEAR
-
: Year of survey.
- EDUC
-
: “What is the highest grade in elementary school or high school that you finished and got credit for?”
- INCOME
-
: “In which of these groups did your total family income, from all sources, fall last year before taxes, that is?”
- SEI
-
: Respondent socioeconomic index (computed by GSS based on respondent’s occupation).
- SRCBELT
-
: Classification of respondent’s metropolitan statistical area as urban, suburban or rural (coded by GSS based on location of interview and U.S. Census data).
- WWWHR
-
: “Not counting e-mail, about how many minutes or hours per week do you use the Web?”
- COMPWT
-
: Respondent’s computed sample weight. All statistics reported in this paper reflect these weights.
We use data from GSS survey years 2000, 2002, 2004, 2006 and 2010. In 2008 questions about Internet use were not asked.
These survey years include 14 948 respondents. By the design of the GSS, not all respondents are asked all questions. We excluded respondents who were not asked or did not answer one or more of the relevant questions, yielding 8951 respondents.
Using Python programs available from https://github.com/AllenDowney/internet-religion, we compute the following recoded variables:
- has_relig
-
: 1 if the respondent reported any religious affiliation when interviewed as an adult, or 0 if the respondent reported ”None”.
- had_relig
-
: 1 if the respondent reported being raised in a religion, 0 otherwise.
- top75_income
-
: 1 if the respondent reports annual household income of $25,000 or more, which is the highest bracket in the survey. About 75% of respondents exceed this threshold.
- born_from_1960
-
: year the respondent was born minus 1960 (subtracting 1960 makes it easier to interpret the results of the regression).
- educ_from_12
-
: number of years of school completed, minus 12; so 0 indicates a high school graduate; 4 or more indicates a college graduate.
- www2
-
: 1 if the respondent reports using the Internet 2 of more hours per week, 0 otherwise. 53% of respondents exceed this threshold.
- www7
-
: 1 if the respondent uses the Internet more than 7 hours per week, 0 otherwise. 25% of respondents exceed this threshold.
We compute logistic regressions with has_relig as the dependent
variable; had_relig, top75_income,
born_from_1960 and educ_from_12 are control variables.
We also ran regressions with control variables based on SEI and
and SRCBELT, but they were not statistically significant and
they had negligible effect on the coefficients of the other
variables.
2 Results
Table 1 shows results from Model 1, which estimates the effect of
Internet use after controlling for religious upbringing, income, year
born, and education. For born_from_1960 the odds ratio is for
someone born in 1970, relative to someone born in 1960. For
educ_from_12 the odds ratio is for a college graduate relative
to a high school graduate.
| Variable | Odds ratio | Probability | p-value |
|---|---|---|---|
(Intercept) |
0.79 (0.65, 0.97) | 44 (39, 49) | 0.012 |
had_relig |
11 (8.8, 13) | 89 (88, 91) | * |
top80_income |
1.3 (1.1, 1.4) | 91 (90, 92) | 0.002 |
born_from_1960 |
0.8 (0.77, 0.83) | 89 (88, 91) | * |
educ_from_12 |
0.82 (0.74, 0.91) | 87 (86, 89) | * |
www2 |
0.77 (0.66, 0.88) | 84 (83, 85) | * |
Odds ratios can be difficult to interpret; the cumulative probabilities are intended to help. If we start with a hypothetical person raised with no religion, with income in the lowest quintile, born in 1960, with high school education but no college, and low Internet use (less than 2 hours per week), the probability that this person has a religious affiliation as an adult is 44%. Now we change one variable at a time:
-
•
If this person had been raised in some religion, that would increase the chance of religious affiliation to 89%
-
•
If this person’s income were in the top 75%, that would increase the chance of religious affiliation to 91%
-
•
If (in addition) this person were born 10 years later (in 1970) the chance would drop to 89%.
-
•
If (in addition) this person went to college, the chance would drop to 87%.
-
•
If (in addition) this person used the Internet 2 or more hours per week, the chance would drop to 84%.
2.1 Multiple levels of Internet use
Internet use and affiliation show a “dose-response” relationship where increasing levels of use yield higher levels of response.
| Variable | Odds ratio | Probability | p-value |
|---|---|---|---|
(Intercept) |
0.79 (0.65, 0.97) | 44 (39, 49) | 0.011 |
had_relig |
11 (8.8, 13) | 89 (88, 91) | * |
top80_income |
1.3 (1.1, 1.4) | 91 (90, 92) | 0.002 |
born_from_1960 |
0.8 (0.77, 0.84) | 89 (88, 91) | * |
educ_from_12 |
0.83 (0.74, 0.92) | 87 (86, 89) | * |
www2 |
0.88 (0.75, 1) | 86 (85, 87) | 0.062 |
www7 |
0.74 (0.64, 0.88) | 82 (80, 84) | * |
Model 2, presented in Table 2, includes two levels of Internet use,
web2 and web7. In this model, web2
is not statistically significant, but the model as a whole is
significantly better than Model 1 augmented with an additional random
variable (p=0.05). To compare models, we use the self-information of
partitioning (see Methodological Notes, below).
2.2 Subgroups
The effect of Internet use is easiest to demonstrate for people with a religious upbringing.
We divide the sample into people raised with and without religion. Among 686 people raised with no religion, the effect of Internet use is small and not statistically significant (odds ratio 0.94, ). Thus the effect may be smaller, or just less apparent due to small sample size.
| Variable | Odds ratio | Probability | p-value |
|---|---|---|---|
(Intercept) |
8.5 (7.3, 10) | 90 (88, 91) | * |
top80_income |
1.3 (1.1, 1.6) | 92 (91, 93) | * |
born_from_1960 |
0.83 (0.79, 0.86) | 90 (89, 92) | * |
educ_from_12 |
0.8 (0.71, 0.89) | 88 (87, 90) | * |
www2 |
0.82 (0.69, 0.98) | 86 (85, 88) | 0.01 |
www7 |
0.71 (0.6, 0.83) | 81 (80, 83) | * |
Table 3 shows the result of Model 2 applied to 8265 people raised with
some religion. Both web2 and web7 are statistically
significant, and their effect is slightly stronger than in the
combined population.
Combining web2 and web7, heavy Internet use has an odds
ratio of 0.58 and, for the hypothetical case above, decreases the
probability of religious affiliation by 7 percentage points.
3 Explaining changes in disaffiliation
The prevalence of people with no religious affiliation has increased substantially since 1990. Based on GSS respondents partitioned by decade, the fraction of people in the U.S. with no religious affiliation was 7.1% in the 1980s, 10.2% in the 1990s, and 15.3% in the 2000s. The difference between the 1980s and the 2000s is 8.2 percentage points, or 25 million people in the 2010 population (309 million according to the U.S. Census).
We can use models from the previous section to estimate how much of this change can be attributed to each contributing factor:
-
•
Not surprisingly, the factor with the strongest effect on religious affiliation is religious upbringing, and the number of people raised without religion is increasing, from 3.3% in the 1980s to 5.0% in the 1990s and 7.7% in the 2000s.
-
•
College education decreases the chance of religious affiliation, and the prevalence of college eduction is increasing. The fraction of people in the U.S. with 16 or more years of education was 17.4% in the 1980s, 24.4% in the 1990s and 27.2% in the 2000s.
-
•
Internet use decreases the chance of religious affiliation; in the 2010s, 53% of the population used the Internet at least 2 hours per week, and 25% more than 7 hours. Internet use in the 1980s was essentially zero.
-
•
Even controlling for education and Internet use, there is a strong generational effect; people born later are less likely to be affiliated. Part of the observed change can be attributed to generational replacement.
To estimate the effect of each factor, we simulate a counterfactual world where the prevalence in the 2010s is the same as in the 1980s. As a baseline, we use Model 2 to fit, for each respondent, the probability of having a religious affiliation, and add up the total probability.
To evaluate the effect of religious upbringing, we use Model 2 and the
data from the 2000s. We modify has_relig for randomly-selected
respondents so that the prevalence of religious upbringing is at the
level seen in the 1980s. In this counterfactual world, there would be
an additional 6.3 million people with religious affiliation (95% CI
5.7–7.1), compared to the baseline model. So changes in religious
upbringing account for 25% of the observed increase of 25 million.
To quantify the effect of the increase in of college education, we
modify educ_from_12 to simulate educations patterns from the
1980s. We find that the increase in college education accounts for
1.3 million of the disaffiliated (95% CI 0.8–1.9), or 5% of the
observed increase.
To simulate a world with no Internet use, we set wwwhr to 0 for
all respondents. We find that Internet use accounts for 5.1 million
people with no religious affiliation (95% CI 1.8–7.2), or 20% of
the observed increase.
To estimate the effect of generational replacement, we simulate an
earlier cohort by subtracting 20 years from born_from_1960. In
this counterfactual world, an additional 13.4 million people would be
affiliated, or 53% of the observed change.
In summary, the impact of Internet use is comparable to the effect of religious upbringing, and about 4 times greater than the effect of college (and post-graduate) education. In total, these three effects account for 50% of the observed increase.
The remainder of the change is accounted for by generational replacement, although this explanation is unsatisfying because year of birth cannot, itself, be a causal factor. So about half of the observed change remains unexplained.
4 Discussion
We have identified three factors that are statistically associated with religious affiliation: religious upbringing, education and Internet use. This association does not prove causation; if A and B are associated, it is possible that A causes B, B causes A, or a third factor causes both A and B.
Religious upbringing is by far the strongest explanatory variable, and it seems likely that, in fact, religious upbringing causes religious affiliation. First, it is impossible for religious affiliation as an adult to cause religious upbringing (although it might color the way respondents report their upbringing). Second, it is hard to imagine a third factor that would cause both. Finally, it is easy to imagine the mechanism by which religious instruction could lead to lifelong affiliation.
For college education, it is less obvious that the relationship is
causal, but we can make several supporting arguments. Again, it is
not possible that religious affiliation as an adult causes college
graduation in the past. On the other hand, it is easy to imagine that
religious upbringing might affect both. We can test that possibility
by running a regression with college as the dependent variable
and explanatory variables had_relig, top75_income,
born_from_1960, sei, urban, rural.
We find that the effect of religious upbringing on college graduation is small, positive, and borderline statistically significant (odds ratio 1.2, ). So even if religious upbringing affects college graduation, it does not explain the negative relationship between college education and religious affiliation or the decrease in religious affiliation over time. Finally, it is easy to imagine mechanisms by which the experience of attending college might decrease the chance of religious affiliation.
Similarly, it is easy to imagine at least two ways Internet use could contribute to disaffiliation. For people living in homogeneous communities, the Internet provides opportunities to find information about people of other religions (and none), and to interact with them personally. Also, for people with religious doubt, the Internet provides access to people in similar circumstances all over the world. Conversely, it is harder (but not impossible) to imagine plausible reasons why disaffiliation might cause increased Internet use.
Again, it is possible that religious upbringing might have a causal
connection with Internet use, yielding a spurious relationship
between Internet use and affiliation.
We can test that possibility by running a
regression with www2 as the dependent variable and explanatory
variables had_relig, top75_income,
born_from_1960, sei, urban, rural. We
find that the effect of religious upbringing on Internet use is small,
positive, and not statistically significant (odds ratio 1.1,
). It is unlikely that religious upbringing has a negative
effect on Internet use large enough to explain the
relationship between Internet use and affiliation.
Although a third unidentified factor could cause both disaffiliation and Internet use, we have controlled for most of the obvious candidates, including income, education, socioeconomic status, and rural/urban environments. Also, in order to explain changes over time, this third factor would have to be new and rising in prevalence, like the Internet, during the 1990s and 2000s (see Figure 1). It is hard to imagine what that factor might be.
5 Conclusions
Someone who has taken an introductory statistics class might insist that correlation does not imply causation, and that is a useful reminder. Nevertheless, correlation does provide evidence in favor of causation, especially when we can eliminate alternative explanations or have reason to believe that they are less likely.
So until there is another explanation for the associations reported here, it is reasonable to conclude, at least tentatively:
-
•
Religious upbringing increases the chance of religious affiliation as an adult. Decreases in religious upbringing between the 1980s and 2000s account for about 25% of the observed decrease in affiliation.
-
•
College education decreases the chance of religious affiliation. Increases in college graduation between the 1980s and 2000s account for about 5% of the observed decrease in affiliation.
-
•
Internet use decreases the chance of religious affiliation. Increases in Internet use since 1990, from 0 to nearly 80% of the general population, account for about 20% of the observed decrease in affiliation.
The remaining 50% of the decrease in religious affiliation is accounted for by generational replacement, but this “explanation” only raises the question of why, even after accounting for education and Internet use, people born later are more likely to disaffiliate.
6 Limitations
The GSS data imposes some limitations on our analysis.
-
•
In the cumulative GSS dataset, annual income is reported in 11 bins between $1000 and $25000, and one bin for higher incomes. Since 75% of respondents fall into the highest bin, we cannot measure the effect of higher incomes, if any.
However, we used GSS individual year datasets to obtain income data with a wider range, and checked whether income in the other quartiles had an effect on disaffiliation. We tested variables set at the 50th and 75th percentiles of income, but found that neither contributed an effect that was statistically significant, and adding these variables had almost no effect on the coefficients of the other variables.
Other studies have found the same relationship: people in low income brackets are less likely to have a religious affiliation, but there are no statistical differences among the other brackets[2].
We conclude that the income variable we used is sufficient to control for the effect of income on affiliation.
-
•
By design, the GSS does not ask all questions to all respondents. Out of 14 948 respondents only 8951 were asked and answered all questions included in our Models 1 and 2. This selection process introduces some small biases. Respondents with complete records were slightly less likely to have a religious affiliation (84.2% compared to 84.9%), more likely to be in the top three income quartiles (75.3% compared to 73.0%), more likely to have graduated from college (31% compared to 27%), and about a year older.
Although the selected sample differs in some ways from the general population, it is unlikely that this selection bias has a substantial effect on the relationships reported in this paper.
-
•
In 2010 the GSS used a new protocol to screen questions about Internet use. As a result, it is not possible to analyze changes in Internet use after 2006. The same protocol is being used in 2012, so the next data point for time series analysis will be available in 2015 at the earliest.
7 Methodological notes
Confidence intervals and p-values in this paper are estimated by resampling, which relies on minimal assumptions. We draw random samples from the observed sample, using respondent weights so that each generated sample is representative of the general population. We compute regressions for 1001 generated samples and compute the median, 95% confidence interval, and p-value for each parameter.
To compare models, we use the self-information of partitioning (SIP) to compute the total surprisal of each model. For example, if the model predicts that the probability of the dependent variable for the th respondent is and we learn that the actual value is 1, we have learned bits of information. If we learn that the actual value is 0, that’s bits.
So if we compute fitted values of and then learn the actual data, the total number of bits we learn is:
With a perfect model and the total information of the data is 0. As the quality of the model decreases, the information remaining in the data increases. So the better model is the one that leaves less information in the data.
To adjust for the number of parameters, we compare each model to a baseline that contains the same number of parameters, but where the explanatory variables have been replaced with random values.
Details of these methods are in the comments and code available from https://github.com/AllenDowney/internet-religion.
References
- [1] M. Hout and C.S. Fischer. Why more americans have no religious preference: Politics and generations. American Sociological Review, pages 165–190, 2002.
- [2] Pew Forum on Religion and Public Life. U.S. religious landscape survey: Religious affiliation: Diverse and dynamic. 2008.
- [3] P. Schwadel. Period and cohort effects on religious nonaffiliation and religious disaffiliation: A research note. Journal for the Scientific Study of Religion, 49(2):311–319, 2010.
- [4] P. Schwadel. The effects of education on americans’ religious practices, beliefs, and affiliations. Review of Religious Research: The Official Journal of the Religious Research Association, pages 1–22, 2011.
- [5] T.W. Smith and S. Kim. The vanishing protestant majority. Journal for the Scientific Study of Religion, 44(2):211–223, 2005.
- [6] N. Vargas. Retrospective accounts of religious disaffiliation in the united states: Stressors, skepticism, and political factors. Sociology of Religion, 2011.
- [7] W.B. Wilcox, A.J. Cherlin, J.E. Uecker, and M. Messel. No money, no honey, no church: The deinstitutionalization of religious life among the white working class. Research in the Sociology of Work, 23:227–250, 2012.