Link aggregation process for modelling weighted mutualistic networks
Abstract
Mutualism is a biological interaction mutually beneficial for both species involved, such as the interaction between plants and their pollinators. Real mutualistic communities can be understood as weighted bipartite networks and they present a nested structure and truncated power law degree and strength distributions. We present a novel link aggregation model that works on a strength-preferential attachment rule based on the Individual Neutrality hypothesis. The model generates mutualistic networks with emergent nestedness and truncated distributions. We provide some analytical results and compare the simulated and empirical network topology. Upon further improving the shape of the distributions, we have also studied the role of forbidden interactions on the model and found that the inclusion of forbidden links does not prevent for the appearance of super-generalist species. A Python script with the model algorithms is available.
I Software Availability
The algorithm for the Mutualistic Link Model and several analysis functions are available on a Python script downloadable from our webpage.
Name of software: Mutualink.
Developer: Manuel Jiménez-Martín.
Language: Python 2.7 (requires numpy, scipy, pylab and matplotlib modules).
Contact address: Dept. Ciencia y Tecnología aplicadas a la I.T. Agrícola, E.U.I.T. Agrícola. Universidad Politécnica de Madrid. Ciudad Universitaria, s/n, 28040, Madrid. Spain
E-mail address: manuel.jimenez@bec.uned.es
URL: http://hypatia.agricolas.upm.es/JJ_lab/mutualink.html
II Introduction
It is estimated that close to 40% of angiosperm plants, from crops to tropical trees, are self-incompatible and depend on mutualistic interactions with animals to complete their life cycles Igic et al. (2008); Klein et al. (2007). In these ecological interactions such as the interplay between plants and their pollinators or seed-dispersers, both involved species obtain mutual benefits Jordano (2000); Bascompte (2009). The essential role of these mutualistic interactions in the biodiversification and coevolution processes has been discussed in depth in the ecological literature Bastolla et al. (2009). Although exclusive pairwise interactions between two species exist in nature, the majority of species distribute their interactions among several different mutualistic partners. Thus, most ecosystems exhibit an intricate pattern of mutualistic relationships among their species that can be represented as a bipartite complex network with two disjoint sets of nodes representing animal and plant species, and . The complex network approach allowed the study of mutualism at community level, revealing the enormous relevance of community structure onto the ecological and coevolutionary processes of ecosystems. The structure and properties of mutualistic networks, such as nestedness and truncated distributions, have been thorougly studied during the last decade Bascompte (2003); Jordano et al. (2003).
Mutualistic communities can be studied as weighted bipartite networks where interactions between species are represented as weighted links between and nodes. All network information is included in the quantitative interaction matrix W where element represents the observed frequency of interaction between species and Gilarranz et al. (2012); Olesen et al. (2011). Species can be characterized by their degree -i.e. the number of species with whom they interact- and by their strength -i.e. the sum of the weights of their links: and . Both magnitudes are correlated in mutualistic networks Vázquez and Aizen (2003); Gilarranz et al. (2012) meaning that species with a high number of interaction partners interact more frequently than less connected species. Species with high and values are called generalists as opposite to those with lower and which are called specialists.
Mutualistic networks exhibit scale-free behaviour with cut-offs in both degree and strength distributions for both classes of nodes Jordano et al. (2003); Gilarranz et al. (2012). This means that there is not one big hub or super-generalist that would accumulate the majority of interactions of the network. This role is instead diluted among several generalist species. Given the fact that mutualistic networks have a few hundreds of nodes at most, truncations have been considered to be finite size effects on an otherwise scale-free topology Amaral et al. (2000). An alternative interpretation for the cause of the truncations is the existence of forbidden links Jordano et al. (2003): It is well known that morphological or phenological constraints among species limit the number of interactions observed in the network Olesen et al. (2011). Regarding the connectivity pattern, generalists tend to interact strongly with generalists forming a dense core of interactions that acts as the backbone of the network. Most specialists interact mainly with generalists from the core while specialist-specialist interactions are rare and weak. The generalist core provides alternative paths between species and allows the network to remain functional upon extintions of specialists. Remarkably, interaction partners of any given or species usually fall into a subgroup of the interaction partners of the next more connected species. This pervasive architecture is called nestedness Vázquez and Aizen (2003); Bascompte et al. (2006). Ordering the rows and columns of W from generalist to specialist, nestedness appears as a triangular-like pattern of interactions that can be expressed mathematically with the condition
| (1) |
There are several metrics to quantify nestedness and the nested pattern have been found to be statistically significant for the vast majority of recorded cases Almeida-Neto and Guimarães (2008); Galeano et al. (2009); Almeida-Neto and Ulrich (2011); Allesina (2012). Truncated distributions and nestedness constitute the two main features of mutualistic networks and have been reported in mutualistic communities for every kind of ecosystem, from arctic tundra to tropical forest. While the benefits of mutualistic network architecture are well understood, the mechanisms leading to the formation of mutualistic networks are still the subject of speculation Medan et al. (2007); Guimarães et al. (2007); Maeng et al. (2012).
Considering information on species population gives new insight. It is known that species degree, strength and abundance are correlated in mutualistic communities Vázquez and Aizen (2003); Gilarranz et al. (2012). A high degree implies higher reproductive benefits for the species which translates into a higher species population and therefore more frequent interactions, leading to a higher species strength. Taking account of this fact, the Individual Neutrality hypothesis Vázquez et al. (2005); Vázquez (2005); Vazquez et al. (2005) affirms that mutualistic network topology can be explained to a great extent by considering population information and random interaction between individuals. This means that interaction probability is considered to be proportional to species abundance, ignoring any kind of morphological or phenological preference between interacting species. It was recently shown that quantitative nestedness can be explained as a mere mass effect Allesina (2012) considering species population. It is the aim of this article to extend this idea showing that both nestedness and truncated distributions may emerge from simple rules considering population effects.
In this article we present a network growth model based on individual neutrality that succesfully generates realistic mutualistic networks exhibiting both truncated distributions and nestedness. Shifting the focus from species towards individuals ultimately means to describe the network growth at the level of individual links. In contrast to previous node aggregation binary models, our model constructs weighted networks by means of a unitary link aggregation process. The article is structured as follows: Firstly, the model description along with some analytical results are presented on section III. We have then compared the simulated network topology with 9 empirical datasets on section IV.1. In section IV.2 we study the effect of forbidden links on the model. Finally, section V is devoted to the conclusions.

III Materials and Methods
On the basis of the individual neutrality hypothesis, our model simulates the formation of mutualistic networks as a dynamical link aggregation process. Our main assumption is that every individual on the ecosystem participates on just one single interaction with an individual of the opposite class. Such unitary interactions are incorporated to the network as a single link of weight equal to . Consequently, on our model species population is equal to species strength . Thus, the individual neutrality hypothesis resut on a strength-preferential attachment process, since the interaction probability is proportional to species population, i.e. strength. Both end-nodes of an incoming link are selected independently with probabilty proportional to each species strength. It is also possible to select a disconnected node (species with strength zero) with probability given by some function . This accounts for the arrival of a new species of class ( or ) into the ecosystem. Every time-step a unitary link is added to the network so the number of links acts as a time-variable: .
Only three input parameters are needed: number of animal species , number of plant species and total network weight . The algorithm is as follows. Initially, all of the possible interactions have weight zero. Starting with a completely connected seed of 4 nodes (2 of each class), every time-step an unitary interaction is incorporated to the network according to the following rules:
-
1.
Firstly we check for the appearance of a new species of each class in the ecosystem. A disconnected node will be selected with probability , where stands for classes A and P.
-
2.
Otherwise, an already connected node will be selected via strength-preferential attachment with probability .
-
3.
After determining both end-nodes of the incoming link, the weight of the resulting interaction is increased in one unit.
The process is repeated until the final weight of the network is reached, . The final size of the network and its topology depends on the specific functional form of the birth functions . It seems reasonable to consider the appearance of a new species being less likely as the number of species grows due to limited resources and space. For the sake of simplicity we have considered the following form:
| (2) |
where the are parameters. Note that only depends on the current number of species of its own class, so the growth processes for each class are uncoupled. This is of course a heavy assumption. Certainly, there are many conceivable choices for the birth functions. This specific form is simple enough to draw analytic results and it produces network topologies similar to those observed in real mutualistic communities.
The weights can be expressed as a function of the network parameters and allow to simulate networks of any desired size . The necessary time for to increase one unit is . Summing up to number of species and weight we arrive to the following expression
| (3) |
This relationship holds at every time-step. Substituting the network parameters we finally get:
| (4) |
| Network | |||||||||
|---|---|---|---|---|---|---|---|---|---|
| N1 Blüthgen and Fiedler (2004) | Blüthgen et al. (2004) | 644 | 285 | 41 | 51 | 1.27 | 1.98 | 2091 | 0.14 |
| N2 Memmott (1999) | Memmott (1999) | 2183 | 299 | 79 | 25 | 1.41 | 0.14 | 1975 | 0.15 |
| N3 Barrett and Helenurm (1987) | Barret & Helenurm (1987) | 550 | 167 | 102 | 12 | 9.37 | 0.12 | 1224 | 0.14 |
| N4 Elberling and Olesen (1987) | Elberling & Olesen (1999) | 383 | 238 | 118 | 23 | 18.02 | 0.66 | 2714 | 0.09 |
| N5 Kato et al. (1990) | Kato et al. (1990) | 2384 | 1202 | 678 | 89 | 96.27 | 1.64 | 60342 | 0.02 |
| N6 Inouye and Pyke (1988) | Inouye & Pyke (1988) | 1459 | 281 | 91 | 42 | 2.81 | 0.59 | 3822 | 0.07 |
| N7 Schleuning et al. (2011) | Schleuning et al. (2010) (1) | 3447 | 419 | 88 | 33 | 1.11 | 0.15 | 2904 | 0.14 |
| N8 Schleuning et al. (2011) | Schleuning et al. (2010) (2) | 3081 | 288 | 71 | 15 | 0.81 | 0.03 | 1065 | 0.27 |
| N9 Schleuning et al. (2011) | Schleuning et al. (2010) (5) | 2802 | 283 | 71 | 19 | 0.89 | 0.06 | 1349 | 0.21 |
Since the node birth process is equivalent for both classes, in the subsequent we will drop the subindices. Also, we will express the number of species at time t as . Now, we will prove that our model generates strength scale-free strength distributions for large enough networks. The change in the number of nodes of strength at time is equal the number of nodes with strength receiving a link minus the number of nodes of strength receiving a link. The rate equation is
| (5) |
where is the number of nodes the corresponding class present in the network at time and is the node probability for having strength s at time t. Using equation 3, we can express the number of as
| (6) |
when . Assuming that the strength probability distribution will reach stationarity for large enough times we can approximate and arrive to the following recurring relation
| (7) |
where . Developing equation 7 we finally arrive to a power law expression for the strength distribution.
| (8) |
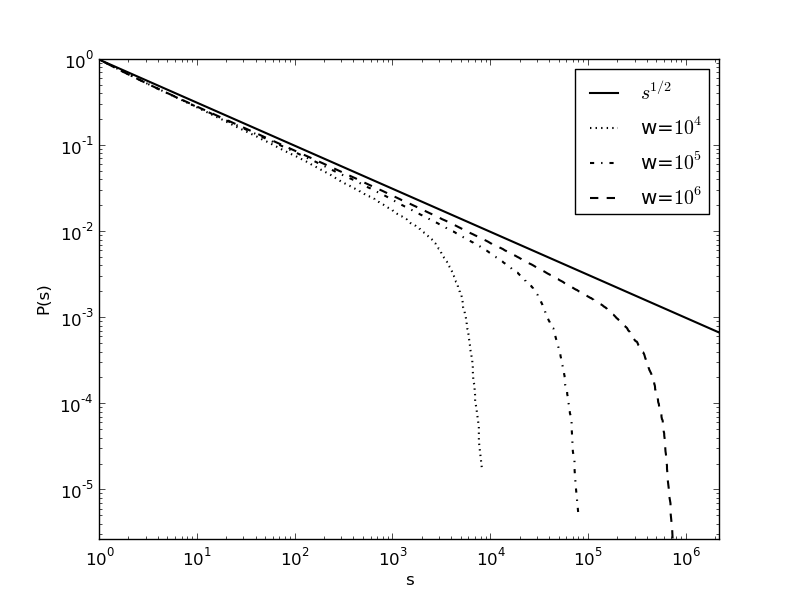
where we have used the following relationship for Euler Gamma functions: Tricomi and Erdélyi (1951). Hence, the individual interaction aggregation process with strength-preferential attachment generates networks with scale-free strength distribution in the limit of large networks. A known result for power-law distributions states that the exponent of the cumulative distribution must be unit larger Aaron Clauset and Newman (2009), giving an exponent of for the cumulative strength distribution. Figure 2 shows the shape of the cumulative strength distribution of increasingly large networks tending towards the theoretical value of and the truncations observed on the finite network strength distributions are finite size effects.
IV Results and Discussion
IV.1 Simulation results
We have studied the topology of 9 empirical networks as well as their simulated counterparts generated by the model. The datasets depicted in table 1 were extracted from the Interaction Web Database • ‣ VII. For each real network we run the model times with the corresponding input parameters , and . We then computed the average nestedness, as well as the average strength and degree cumulative distributions.
| NODF | N1 | N2 | N3 | N4 | N5 | N6 | N7 | N8 | N9 |
|---|---|---|---|---|---|---|---|---|---|
| Empirical | 43.51 | 42.84 | 30.78 | 15.28 | 7.67 | 17.22 | 34.58 | 51.15 | 45.83 |
| Simulated | 49.06 | 65.80 | 57.99 | 40.22 | 28.69 | 55.76 | 65.66 | 67.47 | 67.64 |
The standard NODF metric Almeida-Neto and
Guimarães (2008) was computed to quantify nestedness (table 2). Along with it, p-values were calculated in order to assess the statistical significance of the results against random permutation of matrix elements. All networks, both real and simulated, exhibit highly significative nestedness, , although index values are always higher for simulated networks. The highly nested structure of the simulated networks is a consequence of the strength-preferential attachment rule. In our model, nestedness emerges from simple interaction rules: random interactions between individuals and interaction probability proportional to species population. Despite the qualitative success there are differences between real networks and the networks generated by the model. Compared to empirical mutualistic networks, simulated networks are closer to perfect nestedness, i.e. a higher number of links fulfill the nestedness condition expresed by equation 1. The simulated networks exhibit a very compact generalist core where basically every possible interaction between generalist species is present. On the other hand, real mutualistic networks show a more dispersed core with some holes and slightly smaller link weights. Real networks are also noisier and they show a higher number of specialist-specialist interactions that are not present on the simulated networks. This is better understood examining the degree and strength distributions.
Figures 3 and 4 represent the average cumulative strength and degree distributions for the simulated networks along with the real data. The distributions are shown separately for each class and . Exponential truncations are observed for the simulated strength distribution. These are merely a consequence of the finite size of the system since the model generates scale-free strength distributions in the limit of large networks as demonstrated in the previous section. It can be observed how the simulated distributions approach the theoretical exponent on on the heavier networks (networks , and ). Remarkably, although node degree does not come into play in the network growth process, an exponential decay also appears in the degree distributions. This supports the hypothesis that the well-known binary network topology may arise from random individual encounters. However, there exist some discrepancy with the empirical datasets. For instance, cut-offs are generally higher on the simulated networks for both strength and degree distributions while the middle section of the distributions usually rest at lower values than the empirical ones, specially for the nodes (plants). Very low probability points at high strength and degree values correspond to a super-generalist species receiving a large number of connections with very high weights. This super-generalists are effectively stealing interactions from less connected species, leading to less and weaker interactions among specialists than those observed on the empirical networks. In the absence of any limiting mechanism, super-generalist arise as a consequence of the strength-preferential attachment process.
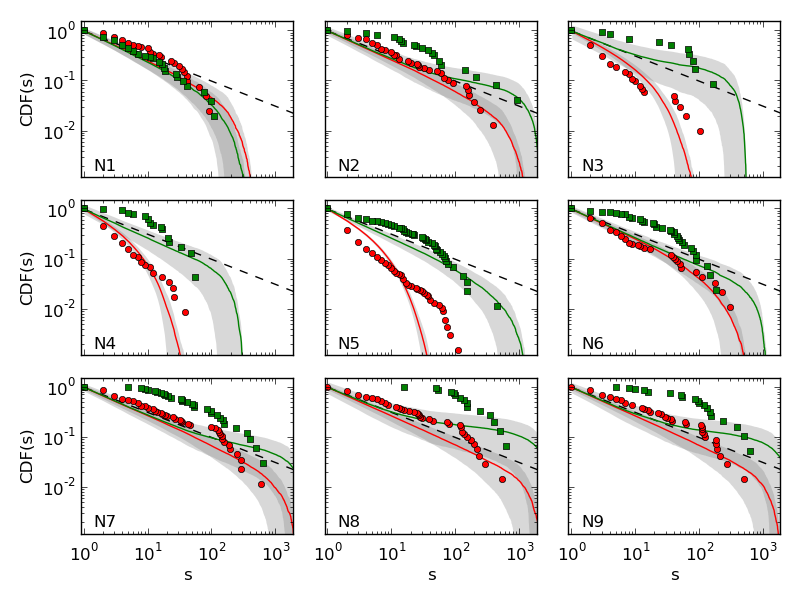
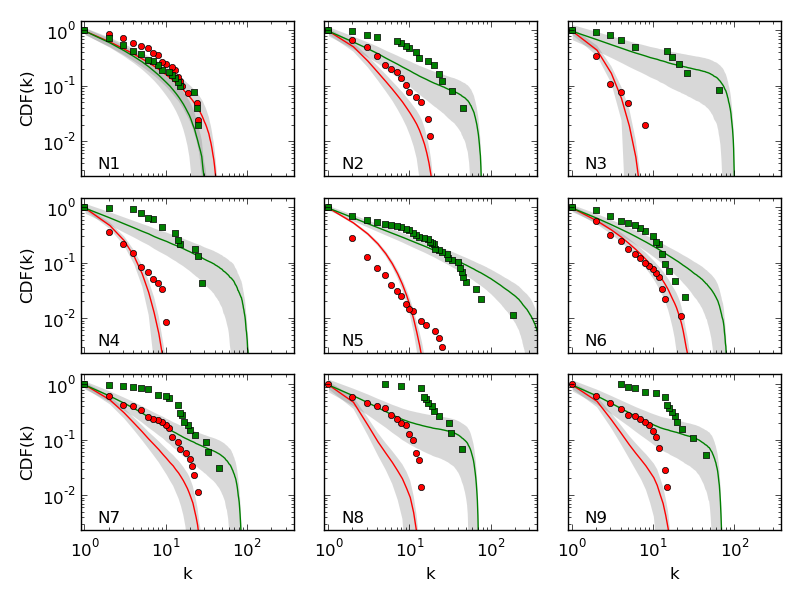
Despite the model success at qualitatively reproducing nestedness and truncated and distributions, the results are far from a quantitative match with the data from real networks. Two main disagreements between simulated and empirical networks have been pointed out: a) simulated networks exhibit a more nested structure than empirical oness, with fewer interactions not fulfilling the nested condition 1, and b) simulated networks have broader and distributions than empirical ones, with higher values of and and less number of interactions in the medium range. Both this facts are a consequence of the strength preferential attachment. Since there is no restriction on the number of links a species can receive, a super-generalist node of each class appears, taking a great amount of interactions in detriment of other less connected species, thus pushing the cut-off of the distributions to higher values. This also results in a smaller but stronger core than observed in real networks (figure 1).
IV.2 Forbidden Links
Some authors have suggested forbidden interactions as a plausible explanation for nestedness and truncated distributions. We have studied the effect of forbidden links on the topology of the model generated networks. The objective was to test the hypothetical role of forbidden links as a limiting mechanism that could prevent the appearance of supergeneralist species, lowering the distribution’s cut-offs and improving nestedness values.
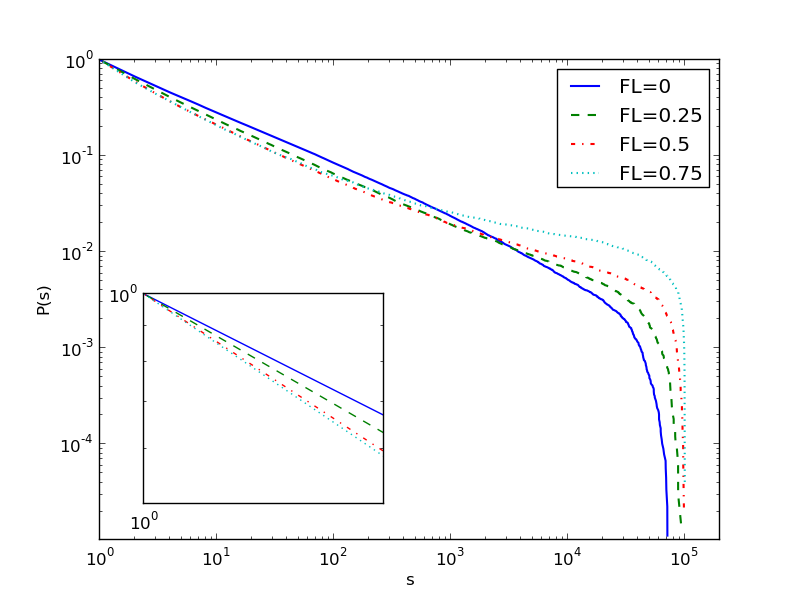
The implementation of forbidden links on the model is straightforward. A percentage of fixed forbidden interactions is selected a priori by randomly choosing forbiden elements on matrix W. Then, on algorithm step 3, once both end-nodes of the incoming interaction have been selected we test if the resulting interaction is forbidden. If this is the case, the current iteration is discarded and the process is repeated from step 1. Note that if the iteration is discarded the total weight of the network remains the same and the time variable is not increased.
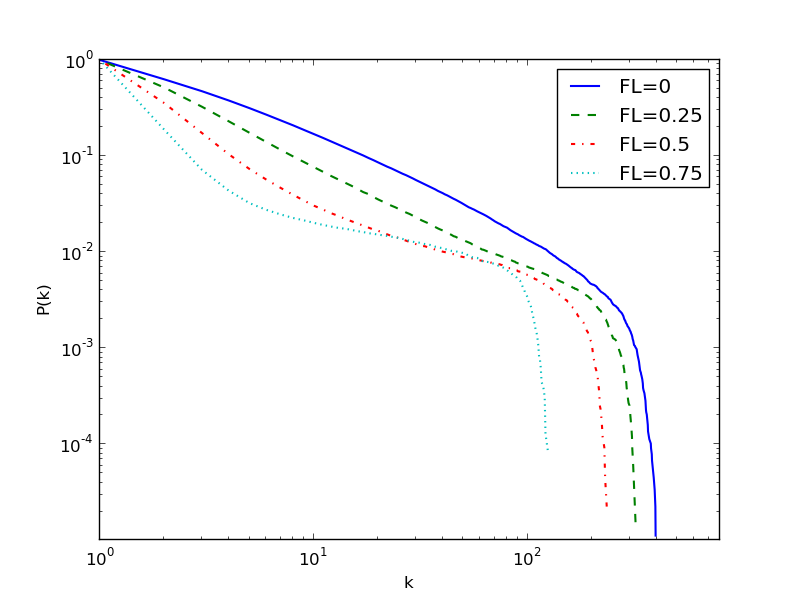
The percentage of unobserved links on empirical mutualistic communities datasets can be as high as 80% of the potential interactions Olesen et al. (2011). To explore the effect of forbidden links we run simulations on a large network to avoid finite size effects to a certain extent. We would expect an exponential cut-off on the scale free distributions caused by the forbidden links. Figure 5 shows the cumulative strength distributions for increasing values of . On the contrary to expected, introducing forbidden links not only does not lower the value of but it slightly increases it. Consequently forbidden links do not prevent from the appearance of super-generalists. However, it does increase the power law exponent for low values of , pushing downwards the middle section of the distribution. As we move towards high percentages the effect becomes more evident and the networks topology changes significatively. The shape of the resulting distribution correspond to networks with a high number of nodes receiving few low-weight links and very few strongly connected species receiving most of the network connections. The corresponding degree distributions are represented on figure 6. The power law exponent decreases noticeably with and the value of lowers drastically with . This is the consequence of a net loss of binary connections on the network. Since many binary interactions are forbidden, the growth process favours the accumulation of a great number of individual interactions on the allowed links. Increasing the percentage of forbidden links implies a severe damage to network topology, whith a not negligible quantity of interactions being erased, resulting in almost the totality of specialists being connected to one or two supergeneralists.
V Conclusions
We have presented a novel link-aggregation process for network growth based on individual neutrality. Our results support the hypothesis that an important part of mutualistic networks topology arise as a consequence of random individual encounters and that different species abundance account both for nestedness and truncated degree and strength distributions. Forbidden links do not improve the accuracy of the results but on the contrary they severly damage the network architechture. This suggests that morphological and phenological restrictions are somehow being accounted for in the probabilistic attachment rule. Its effect on the degree and strength distributions strongly discourages forbidden links as candidates for the observed exponential truncations, in favour of other hypothesis such as finite size effect.
In conclusion, our individual interaction model succeeds at reproducing the main features of mutualistic networks making use of just three input parameters while remaining simple enough to be analytically solvable. Undoubtedly, claiming to enclose all the ecological complexity of an ecosystem under such a simple mathematical process would be preposterous. Our model is missing a lot of information about the many processes happening during the development of mutualistic communities. Nonetheless, our results suggest that its underlying mechanism might be capturing some of the key ingredients leading to the formation of mutualistic networks. Further research might lead to more complicated versions of the model aiming to more precise fits to empirical data. These modifications might involve testing the effect of more realistic birth functions, considering individual deaths (link deletion) or interespecific competition.
VI Bibliography
References
- Igic et al. (2008) B. Igic, R. Lande, and J. R. Kohn, International Journal of Plant Sciences 169, 93 (2008), URL http://www.jstor.org/stable/10.1086/523362.
- Klein et al. (2007) A.-M. Klein, B. E. Vaissière, J. H. Cane, I. Steffan-Dewenterand, S. A. Cunningham, C. Kremen, , and T. Tscharntke1, Proceedings of the Royal Society B: Biological Sciences 274, 303 (2007).
- Jordano (2000) P. Jordano, Seeds: the ecology of regeneration in natural plant communities (Commonwealth Agricultural Bureau International, Wallingford, UK, 2000), chap. 6: Fruits and frugivory, pp. 125–166, 2nd ed.
- Bascompte (2009) J. Bascompte, Frontiers in Ecology and the Environment 7, 429 (2009).
- Bastolla et al. (2009) U. Bastolla, M. A. Fortuna, A. Pascual-García, A. Ferrera, B. Luque, and J. Bascompte, Nature 458, 1018 (2009).
- Bascompte (2003) J. Bascompte, Proceedings of the National Academy of Sciences of the United States of America 100, 9383 (2003), ISSN 0027-8424.
- Jordano et al. (2003) P. Jordano, J. Bascompte, and J. M. Olesen, Ecology Letters 6, 69 (2003), ISSN 1461023X.
- Gilarranz et al. (2012) L. J. Gilarranz, J. M. Pastor, and J. Galeano, Oikos 121, 1154 (2012), ISSN 00301299.
- Olesen et al. (2011) J. M. Olesen, J. Bascompte, Y. L. Dupont, H. Elberling, C. Rasmussen, and P. Jordano, Proceedings. Biological sciences / The Royal Society 278, 725 (2011), ISSN 1471-2954.
- Vázquez and Aizen (2003) D. P. Vázquez and M. Aizen, Ecology 84, 2493 (2003).
- Amaral et al. (2000) L. A. Amaral, A. Scala, M. Barthelemy, and H. E. Stanley, Proceedings of the National Academy of Sciences of the United States of America 97, 11149 (2000), ISSN 0027-8424.
- Bascompte et al. (2006) J. Bascompte, P. Jordano, and J. M. Olesen, Science (New York, N.Y.) 312, 431 (2006), ISSN 1095-9203.
- Almeida-Neto and Guimarães (2008) M. Almeida-Neto and P. Guimarães, Oikos 117, 1227 (2008).
- Galeano et al. (2009) J. Galeano, J. M. Pastor, and J. M. Iriondo, Environmental Modelling & Software 24, 1342 (2009), ISSN 13648152.
- Almeida-Neto and Ulrich (2011) M. Almeida-Neto and W. Ulrich, Environmental Modelling & Software 26, 173 (2011), ISSN 13648152.
- Allesina (2012) S. Allesina, Nature 487, 175 (2012).
- Medan et al. (2007) D. Medan, R. P. J. Perazzo, M. Devoto, E. Burgos, M. G. Zimmermann, H. Ceva, and A. M. Delbue, Journal of theoretical biology 246, 510 (2007), ISSN 0022-5193.
- Guimarães et al. (2007) P. R. Guimarães, G. Machado, M. a. M. de Aguiar, P. Jordano, J. Bascompte, A. Pinheiro, and S. F. Dos Reis, Journal of theoretical biology 249, 181 (2007), ISSN 0022-5193.
- Maeng et al. (2012) S. E. Maeng, J. W. Lee, and D.-S. Lee, Physical Review Letters 108, 108701 (2012), ISSN 0031-9007.
- Vázquez et al. (2005) D. P. Vázquez, W. F. Morris, and P. Jordano, Ecology Letters 8, 1088 (2005), ISSN 1461023X.
- Vázquez (2005) D. Vázquez, Oikos 108:2, 421 (2005).
- Vazquez et al. (2005) D. P. Vazquez, R. Poulin, B. R. Krasnov, and G. I. Shenbrot, Journal of Animal Ecology 74, 946 (2005), ISSN 0021-8790.
- Blüthgen and Fiedler (2004) N. Blüthgen and K. Fiedler, Ecology 6, 1479 (2004).
- Memmott (1999) J. Memmott, Ecology Letters pp. 276–280 (1999).
- Barrett and Helenurm (1987) S. C. H. Barrett and K. Helenurm, Canadian Journal of Botany pp. 2036–2046 (1987).
- Elberling and Olesen (1987) H. Elberling and J. M. Olesen, Ecography pp. 314–323 (1987).
- Kato et al. (1990) M. Kato, T. Makutani, T. Inoue, and T. Itino, Contr. Biol. Lab. Kyoto Univ. pp. 309–375 (1990).
- Inouye and Pyke (1988) D. W. Inouye and G. H. Pyke, Australian Journal of Ecology pp. 191–210 (1988).
- Schleuning et al. (2011) M. Schleuning, N. Blüthgen, M. Flörchinger, J. Braun, H. M. Schaefer, and K. Böhning-Gaese, Ecology 92(1), 26 (2011).
- Tricomi and Erdélyi (1951) F. Tricomi and A. Erdélyi, Pacific J. Math 1, 133 (1951).
- Aaron Clauset and Newman (2009) C. R. S. Aaron Clauset and M. E. J. Newman, SIAM review pp. 661–703 (2009).
VII Web References
-
•
Interaction Web Database. http://www.nceas.ucsb.edu/interactionweb/. Last accesed: 2013-06-30.