Present Address: ]Department of Physics, Fudan University, Shanghai, China, 200433 Present Address: ]MPA-CMMS Los Alamos National Laboratory, Los Alamos, New Mexico 87545, USA Present Address: ]Department of Physics, University of Florida, Gainesville, Florida 32611, USA Present Address: ]Institute of Solid State Physics (IFP), Karlsruhe Institute of Technology, D-76021 Karlsruhe, Germany Present Address: ]MPA-CMMS Los Alamos National Laboratory, Los Alamos, New Mexico 87545, USA Corresponding Author: ]mbmaple@ucsd.edu
Probing the superconductivity of PrPt4Ge12 through Ce substitution
Abstract
We report measurements of electrical resistivity, magnetic susceptibility, specific heat, and thermoelectric power on the system Pr1-xCexPt4Ge12. Superconductivity is suppressed with increasing Ce concentration up to , above which there is no evidence for superconductivity down to 1.1 K. The Sommerfeld coefficient increases with increasing from 48 mJ/mol K2 up to 120 mJ/mol K2 at = 0.5, indicating an increase in strength of electronic correlations. The temperature dependence of the specific heat at low temperatures evolves from roughly for = 0 to e-Δ/T behavior for = 0.05 and above, suggesting a crossover from a nodal to a nodeless superconducting energy gap or a transition from multiband to single band superconductivity. Fermi-liquid behavior is observed throughout the series in low temperature magnetization, specific heat, and electrical resistivity measurements.
pacs:
71.10.Ay, 74.25.F-, 74.62.Bf, 75.20.HrI INTRODUCTION
Filled skutterudite compounds have been the focus of numerous studies due to the wide variety of strongly correlated electron behavior they exhibit, including Kondo lattice behavior, valence fluctuations, metal-insulator transitions, various magnetically ordered states, spin fluctuations, heavy fermion behavior, non-Fermi liquid behavior, conventional BCS-type and unconventional superconductivity,Sales (2003); Bauer et al. (2002); Maple et al. (2002); MacLaughlin et al. (2002); Aoki et al. (2003); Vollmer et al. (2003); Suderow et al. (2004); Maple et al. (2005, 2007); Sato et al. (2009); Shu et al. (2009) as well as being promising candidates for thermoelectric applications.Sales et al. (1996) Filled skutterudites have the chemical formula where can be an alkali metal, alkaline earth, or rare-earth/actinide elements, = Fe, Os, or Ru, and = Sb, As, or P.Jeitschko and Braun (1977)
One of the most notable filled skutterudite compounds is PrOs4Sb12, the first Pr-based heavy fermion superconductor ever reported (previously reported heavy fermion superconductors were Ce- or U-based compounds). The compound has an enormous electronic specific heat coefficient of 500 mJ/mol K2.Bauer et al. (2002); Maple et al. (2002) The specific heat jump at the superconducting critical temperature shows an unusual double peak feature as observed in numerous studies.Maple et al. (2002); Vollmer et al. (2003); Measson et al. (2004) Thermal transport measurements on single crystals carried out as a function of magnetic field direction revealed two different superconducting phases. At high fields (A-phase) the energy gap has four or more point nodes while the low field (B-phase) has two point nodes.Izawa et al. (2003) High field measurements probing the normal state properties revealed the existence of a high field ordered phase,Aoki et al. (2002); Ho et al. (2002, 2003); Tayama et al. (2003) which was determined by means of neutron diffraction experiments to be an antiferroquadrupolar ordered state.Kohgi et al. (2003)
A new class of filled skutterudites of the form Pt4Ge12 has recently been synthesized,Bauer et al. (2007); Gumeniuk et al. (2008) opening up an entirely new direction for filled skutterudite research. Several members of this new class exhibit superconductivity ( = Sr, Ba, Th, La, Pr) where the = Pr member has one of the highest values of at 7.9 K.Gumeniuk et al. (2008) Recent investigations have suggested that PrPt4Ge12 exhibits a type of strongly-coupled unconventional superconductivity that has point nodes in the energy gapMaisuradze et al. (2009) and breaks time-reversal symmetry.Maisuradze et al. (2010)
The Pr-based platinum germanide and osmium antimonide filled skutterudites exhibit a number of similarities and certain differences. Both compounds exhibit evidence for time-reversal symmetry breaking from muon-spin relaxation measurements.Aoki et al. (2003); Maisuradze et al. (2010) Experiments that probe the superconducting energy gap have yielded evidence for both nodal and nodeless energy gaps in both compounds. Transverse muon spin rotation (TF-SR) experiments revealed a temperature dependence of the penetration depth for PrOs4Sb12 that is consistent with an isotropic energy gap,MacLaughlin et al. (2002) while an NQR study reported evidence that PrPt4Ge12 is a weakly-coupled BCS superconductor.Kanetake et al. (2010) However, for PrOs4Sb12 scanning tunneling microscopy measurements observed a gap that was open in large regions, discounting the possibility of line nodes,Suderow et al. (2004) zero-field microwave penetration depth measurements revealed behavior best described with point nodes in the superconducting energy gap,Chia et al. (2003) and small angle neutron scattering experiments reported distortions in the flux-line lattice that were attributed to gap nodes.Huxley et al. (2004) Regarding PrPt4Ge12, transverse field SR measurements were best fit by gap nodes.Maisuradze et al. (2009) More recent studies also suggest that PrOs4Sb12Seyfarth et al. (2005, 2006); Shu et al. (2009) and PrPt4Ge12Sharath Chandra and Roy (2012); Nakamura et al. (2012); Zhang et al. (2013) are multiband superconductors. While both compounds have a singlet ground state, the splitting between the ground and first excited states differs by an order of magnitude. For PrOs4Sb12, 7 K, Maple et al. (2006, 2007) while for PrPt4Ge12, 130 K.Maisuradze et al. (2009); Gumeniuk et al. (2008); Toda et al. (2008) Furthermore, while PrOs4Sb12 is a heavy fermion compound with an electronic specific heat coefficient 500 mJ/mol K2, the electronic correlations in PrPt4Ge12 are considerably weaker as reflected in a much smaller value of 60 mJ/mol K2.Gumeniuk et al. (2008)
In an effort to obtain more insight into the unconventional superconductivity of PrPt4Ge12, we have performed a detailed study of the evolution of the superconducting and normal state properties of PrPt4Ge12 when Ce ions are substituted into the filler sites for Pr ions. The objective of these experiments was to determine the relation between the superconducting properties and the magnetic state of the Ce ions inferred from the normal state properties of the Pr1-xCexPt4Ge12 system as is varied. The resultant behavior of the superconducting properties as a function of substituent concentration are correlated with the magnetic state of the substituent ions which can lead to some extraordinary types of behavior. In the limit , where is the characteristic temperature (e.g., Kondo or spin fluctuation temperature) and is the critical transition temperature of the host superconductor, it has been found that the vs curve can exhibit reentrant behavior wherein superconductivity that occurs below a certain is destroyed below a second lower , whereas, in the limit , the vs curve has an exponential shape.
In this paper, we report electrical resistivity, magnetization, specific heat, and thermopower measurements on the Pr1-xCexPt4Ge12 system as a function of Ce concentration for . Fermi liquid behavior was observed throughout the series and a monotonic suppression of with is observed up to , above which there is no evidence for superconductivity down to 1.1 K. Interestingly, specific heat measurements of the superconductiong state suggest either a crossover from a nodal to a nodeless superconducting energy gap or that PrPt4Ge12 is a two band superconductorZhang et al. (2013) and scattering of electrons by substituted Ce ions suppresses the superconductivity associated with one of the bands.
II EXPERIMENTAL DETAILS
Polycrystalline samples of Pr1-xCexPt4Ge12 with = 0, 0.05, 0.06, 0.07, 0.085, 0.1, 0.14, 0.2, 0.25, 0.3, 0.35, 0.4, 0.45, 0.5, 0.625, 0.75, 0.875, and 1 were synthesized by arc melting in an Ar atmosphere on a water cooled copper hearth using a Zr getter to minimize oxidation. The starting materials were obtained from Ce rods (Alfa Aesar 3N, ESPI 3N), Pr ingots (Alfa Aesar 99.9%), Pt sponge (99.9999+%), and Ge pieces (Alfa Aesar 99.9999+%). The elements were weighed in stochiometric ratios and then arc-melted, turned over, and arc-melted again a total of five times to promote chemical homogeneity. The samples were then annealed in a sealed quartz tube (containing 200 Torr Ar at room temperature) for 336 hours at 800 ∘C. To determine whether Ta foil was a necessary component during the annealing process, extra batches of = 0.06 and 0.07 were annealed while wrapped in Ta foil. Powder x-ray diffraction (XRD) measurements showed no noticable difference from the batches without Ta foil.
Sample quality was characterized through analysis of powder XRD patterns collected by a Bruker D8 x-ray diffractometer using a Cu Kα source. Four-wire electrical resistivity measurements were performed from 300 K to 1.1 K in a pumped 4He cryostat and down to 50 mK using a commercial Oxford Kelvinox 3He-4He dilution refrigerator. Magnetization measurements were performed between 300 K and 2 K in a Quantum Design MPMS equipped with a 7 T superconducting magnet. Specific heat and thermoelectric power measurements were performed down to 1.8 K using a PPMS DynaCool. The heat capacity measurement employed a standard thermal relaxation technique. To measure the thermoelectric power, we applied a static temperature gradient of / = , where the temperature was measured using commercial Cernox 1050 thermometers and a Lakeshore 340 Temperature Controller. Copper leads were attached to the sample with silver epoxy in a two-wire configuration. The DC thermoelectric voltage generated by the sample was measured using a Keithley 2182 Nanovoltmeter and was corrected for a background contribution arising from thermal/compositional asymmetry in the wires running from the sample to the external electronics at room temperature.
III RESULTS
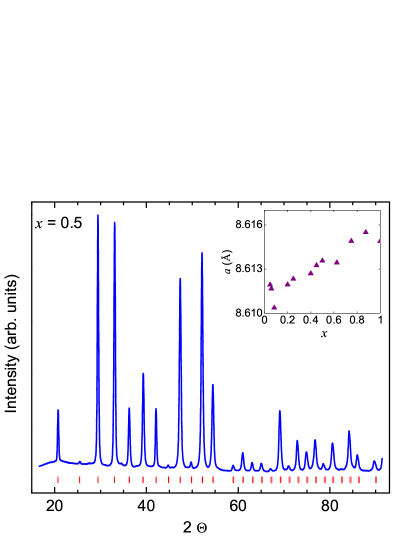
Rietveld refinements were performed on powder XRD patterns for each sample using GSASLarson and Von Dreele (2004) and EXPGUI.Toby (2001) The cubic skutterudite crystal structure with space group is observed over the entire range of , consistent with expectations.Toda et al. (2008); Gumeniuk et al. (2008) A representative XRD pattern (for the sample) is shown in Fig. 1, with the theoretical peak positions represented as ticks below the XRD pattern. The agreement between patterns and their refinement with the skutterudite crystal structure was excellent for all samples (fits not shown) with typical reduced values around 10. Some samples did show evidence for trace amounts of elemental Ge with impurity concentrations up to 3, but were otherwise phase pure. Lattice parameters, , obtained for the Pr and Ce parent compounds (inset in Fig. 1) agreed with previous studies.Toda et al. (2008); Gumeniuk et al. (2008) The observed systematic linear increase of with is consistent with Vegard’s law.
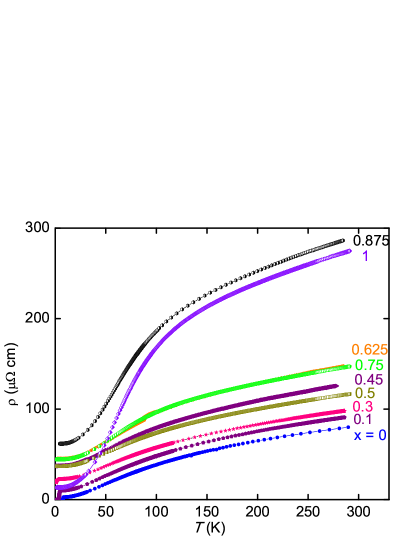
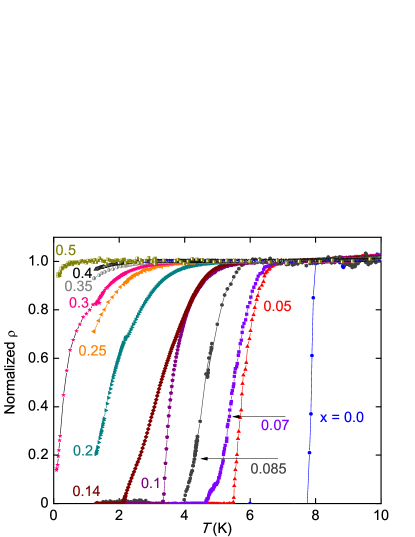
Electrical resistivity, , measurements performed in zero applied magnetic field are displayed for representative concentrations in Fig. 2. Data for some concentrations were omitted for the sake of visual clarity. A metallic temperature dependence for was observed for all as seen in Fig. 2. Significant curvature in , which is observed near 80 K for = 1, is rapdily suppressed as Pr ions are substituted for Ce so that it is no longer observed for = 0.75 (25 Pr). By diluting the Ce sub-lattice with Pr ions, which generally do not allow for strong hybridization between localized and itinerant electron states, the scattering contribution related to hybridization between Ce 4 electron states and the conduction band is rapidly destroyed. Gentle curvature in remains for 0 0.75, which may be due to Mott-Jones ”s-d” type scattering. Ce substitution suppresses and broadens the superconducting transition as highlighted in Fig. 3. The onset of superconductivity was observed in samples with concentrations up to 0.5. The critical temperatures, , were identified as the temperature where drops to half its value in the normal state right above the superconducting transition.
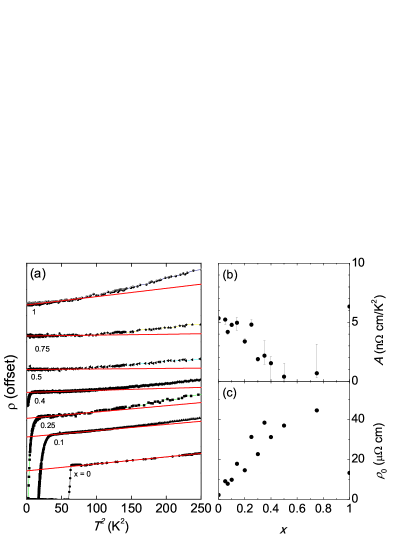
At low temperatures where phonons are mostly frozen out, is dominated by impurity and electron-electron scattering. As a result, the lattice contribution to the resistivity becomes negligible, reducing the behavior of to the function: where is the residual resistivity. For Fermi-liquids, = 2, while for non-Fermi liquids, typically lies in the range 0.5 but is usually close to 1.Maple et al. (2010) For Fermi liquid systems, is proportional to the square of the electronic specific heat coefficient (), which is in turn proportional to the square of the effective mass ()2, and inversely proportional to the square of the Fermi temperature ()2. For typical metals, is comparable to the mass of the free electron and, therefore, is quite large (e.g., for Cu, 8 x 10⁴ K).Ashcroft and Mermin (1976) As a result, the magnitude of is sufficiently small to make it unfeasible to observe the term experimentally. However, in heavy fermion systems, the strong electronic correlations enhance the effective mass and, in turn, reduce the effective values of so that the term can be readily observed.
Figure 4(a) displays vs , where the selected data sets were offset for clarity. The solid lines are least squares fits to the data with = from up to 250 K2. It should be noted that the samples with = 0.45, 0.625, and 0.875 were prepared at the same time and exhibited a higher porosity than other samples (30 less dense). For this reason, they were omitted from the power law analysis. Values for , extracted from the fits, are displayed in Fig. 4(b) as a function of . decreases with increasing , from 5.3 n cm/K2 for = 0 to a minimum at of 0.4 n cm/K2 at = 0.5, afterwards increasing to 6.3 n cm/K2 at = 1. Fig. 4(c) displays values of extracted from the fits as a function of , which increases with from 1.7 cm at = 0 to a maximum of 44 cm at = 0.75. A rapid drop occurs in at = 1 down to 13 cm, which is expected because it is a non-substituted compound and has less disorder, making the overall trend resemble a weighted parabola. The discrepancy of for = 1 with the values reported in Ref. Nicklas et al., 2012 and Ref. Gumeniuk et al., 2011 is most likely due to sample quality as the residual resistivity ratio of the previous work was an order of magnitude higher than in the current study.
Magnetization divided by magnetic field, , is displayed as a function of temperature in Fig. 5. The measurements were performed in applied magnetic fields of = 1 T except for the = 0 and = 1 end-member samples which were measured in = 0.5 T. The magnitude of decreases with Ce concentration throughout the whole series. A broad maximum at 80 K for = 1 was also observed. Such a feature could be interpreted as a signature of intermediate valence, consistent with previous studies.Gumeniuk et al. (2011) Small upturns in () are observed in the low temperature region which appear to be due to small amounts of paramagnetic impurities. Superconducting transition curves for samples with are displayed in the inset of Fig. 5, measured in applied magnetic fields of 1 mT to avoid suppressing superconductivity. was defined as the temperature in which zero-field cooled (ZFC) and field-cooled (FC) data deviated from one another. The superconducting volume fraction was estimated using the relation = , where has units of emu/mol, is the density of the compound in units of mol/cm3, and is the superconducting volume fraction such that = 1 represents complete flux expulsion by field-induced supercurrents. For samples exhibiting the full transition, the volume fraction achieved values slightly greater than 1, which may be attributed to demagnetization factor effects; nonetheless, the volume fractions are close to 1, indicating bulk superconductivity in this series.
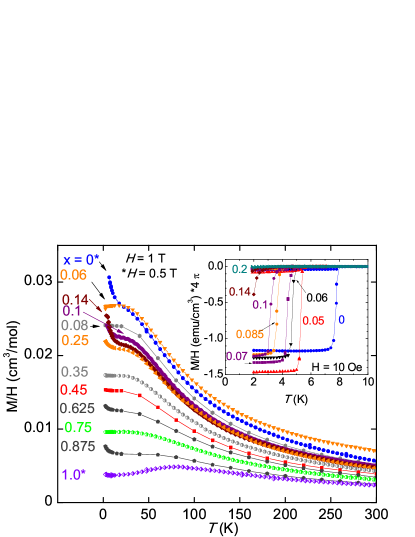
The data were fit to a Curie-Weiss law
| (1) |
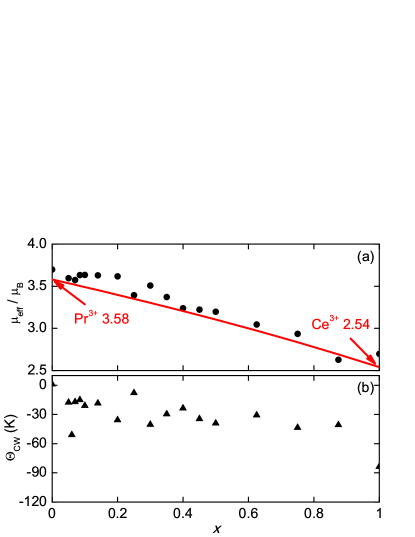
in the temperature region 75 - 300 K to determine the Curie-Weiss temperature and average effective magnetic moment of the Pr and Ce ions ( was extracted from the Curie constant , where is the number of ions that carry magnetic moments and is Boltzmann’s constant). The fits were applied to the data with Eq. 1 using linear least squares regression. The resulting best fit values for and are displayed in Fig. 6 as a function of . The Pr- and Ce-based end member compounds have effective magnetic moments of 3.69 and 2.69 per lanthanide, respectively, which are consistent with previously reported values.Toda et al. (2008); Gumeniuk et al. (2011) The Curie-Weiss temperature, , is roughly independent of , with values 30 K. Because is nearly constant, the following relation can be used to estimate the expected values of
| (2) |
assuming that and have free ion values calculated using Hund’s rules (3.58 and 2.54, respectively). The calculated effective magnetic moment decreases as a function of with values (dashed line) that are close to the measured values (solid circles), as can be seen in Fig. 6(a).
Isothermal magnetization measurements were performed at 2 K as a function of magnetic field (not shown) up to 7 T. Superconductivity was rapidly suppressed; above 1 T, only paramagnetism was observed. Upturns in at low temperature, which may be due to small concentrations of paramagnetic impurities, are most prominent for the samples with = 0.1 and 0.14. In order to obtain a rough estimate of the concentration of paramagnetic impurities in the samples, the impurities were assumed to be Gd which would be located at the lanthanide sites where Pr and Ce reside. This choice is arbitrary, and we could have chosen another lanthanide such as Ho or Er and Fe, which would occupy the Pt sites. Also, the resulting impurity concentration takes into account impurities on all sites, rare earth or transition metal. The impurity concentration () was determined from Curie law fits to the low temperature upturn using the function , where is the effective magnetic moment of Gd (7.94 ), and found to be 1 atomic of the lanthanide ions (Pr or Ce). This estimate for the paramagnetic impurity concentration is consistent with values inferred from () isotherms following a procedure described in Ref. Lukefahr et al., 1995.
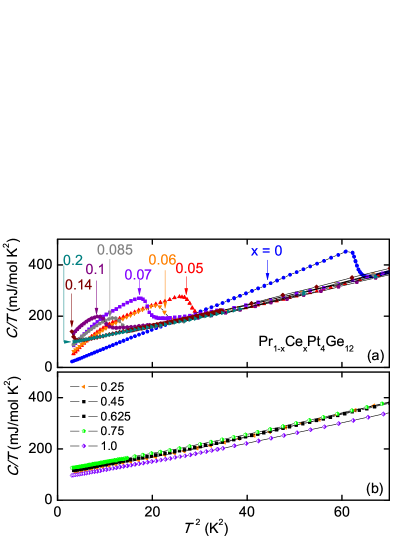
Specific heat divided by temperature, , data are shown in Fig. 7, where panel (a) displays data for concentrations where superconductivity was observed (), while panel (b) displays data for 0.2 for which there was no evidence for superconductivity. The superconducting critical temperature was defined as the mid-point of the jump in . Consistent with the electrical resistivity and magnetization data, the specific heat data show that superconductivity is suppressed with increasing Ce concentration. The values for extracted from physical properties are addressed in the discussion section.
The electronic specific heat coefficient, , and the coefficient of the phonon contribution, , were determined from linear fits of / vs data with the equation . The fits were performed from the lowest non-ordered temperature up to as far as linear fits were possible in vs . As seen in Fig. 8(a), increases with from 48 mJ/mol K2 for = 0 up to roughly 120 mJ/mol K2 for = 0.5, after which further substitution has a negligible effect on until = 1 where it decreases to 86 mJ/mol K2. Although this shows a moderate enhancement of with increasing , when compared to PrOs4Sb12 (500 mJ/mol K2), these values are relatively small. for the = 0 sample deviates from values previously reported (87 mJ/mol K2),Gumeniuk et al. (2008) yet this may be explained by the differing methods of determining . The authors of Ref. Gumeniuk et al., 2008 suppressed the superconducting region by applying a magnetic field and fitted the temperature region 3-10 K, while in this work the fit was performed on zero field measurements from 7-15 K. The Debye temperature, , was calculated using the relation: K where = 17, the number of atoms in the formula unit. increases with increasing for all values of as seen in Fig. 8(b).

The electronic contribution to the specific heat, , was calculated by subtracting the phonon contribution () from (). Figure 9(a) shows log(/) vs. , with data for each concentration offset for visual clarity. The lines in Fig. 9(a) represent best fits to the data with a fit range that extends roughly up to = 2. As can be seen for samples with = 0.05 to 0.1, the data are best fit by an exponential of the form , where is a fitting parameter and is the superconducting energy gap. As seen in Fig. 9(b-c), the parameters and / show no clear variation with Ce concentration within the scatter of the data; ranges in value between 11 and 15, while / ranges from 2.9 to 3.5. However, / is consistently above the BCS prediction of 1.76, indicating that the superconductivity in this series is in the strong-coupling region. There are no data for and / with = 0 since it was not possible to fit the () data with the function . However, as seen in Fig. 9(a), fits to the function where -3.0 yielded significantly better agreement for the = 0 sample. The change from power law behavior in the = 0 sample to exponential behavior in the substituted samples could be explained by a crossover in the superconducting energy gap from a point-node structure for PrPt4Ge12 () to a nodeless structure () when Ce is introduced.Sigrist and Ueda (1991); Maisuradze et al. (2009) On the other hand, if PrPt4Ge12 is a multiband superconductor, another possible explanation is the suppression of one of the superconducting energy bands with the smaller BCS energy gap by external perturbations (in this case, scattering of electrons by substituted Ce ions).Zhang et al. (2013); Nakamura et al. (2012)

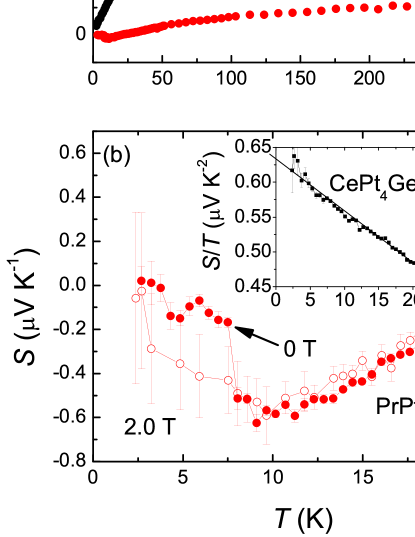
Thermopower, , measurements were performed on the = 0 and 1 compounds and the data are shown in Fig. 10. () is roughly 0 V/K for the pure Pr compound in the superconducting state below , as emphasized in Fig. 10(b). Applying a 2 T magnetic field suppresses superconductivity and results in a finite value for . changes sign near 21 K and slowly increases to a broad maximum of 6.3 V/K near 300 K. The low magnitudes of () suggests that the electronic density of states for PrPt4Ge12 may be predominantly flat in the vicinity of the Fermi energy .
For CePt4Ge12, () goes through a broad peak at approximately 80 K which is consistent with previous reports.Gumeniuk et al. (2011) However, the peak observed in this study has a higher magnitude, and the small feature at lower temperatures ( 20 K) is more clearly resolved than in previous studies.Gumeniuk et al. (2011) The presence of this shoulder-like feature on the large peak indicates that Ce is on the border between Kondo lattice (Ce3+) and intermediate valence behaviors within the context of the theory of Zlatić and Monnier.Zlatić and Monnier (2005)
IV Discussion
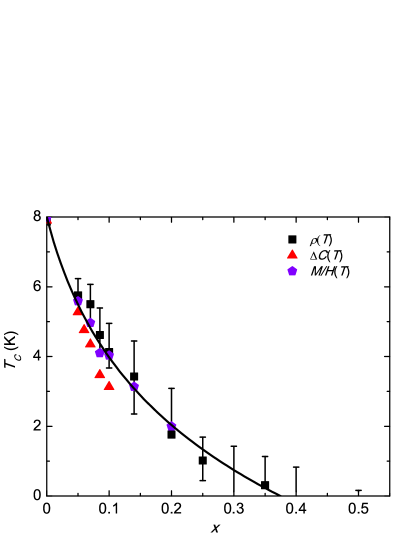
Summarized in Fig. 11 is the evolution of vs from magnetization, electrical resistivity, and specific heat measurements. All three measurements are consistent with one another in showing that is suppressed with increasing ; most evident from electrical resistivity is the positive curvature in the suppression of with . For electrical resistivity and specific heat, the midpoints of the transition were defined as , whereas for magnetization the splitting between ZFC and FC was used to determine . It would be interesting to compare the evolution of superconductivity due to Ce substitution in PrPt4Ge12 to the behavior in PrOs4Sb12; an investigation of the Pr1-xCexOs4Sb12 system is, in fact, underway.
The experiments reported in this paper were undertaken in an effort to probe the nature of the unconventional superconducting state of PrPt4Ge12 through the substitution of Ce ions. In conventional superconductors, it has been shown that the behavior of as a function of the concentration of substituted ions depends sensitively on the magnetic state of the substituent ion. For Ce ions that are nearly trivalent, as is apparently the case in the Pr1-xCexPt4Ge12 system, the 4-electron states of the Ce ions are hybridized with conduction electron states and are expected to generate a negative intra-atomic exchange interaction. The negative exchange interaction should produce a Kondo effect in which the magnetic state of the Ce substituent ion depends on the Kondo temperature , wherein the magnetic susceptibility exhibits magnetic behavior (Curie-Weiss behavior) for and nonmagnetic behavior (Pauli-like behavior) for . In a conventional superconductor, vs. changes from a curve with negative curvature that is reentrant in the limit , where is the transition temperature of the superconducting host material (in this case PrPt4Ge12), to a curve with positive curvature and nearly exponential shape for . The rate of the initial depression of with , -(/)x=0, exhibits a pronounced maximum when .Müller-Hartmann and Zittartz (1971); Jarrell (1988) The dependence of on Ce concentration for Pr1-xCexPt4Ge12 shown in Figure 11 has positive curvature; the initial linear depression of with extrapolates to 0 K at 0.15, whereas the nearly linear region at high extrapolates to 0 K at 0.4. To the extent that Ce ions break superconducting electron pairs in PrPt4Ge12, which is apparently an unconventional superconductor with nodes in the energy gap,Maisuradze et al. (2009) the Kondo temperature would appear to be 10-102 102-103 K. Borkowski and Hirschfeld have made a self-consistent theory of Kondo impurities in gapless unconventional superconductors valid in the Fermi liquid regime .Borkowski and Hirschfeld (1992) However, since the specific heat in the superconducting state quickly develops an exponential shape at low concentrations of Ce, indicative of nodeless superconductivity, we compare our vs. curves to the theory of Muller-Hartmann and Zittartz, which was developed for Kondo impurities in conventional superconductors with nodeless energy gaps. From this comparison, we estimate that the ratio / lies in the range 10 - 102, suggesting that lies in the range 102 - 103 K.Müller-Hartmann and Zittartz (1971) For a Kondo temperature with this value, one would expect to observe a minimum in the electrical resistivity that is produced by the sum of the lattice contribution to the resistivity, which decreases with decreasing temperature, and the contribution due to the Kondo effect, which increases with decreasing temperature. Such a minimum in the electrical resistivity is seen in many dilute alloy systems consisting of a nonmagnetic host metal containing 3 transition metal impurity ions or certain 4 lanthanide (e.g., Ce, Yb) and 5 actinide (e.g., U) impurity ions in which the -electron states are hybridized with conduction electron states. Examples include the La1-xCexAl2 system which has a reentrant vs curve ( 0.1 K, = 3.3 K) and Th1-xUx which has a nearly exponential vs curve ( 100 K, = 1.4 K).Maple et al. (1970, 1972); Maple (1976) However, no resistivity minimum is observed in the Pr1-xCexPt4Ge12 system, which could be due to the fact that the system is far beyond the single impurity limit. The interactions between the Pr and Ce ions may be sufficiently strong that the normal and superconducting states are determined by the cooperative behavior of the Pr and Ce ions in Pr1-xCexPt4Ge12. Thus, it may be more appropriate to think about the gradual evolution of the Pr1-xCexPt4Ge12 system with increasing x towards CePt4Ge12, which is a nonsuperconducting Kondo lattice system with a very large Kondo temperature, which is consistent with the saturation of the magnetic susceptibility as 0 K.
| References | |||||||
|---|---|---|---|---|---|---|---|
| [K] | [] | [mJ/mol K2] | [K] | [mJ/mol K] | |||
| PrOs4Sb12 | 1.85 | 2.97 | 500 | 210 | 1.5 | Bauer et al.,2002; Maple et al.,2003; Frederick et al.,2004; Maple et al.,2007 | |
| PrRu4Sb12 | 1.05 | 3.58 | 59 | 1.53 | 232 | 1.87 | Takeda and Ishikawa,2000; Frederick et al.,2004; Maple et al.,2007 |
| PrRu4As12 | 2.5 | 3.52 | 70 | 1.44 | 344 | 1.53 | Namiki et al.,2007; Maple et al.,2007; Sayles et al.,2010 |
| PrPt4Ge12 | 7.9 | 3.59 | 87 | 2.35 | 198 | 1.56 | Gumeniuk et al.,2008; Toda et al.,2008; Zhang et al.,2013 |
| PrPt4Ge12 | 7.9 | 3.69 | 48 | 193 | 2.78 | This work |
In view of the unconventional superconductivity exhibited by PrPt4Ge12, it is interesting to compare this compound to other Pr based filled skutterudite compounds. Table 1 displays the characteristic parameters of known Pr-based superconducting skutterudites.Maple et al. (2007) The values of characteristic parameters appear to be very similar when comparing the properties among the majority of these skutterudites. The effective magnetic moment remains close to the Hund’s rule prediction for the Pr free ion of 3.69 except for PrOs4Sb12, for which = 2.97. The electronic specific heat coefficient is consistently below 100 mJ/mol K2 with only PrOs4Sb12 having a significantly larger value of 600 mJ/mol K2.Bauer et al. (2002); Maple et al. (2003); Frederick et al. (2004); Maple et al. (2007) The Debye temperature exhibits values near 200 K except in PrRu4As12 with = 344 K.Namiki et al. (2007); Maple et al. (2007); Sayles et al. (2010) While many of the Pr-based skutterudites have values of between 1-2 K, PrPt4Ge12 is unique with = 7.9 K. The ratio is also enhanced for PrPt4Ge12 relative to the other compounds, exhibiting values of approximately 2.3. It is interesting to observe that many of the properties of these Pr-based superconducting filled skutterudites are very similar, despite the different atomic cages within which the Pr ions reside.
Illustrated in Fig. 12(a) is the Kadowaki-Woods ratio = as a function of , where is derived from power law fits to () with = 2. The samples of = 0.45, 0.625, and 0.875 are omitted as there was no value to calculate with. Figure 12(b) displays the evolution of the Sommerfeld-Wilson ratio with , where = () .Gegenwart et al. (2005) The error bars of and in Fig. 12 were propagated through in calculations from the errors bars of , , and employing standard error analysis.Taylor (1997) For many -electron based heavy fermion compounds, = 1.0 x cm(mol K mJ.Kadowaki and Woods (1986) However, a number of heavy fermion systems that have Fermi liquid characteristics exhibits values closer to = 1.0 x , which can be explained by taking into account the degeneracy of the lanthanide ions.Tsujii et al. (2005) Fig. 12(a) displays vs. where decreases with increasing , from 2.6 x 10⁻⁶ cm (mol K mJ-1)2 for = 0 down to 0.05 x 10⁻⁶ cm(mol K mJ for = 0.5. then increases to 0.85 x 10⁻⁶ cm(mol K mJ for = 1. For = 1, is comparable to the value reported by Gumeniuk et al.Gumeniuk et al. (2011) However; we were unable to find a reported value for = 0. stays in the range of 10-6, suggesting that Pr1-xCexPt4Ge12 behaves similarly to other heavy fermion systems even with an only a modestly enhanced 110 mJ/mol K2.
For the Sommerfeld-Wilson ratio, , a value of 1 is expected a for free electron gase and a value of 2 for a Kondo system.Fisk et al. (1987) In Fig. 12(b), decreases with increasing down to roughly 1 at = 1, suggesting that the Ce parent compound behaves as a free electron system. The higher value for = 0 may be due to exchange enhancement of the magnetic susceptibility and is consistent with previous literature results for = 0 (3).Maisuradze et al. (2010); Gumeniuk et al. (2008)

V Concluding Remarks
A systematic study of the system Pr1-xCexPt4Ge12 was performed by electrical resistivity, magnetization, specific heat, and thermopower measurements, where Fermi liquid behavior was observed throughout the series. We find that superconductivity is suppressed with increasing Ce with positive curvature up to = 0.5, above which no evidence for superconductivity was observed down to 1.1 K. The Sommerfeld coefficient increases with Ce concentration, from 48 mJ/mol K2 for = 0 up to a maximum of 120 mJ/mol K2 for = 0.5, a signature of strengthened electronic correlations. Comparisons of the profile in the superconducting state shows that the data are best described by a dependence for = 0 and an e-Δ/T dependence for 0.05. This may be explained by a crossover from a nodal to nodeless superconducting energy gap or the suppression from multiple to single BCS type superconducting energy bands with increasing Ce concentration.
Acknowledgements.
Sample synthesis and initial screening for superconductivity was supported by the US Air Force Office of Scientific Research under MURI grant No. FA 9550-09-1-0603. Low-temperature measurements were supported by the US National Science Foundation under grant No. DMR 0802478. Measurements of electronic and magnetic properties were supported by the US Department of Energy under grant NO. FG0204-ER46105. The crystal growth equipment was partially supported by the US Department of Energy under grant No. FG02-04-ER46178. M. Janoschek gratefully acknowledges financial support from the Alexander von Humboldt Foundation.References
- Sales (2003) B. C. Sales, in Handbook on the Physics and Chemistry of the Rare Earths, edited by K. A. Gschneidner Jr., J.-C. Bünzli, and V. K. Pecharsky (2003), vol. 33, chap. 211.
- Bauer et al. (2002) E. D. Bauer, N. A. Frederick, P.-C. Ho, V. S. Zapf, and M. B. Maple, Phys. Rev. B 65, 100506(R) (2002).
- Maple et al. (2002) M. B. Maple, P.-C. Ho, V. S. Zapf, N. A. Frederick, E. D. Bauer, W. M. Yuhasz, F. M. Woodward, and J. W. Lynn, J. Phys. Soc. Japan 71, suppl., 23 (2002).
- MacLaughlin et al. (2002) D. E. MacLaughlin, J. E. Sonier, R. H. Heffner, O. O. Bernal, B.-L. Young, M. S. Rose, G. D. Morris, E. D. Bauer, T. D. Do, and M. B. Maple, Phys. Rev. Lett. 89, 157001 (2002).
- Aoki et al. (2003) Y. Aoki, A. Tsuchiya, T. Kanayama, S. R. Saha, H. Sugawara, H. Sato, W. Higemoto, A. Koda, K. Ohishi, K. Nishiyama, et al., Phys. Rev. Lett. 91, 067003 (2003).
- Vollmer et al. (2003) R. Vollmer, A. Fait, C. Pfleiderer, H. v. Löhneysen, E. D. Bauer, P.-C. Ho, V. Zapf, and M. B. Maple, Phys. Rev. Lett. 90, 057001 (2003).
- Suderow et al. (2004) H. Suderow, S. Vieira, J. D. Strand, S. Bud’ko, and P. C. Canfield, Phys. Rev. B 69, 060504(R) (2004).
- Maple et al. (2005) M. B. Maple, N. A. Frederick, P.-C. Ho, W. M. Yuhasz, T. A. Sayles, N. P. Butch, J. R. Jeffries, and B. J. Taylor, Physica B 359, 830 (2005).
- Maple et al. (2007) M. B. Maple, Z. Henkie, W. M. Yuhasz, P.-C. Ho, T. Yanagisawa, T. A. Sayles, N. P. Butch, J. R. Jeffries, and A. Pietraszko, J. Magn. Magn. Mater. 310, 182 (2007).
- Sato et al. (2009) H. Sato, Y. Aoki, D. Kikuchi, H. Sugawara, W. Higemoto, K. Ohishi, T. U. Ito, R. Heffner, S. R. Saha, A. Koda, et al., Physica B 404, 749 (2009).
- Shu et al. (2009) L. Shu, D. E. MacLaughlin, W. P. Beyermann, R. H. Heffner, G. D. Morris, O. O. Bernal, F. D. Callaghan, J. E. Sonier, W. M. Yuhasz, N. A. Frederick, et al., Phys. Rev. B 79, 174511 (2009).
- Sales et al. (1996) B. C. Sales, D. Mandrus, and R. K. Williams, Science 272, 1325 (1996).
- Jeitschko and Braun (1977) W. Jeitschko and D. Braun, Acta Cryst. B33, 3401 (1977).
- Measson et al. (2004) M.-A. Measson, D. Braithwaite, J. Flouquet, G. Seyfarth, J. P. Brison, E. Lhotel, C. Paulsen, H. Sugawara, and H. Sato, Phys. Rev. B 70, 064516 (2004).
- Izawa et al. (2003) K. Izawa, Y. Nakajima, J. Goryo, Y. Matsuda, S. Osaki, H. Sugawara, H. Sato, P. Thalmeier, and K. Maki, Phys. Rev. Lett. 90, 117001 (2003).
- Aoki et al. (2002) Y. Aoki, T. Namiki, S. Ohsaki, S. R. Saha, H. Sugawara, and H. Sato, J. Phys. Soc. Japan 71, 2098 (2002).
- Ho et al. (2002) P.-C. Ho, V. S. Zapf, E. D. Bauer, N. A. Frederick, M. B. Maple, G. Giester, P. Rogl, S. T. Berger, C. H. Paul, and E. Bauer, Int. J. of Mod. Phys. B 16, 3008 (2002).
- Ho et al. (2003) P.-C. Ho, N. A. Frederick, V. S. Zapf, E. D. Bauer, T. D. Do, M. B. Maple, A. D. Christianson, and A. H. Lacerda, Phys. Rev. B 67, 180508(R) (2003).
- Tayama et al. (2003) T. Tayama, T. Sakakibara, H. Sugawara, Y. Aoki, and H. Sato, J. Phys. Soc. Japan 72, 1516 (2003).
- Kohgi et al. (2003) M. Kohgi, K. Iwasa, M. Nakajima, N. Metoki, S. Araki, N. Bernhoeft, J.-M. Mignot, A. Gukasov, H. Sato, Y. Aoki, et al., J. Phys. Soc. Japan 72, 1002 (2003).
- Bauer et al. (2007) E. Bauer, A. Grytsiv, X. Chen, N. Melnychenko-Koblyuk, G. Hilscher, H. Kaldarar, H. Michor, E. Royanian, G. Giester, M. Rotter, et al., Phys. Rev. Lett. 99, 217001 (2007).
- Gumeniuk et al. (2008) R. Gumeniuk, W. Schnelle, H. Rosner, M. Nicklas, A. Leithe-Jasper, and Y. Grin, Phys. Rev. Lett. 100, 017002 (2008).
- Maisuradze et al. (2009) A. Maisuradze, M. Nicklas, R. Gumeniuk, C. Baines, W. Schnelle, H. Rosner, A. Leithe-Jasper, Y. Grin, and R. Khasanov, Phys. Rev. Lett. 103, 147002 (2009).
- Maisuradze et al. (2010) A. Maisuradze, W. Schnelle, R. Khasanov, R. Gumeniuk, M. Nicklas, H. Rosner, A. Leithe-Jasper, Y. Grin, A. Amato, and P. Thalmeier, Phys. Rev. B 82, 024524 (2010).
- Kanetake et al. (2010) F. Kanetake, H. Mukuda, Y. Kitaoka, H. Sugawara, K. Magishi, K. M. Itoh, and E. E. Haller, Physica C 470, S703 (2010).
- Chia et al. (2003) E. E. M. Chia, M. B. Salamon, H. Sugawara, and H. Sato, Phys. Rev. Lett. 91, 247003 (2003).
- Huxley et al. (2004) A. D. Huxley, M.-A. Measson, K. Izawa, C. D. Dewhurst, R. Cubitt, B. Grenier, H. Sugawara, J. Flouquet, Y. Matsuda, and H. Sato, Phys. Rev. Lett. 93, 187005 (2004).
- Seyfarth et al. (2005) G. Seyfarth, J. P. Brison, M.-A. Méasson, J. Flouquet, K. Izawa, Y. Matsuda, H. Sugawara, and H. Sato, Phys. Rev. Lett. 95, 107004 (2005).
- Seyfarth et al. (2006) G. Seyfarth, J. P. Brison, M.-A. Méasson, D. Braithwaite, G. Lapertot, and J. Flouquet, Phys. Rev. Lett. 97, 236403 (2006).
- Sharath Chandra and Roy (2012) M. K. Sharath Chandra, L. S. Chattopadhyay and S. B. Roy, Philos. Mag. 92, 3866 (2012).
- Nakamura et al. (2012) Y. Nakamura, H. Okazaki, R. Yoshida, T. Wakita, H. Takeya, K. Hirata, M. Hirai, Y. Muraoka, and T. Yokoya, Phys. Rev. B 86, 014521 (2012).
- Zhang et al. (2013) J. L. Zhang, Y. Chen, L. Jiao, R. Gumeniuk, M. Nicklas, Y. H. Chen, L. Yang, B. H. Fu, W. Schnelle, H. Rosner, et al., Phys. Rev. B 87, 064502 (2013).
- Maple et al. (2006) M. B. Maple, N. A. Frederick, P.-C. Ho, W. M. Yuhasz, and T. Yanagisawa, J. Supercond. Novel Magnetism 19, 299 (2006).
- Toda et al. (2008) M. Toda, H. Sugawara, K.-i. Magishi, T. Saito, K. Koyama, Y. Aoki, and H. Sato, J. Phys. Soc. Jpn. 77, 124702 (2008).
- Larson and Von Dreele (2004) A. C. Larson and R. B. Von Dreele, General Structure Analysis System (GSAS), Los Alamos National Laboratory Report (2004), LAUR 86-748.
- Toby (2001) B. H. Toby, J. Appl. Crystallogr. 34, 210 (2001).
- Maple et al. (2010) M. B. Maple, R. E. Baumbach, N. P. Butch, J. J. Hamlin, and M. Janoschek, J. Low Temp. Phys. 161, 4 (2010).
- Ashcroft and Mermin (1976) N. W. Ashcroft and N. D. Mermin (1976).
- Nicklas et al. (2012) M. Nicklas, S. Kirchner, R. Borth, R. Gumeniuk, W. Schnelle, H. Rosner, H. Borrmann, A. Leithe-Jasper, Y. Grin, and F. Steglich, Phys. Rev. Lett. 109, 236405 (2012).
- Gumeniuk et al. (2011) R. Gumeniuk, K. O. Kvashnina, W. Schnelle, M. Nicklas, H. Borrmann, H. Rosner, Y. Skourski, A. A. Tsirlin, A. Leithe-Jasper, and Y. Grin, J. Phys.: Condens. Matter 23, 465601 (2011).
- Lukefahr et al. (1995) H. G. Lukefahr, O. O. Bernal, D. E. MacLaughlin, C. L. Seaman, M. B. Maple, and B. Andraka, Phys. Rev. B 52, 3038 (1995).
- Sigrist and Ueda (1991) M. Sigrist and K. Ueda, Rev. Mod. Phys. 63, 239 (1991).
- Zlatić and Monnier (2005) V. Zlatić and R. Monnier, Phys. Rev. B 71, 165109 (2005).
- Müller-Hartmann and Zittartz (1971) E. Müller-Hartmann and J. Zittartz, Phys. Rev. Lett. 26, 428 (1971).
- Jarrell (1988) M. Jarrell, Phys. Rev. Lett. 61, 2612 (1988).
- Borkowski and Hirschfeld (1992) L. S. Borkowski and P. J. Hirschfeld, Phys. Rev. B 46, 9274(R) (1992).
- Maple et al. (1970) M. B. Maple, J. G. Huber, B. R. Coles, and A. C. Lawson, J. Low Temp. Phys. 3, 137 (1970).
- Maple et al. (1972) M. B. Maple, W. A. Fertig, A. C. Mota, L. E. DeLong, D. Wohlleben, and R. Fitzgerald, Solid State Commun. 11, 829 (1972).
- Maple (1976) M. B. Maple, App. Phys. 9, 179 (1976).
- Maple et al. (2003) M. B. Maple, P.-C. Ho, N. A. Frederick, V. S. Zapf, W. M. Yuhasz, E. D. Bauer, A. D. Christianson, and A. H. Lacerda, J. Phys. Condens. Matter 15, S2071 (2003).
- Frederick et al. (2004) N. A. Frederick, T. D. Do, P.-C. Ho, N. P. Butch, V. S. Zapf, and M. B. Maple, Phys. Rev. B 69, 024523 (2004).
- Takeda and Ishikawa (2000) N. Takeda and M. Ishikawa, J. Phys. Soc. Japan 69, 868 (2000).
- Namiki et al. (2007) T. Namiki, Y. Aoki, H. Sato, C. Sekine, I. Shirotani, T. D. Matsuda, Y. Haga, and T. Yagi, J. Phys. Soc. Japan 76, 093704 (2007).
- Sayles et al. (2010) T. A. Sayles, R. E. Baumbach, W. M. Yuhasz, M. B. Maple, L. Bochenek, R. Wawryk, T. Cichorek, A. Pietraszko, Z. Henkie, and P.-C. Ho, Phys. Rev. B 82, 104513 (2010).
- Gegenwart et al. (2005) P. Gegenwart, J. Custers, Y. Tokiwa, C. Geibel, and F. Steglich, Phys. Rev. Lett. 94, 076402 (2005).
- Taylor (1997) J. R. Taylor, An Introduction to Error Analysis (University Science Books, 1997), 2nd ed.
- Kadowaki and Woods (1986) K. Kadowaki and S. B. Woods, Solid State Commun. 58, 507 (1986).
- Tsujii et al. (2005) N. Tsujii, H. Kontani, and K. Yoshimura, Phys. Rev. Lett. 94, 057201 (2005).
- Fisk et al. (1987) Z. Fisk, H. R. Ott, and G. Aeppli, Jpn. J. Appl. Phys. 26 S3, 1882 (1987).