Interesting Features in the Combined GALEX and Sloan Color Diagrams of Solar-like Galactic Populations
Abstract
We report on intriguing photometric properties of Galactic stars observed in the GALEX satellite’s far-UV (FUV) and near-UV (NUV) bandbasses as well as from the ground-based SDSS survey and the Kepler Input Catalog. The first property is that the (FUV-NUV) color distribution of stars in the Kepler field consists of two well separated peaks. A second and the more perplexing property is that for stars with spectral types G or later the mean (FUV-NUV) color becomes much bluer, contrary to expectation. Investigating this tendency further, we found in two samples of mid-F through K type stars that 17-22% of them exhibit FUV-excesses relative to their NUV fluxes and spectral types. A correction for FUV incompleteness of the FUV magnitude limited star sample brings this ratio to 14-18%. Nearly the same fractions are also discovered among members of the Kepler Eclipsing Binary Catalog and in the published list of Kepler Objects of Interest. These UV-excess (“UVe”) colors are confirmed by the negative UV continuum slopes in GALEX spectra of members of the population. The SDSS spectra of some UVe stars exhibit metallic line weakening, especially in the blue. This suggests an enhanced contribution of UV flux relative to photospheric flux of a solar-type single star. We consider the possibility that the UV excesses originate from various types of hot stars, including white dwarf DA and sdB stars, binaries, and strong chromosphere stars that are young or in active binaries. The space density of compact stars is too low to explain the observed frequency of the UVe stars. Our model atmosphere-derived simulations of colors for binaries with main sequence pairs with a hot secondary demonstrate that the color loci conflict with the observed sequence. As a preferred explanation we are left with the active chromospheres explanation, whether in active close binaries or young single stars, as a still tentative explanation for the UVe population - despite the expected paucity of young, chromospherically-active stars in the field. We also address a third perplexing color property, namely the presence of a prominent island of “UV red” stars surrounded by “UV blue” stars in the diagnostic , color diagram. We find that the subpopulation comprising this island are mainly horizontal branch stars. These objects do not exhibit UV excesses and therefore have UV colors typical for their spectral types. This subpopulation appears “red” in the UV only because their colors are not pulled to the blue by the inclusion of UVe stars.
Subject headings:
stars: general, stars: fundamental parameters, stars: horizontal branch, stars: late-type, stars: statistics, ultraviolet emission1. Introduction
Although the Kepler program was conceived as a NASA space-borne mission dedicated to the discovery of Earth-sized exoplanets, its data archive is now being mined as an important resource for determining fundamental properties of late-type stars, including their evolution and variability, as well as a resource for the discovery of new stellar populations. The ensuing literature promises to mark the Kepler mission’s Field of View (FOV) as a region of dedicated study of Galactic disk stars for some time to come.
The study of Kepler light curves has required complementary ground-based observations to determine basic stellar parameter. To take one example, a planetary host star’s radius is used with the eclipse depth to determine the radius of a transiting planet. The first large ground-based effort was the construction of the Kepler Input Catalog (KIC), which contained mean magnitudes obtained from the clones of the filters introduced by the Sloan Digital Sky Survey (SDSS) project111The SDSS is managed by the Astrophysical Research Consortium for the Participating Institutions. Funding for SDSS was provided by the Alfred P. Sloan Foundation, Participating Institutions, the National Science Foundation, U.S. Department of Energy, and the National Aeronautics & Space Administration. The 2.5m SDSS telescope is described by Gunn et al. (2006). Technical summary of the SDSS project are given by York et al. (2000) and Stoughton et al. (2002). before the launch of the Kepler spacecraft. Described by T. Brown et al. (2011), the KIC provided optical and near-IR magnitudes for nearly all stars down to magnitude 17 in the region of the sky where Kepler’s camera would be pointed. The “Kepler magnitude” (Kp) used by the KIC is a weighted mean of the and magnitudes. The catalog also included infrared observations from the 2MASS survey. Because foremost the SDSS was a survey of extragalactic objects, the sky coverage of the principal SDSS data releases avoided low Galactic latitude sky zones and this avoidance included the Kepler FOV. The FOV is a 105 deg.2 field and lies within Galactic latitudes 5-22∘ toward the constellations Lyra and Cygnus.
Building on the success of the SDSS project, Groot et al. (2009) and Verbeek et al. (2012) published the “UVEX catalog,” a SDSS filter-based photometric survey of objects with strong UV excess fluxes in a 1850 deg.2 region of the Northern Galactic plane. Steeghs et al. (2012) used SDSS filter copies to observe 98% of the area comprising the Kepler FOV, which as we have noted likewise substantially restricts studies to stars in the Galactic (thin) disk. This work is known as the Kepler Isaac Newton Telescope Survey (“KIS,” Steeghs et al. 2012), is calibrated in the Vega magnitude system, and is distributed by MAST. Our work includes the results of both releases, that is the union of both sky areas. A spectroscopic follow up to the UVEX catalog by Verbeek et al. (2012b) confirmed the catalog authors’ conclusions that 95% of UVEX objects are hot objects such as DA and DB white dwarfs (WD), WD binaries, hot subdwarf (sdO, sdB) stars, and QSOs. Rounding out the other 5% are upper main sequence stars and members of the Blue and Extreme Horizontal Branches.
The addition of UV sky surveys from the GALEX satellite extended the wavelength coverage to simultaneous observations in the near-UV (NUV, centered at 2271 Å) and far-UV (FUV, centered at 1528 Å) wavebands. The photometric depth of these surveys depended on the wavelength band and exposure time associated with the survey (e.g., Morrissey et al. 2007, Bianchi 2009, 2011). Like the SDSS the GALEX surveys avoided the low Galactic latitude sky regions owing to safety limits imposed by diffuse glow and bright stars (m 9.5). For completeness, we note that an electrical overcurrent in the FUV camera caused its shutdown in May, 2009. NASA funding for the GALEX mission was terminated in early 2012. As for the Kepler spacecraft, the failure of a reaction wheel in May 2013 brought to a close its search for exoplanets in the FOV.
Despite the extensive GALEX literature, rather few studies of stellar properties have been published to date that combine optical, IR, and GALEX photometry in the Kepler FOV. One reason for this still incomplete record is that whereas IR magnitudes form an important complement, the UV magnitudes are faint and are generally less important to characterizing a cool star. Also, because of the diffuse UV glow in the Galactic Plane, a homogeneous GALEX survey could not cover more than half the Kepler FOV. The optical and GALEX imaging surveys can accumulate strong UV fluxes of several important stellar populations which are largely unrelated to Kepler’s core mission studies. By making use of the (UV/optical) filter, KIS provides a bridge between the KIC optical and the GALEX NUV and FUV magnitudes and facilitates the discovery of Galactic stars with UV excesses in this important sky field.
Several studies that combine SDSS and GALEX data have contributed to our understanding of stellar populations, particularly by deriving photometric spectral types for Galactic stars. Bianchi et al. (2005, 2007, 2011) and Bianchi (2011) have published initial results from these comprehensive photometric surveys. These authors computed colors of galaxies, QSOs, and well represented populations of Galactic stars (main sequence, giants/supergiants, white dwarfs) through the SDSS and GALEX filters. This body of work demonstrated that unresolved galaxies and QSOs can be differentiated well by using GALEX UV colors combined with the SDSS ground-based data. Comparison of the GALEX and SDSS surveys shows that in both the Medium and All-Sky Imaging Surveys, the number of Galactic stars per square degree falls off and equals the number (rapidly rising with magnitude) of GALEX-identified galaxies at Kp = 17-18 magnitude.
While the addition of GALEX UV colors has facilitated searches for hot objects with UV excesses, new binary classes have been found that include cool companions. Thus, GALEX and SDSS colors together have enabled the discovery of White Dwarf-Main Sequence systems (WDMS), i.e., binaries with WD primaries and late-type main sequence secondaries (see Rebassa-Mansergas et al. 2010, 2012, Girven et al. 2012b, Németh et al. 2012).
Herein we extend previous work by examining a newly discovered population of Galactic disk stars with GALEX far-UV excesses. Although these stars were first discovered in sky areas common to both GALEX and SDSS, our emphasis will be on the properties of similar objects that lie within the Kepler FOV chiefly because of the promised rich harvest from ground-based follow-up campaigns on them. Thus, primarily we relied on the stars observed by the GALEX GR6/GR7 surveys in the FOV. Secondarily, we relied on stars observed by GALEX and SDSS DR7 imaging surveys, i.e. in sky regions not covered by the FOV and used by Smith & Shiao (2011). Moreover, the SDSS filter colors used in each case are taken from different magnitude systems. Because the samples are independent, we will treat them separately. Both samples were created by adopting cross-correlation search radii of 5 arcsec and restricting matches that were closest neighbor members of one survey to the other and vice versa. The magnitude and error limits are discussed below. Also, unless stated otherwise we generally constrained our study of the Kepler FOV to objects considered probable stars brighter than Kp = 16.0 and within 0.55 ∘ of the GALEX tile centers.222For the SDSS/GALEX population the faint limit was Kp= 18. This is also the practical limit for KIS recommended by Steeghs et al. (2012).
2. Statement of the questions
Smith & Shiao (2011) have pointed out two peculiarities in the distribution of GALEX UV colors of Galactic stars. These peculiarities raise questions which we address through this paper. The first peculiarity was a separation into two clean peaks of the distribution of stars’ (FUV-NUV) colors. Similar distributions are exhibited in Figure 1for stars in the Kepler FOV. These objects are point-like and have circular shapes according to the GALEX pipeline, but particularly for the fainter objects are not necessarily stars. Objects brighter than Kp = 16.0, i.e., those which we are studying, have a high probability of being stars. We excluded a very small number of bright objects (NUV, FUV 10 mag.) for which the pipeline flagged saturation in the recorded NUV or FUV pixels. Likewise, we excluded stars for which the KIS pipeline flagged saturation.
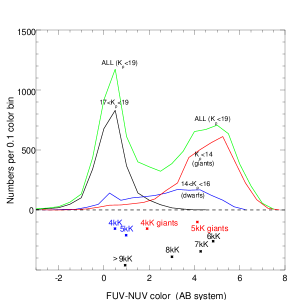
The presence of the two discrete peaks in Fig. 1 is unexplored and is the first focus of our work. We noticed first that the relative heights of the two peaks differ markedly for the faint (extragalactic) objects, Galactic dwarfs, and Galactic giants/supergiants - we define below our criteria for segregating stars into dwarfs and giants/supergiants categories. The galaxies have a strong UV-color peak. We also compared the bimodal distributions of dwarfs and giants stars. Although the statistics are poorer, there are more dwarfs in the blue UV peak than giants.
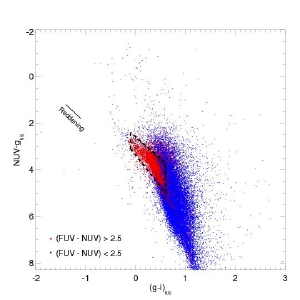
Next, we found it instructive to segregate members from these peaks into “UV-blue” and “UV-red” populations. We have used the color criterion (FUV-NUV) = 2.5, the midpoint between the peaks, for this separation, where FUV and NUV are determined in Oke & Gunn’s (1983) AB magnitude system. Next, we plotted colors in the Bianchi et al. (2007) diagnostic , diagram, in which the authors give useful diagnostics for stars. This plot, shown in Figure 2 shows a second peculiarity, namely a relatively small “UV-red island.” We will refer to this region in the context of this figure as the “UV-red clump.” This leads to a secondary focus of this work, which we can distill into the two related questions: what are the UV-red clump stars, and why are they surrounded by UV-blue stars, particularly by cooler stars in the lower right of this diagram?
All objects in our sample are flagged as point-like in the surveys we used, and because they are relatively bright, they are all stars, or in rare cases possibly QSOs. It then becomes important to separate subpopulations into KIC-derived effective temperature bins, corresponding approximately to spectral types, and luminosity class, in order to address the reasons for this peculiarity. Interestingly, we found that the median (FUV-NUV) colors of these bins do not continually increase monotonically with decreasing Teff (see Fig. 1), as would be expected, but rather attain a maximum at Teff 6 kK. This curious feature is called out by the annotations in the first figure, and it gives hints as to the reason for the presence of the red UV clump. As we will show in 4, this discovery links the two sets of questions above. Our work will investigate the reason for the reversal of the GALEX UV color towards cooler effective temperatures.
3. Data Analysis
3.1. General procedures
Although our study ultimately concerns stellar populations, especially in the Kepler FOV, the fact that the Teff values in the Kepler Input Catalog (KIC)333KIC, KIS, and SDSS/DR7 photometric data are available for prospective targets in the Kepler FOV at the website http://archive.stsci.edu/kepler administered by the Mikulski Archive for Space Telescopes (MAST). Support for archiving MAST data is provided by NASA Grant NAS5-7584. These data are used “as is,” that is without dereddening and without tranformations to a common magnitude system.
are determined from photometric colors makes them less reliable than if they were derived from spectra. Instead we sought Teff values elsewhere for large numbers of faint stars that could be applied to stars in the FOV.
Spectroscopically derived Teff values for many faint stars from the SDSS survey, and in the GALEX sky, can be obtained from the the SDSS grism pipeline (Vanden Berk et al. 2001, Stoughton et al. 2002, Allende Prieto et al. 2008). This pipeline processes spectra in the wavelength range 3800-9200 Å. The specra are delivered as a supplemental product for a small subset of targets that are also observed spectroscopically. A technical summary of the spectrographs is given by Smee et al. (2013) The resolving power is R = 1850 in the blue and 2200 in the red. The automated spectroscopic SDSS/SSPP (SEGUE Stellar Parameter Pipeline; Lee et al. 2008) subtracts a fitted polynomial from the spectrum, leaving a difference spectrum of emission and/or absorption lines. The population type of point-like object is assessed from the morphology of the spectrum: a strong blue continuum and redshifted emission lines for QSOs, a red continuum with redshifted broad absorptions/emission features for galaxies, and unshifted absorption lines for stars. Once a spectrum is evaluated as stellar the Teff, is computed and stored in the SDSS sppParams table as the parameter “teffa.” We extracted these temperatures from the SDSS archive at MAST. These temperatures were used to bin spectra to the nearest kiloKelvin in Figs. 3. Apart from this figure, effective temperatures referenced for stars in the Kepler field are taken from the KIC.
Because we wanted also to check on the reliability of the GALEX photometric colors by means of this project’s grism spectra, we crossmatched all stars observed spectroscopically by both GALEX (GR6/DR7) and SDSS (DR7) over the whole sky. This netted spectra for 369 objects flagged by both missions as stars. The GALEX grism observations that included these stars were made as part of a variety of GALEX surveys as well as Guest Investigator programs. The Teff values computed by the SDSS DR7/grism pipeline lie in the ranges 4213-9445 K, respectively.444A crossmatching of the 369 stars in common to the SDSS and GALEX surveys shows that the Teff values from the more recent DR10/SSPP pipeline below 9000 K exhibit an tyical offsets of -25 K to -60 K relative to the DR7 and an r.m.s. of K. To date the body of work done on Teff-color calibrations of late type stars for Kepler stars has not been replicated for the DR10 temperatures. For this reason we use DR7 Teff values in this work. We did not attempt to evaluate the pipeline metallicities. These Teff values ultimately formed the basis for the empirical calibration of Teff for all but the extremes of the stellar photometric sample in this paper. Of our joined GALEX-SDSS spectroscopic sample, all but 4 stars have Kp 14.0, and likewise nearly all have SDSS-derived log g values consistent with their being dwarfs. From this we can refer to their Teff values by their main sequence spectral types, and the above range corresponds to spectral types A1-K6 (Drilling & Landolt (2000). Our 1 kK temperature bins have the following spectral type equivalence: 9 kK for spectral types for A3 and earlier, 8 kK for A4-A9, 7 kK for F0-F6, 6 kK for F7-G5, 5 kK for G6-K4, and 4 kK as K5 or later. We designate these ranges as types BA, A, F, G, K, and late-K. A few percent of our sample extends to early M dwarf and/or giant stars.
The procedure we follow is to calibrate the main sequence Teff distribution against the (FUV-NUV) color, and from that relation the SDSS-Teff with color. Once a Teff, relation is derived from the common GALEX-SDSS spectroscopic sample, we applied it to KIC stars in the FOV observed by GALEX and the KIS survey in the FOV. The GALEX colors for these are the same, but for the FOV region the use the colors are expressed in the Vega system and therefore differ by +0.47 magnitudes (Bianchi 2011) from the SDSS survey (which is based on the AB magnitude system). For purposes of comparison the mean reddening in the overall SDSS/GALEX field we surveyed is E 0.05 magnitudes. This is a very modest amount and is about three times smaller than toward stars in the Kepler FOV. In both surveys the reddenings are determined from an IR emission map over the sky produced by Schlegel et al. (1998). Because mean and the spread in the Interstellar Medium (ISM) reddening parameter given in the KIC is small, we did not attempt to correct the colors to their unreddened values for intergroup comparisons. In figures to be discussed, we display the computed reddening vectors from various reported transformations (e.g., Straizys et al. 1998, Bianchi 2011).
3.2. Selection of stellar parameters
3.2.1 Effective temperature scale
Our analysis depends on the calibration of SDSS and GALEX
colors with Teff and our calibration is based on
stars in the SDSS/GALEX sky. Their temperatures have a
rms errors of K and are on average
-90 K below the Pinsonneault et al. (2012) recalibration and about
125 K higher than the original KIC calibration for cool (Teff
6.5 kK) stars. In their photometric analysis of
cool stars, An et al. (2013) adopted a
Teff scale that is similarly 100 K higher
than the SDSS pipeline scale.
The Kepler Working Group on Stellar Properties (WGSP) has likewise
recommended that a Teff scale close to the Pinsonneault
one be used for the interim (Huber et al. 2014).
3.2.2 Surface gravity and dwarf/giant dichotomy
Another parameter relevant to an understanding of anomalous color populations is the surface gravity. At best, we can hope for no more than a clean separation between “giants” (luminosity classes I-III) and dwarfs. As we will see, the separation of these classes from high gravity objects (WDs, sdBs) can be confirmed by differences in red fluxes of the high gravity stars in various color-color diagrams. Primarily, the dwarf/giant separation can be accomplished by: a) evaluating the distributions of the two groups’ apparent magnitudes (distances from Sun), b) determining log g from photometry or spectrophotometry, e.g., by trusting values given in the KIC or (for non-FOV sky regions) the SDSS pipeline and rough determinations of log g, and c) relying on photometric measurements of the size of the Balmer jump, at least for the hot end (AF types) of our sample. In our study we make use of all these diagnostics. Most F-K stars in the four associations in the FOV (NGC 6866, NGC 6811, NGC 6819, and NGC 6791) are dwarfs and in principle would be counted as such. Yet, the first three clusters were not included in the GALEX surveys, and only one GALEX tile even brushed the edge of NGC 6791 field. Therefore, we could not make any luminosity class reassignments for these stars. This is unfortunate as it would be helpful to include clusters stars of known ages.
Histograms of log g’s from our separate KIC (FOV) and the SDSS/GALEX populations exhibit similar bimodal distributions. A primary peak is centered at log g= 4.0, and a secondary one at 3.2, with an interpeak midway in between. Ciardi et al. (2011) classify as giants those F and earlier-type stars with log g 3.5, G-type stars with log g 3.7 as well as K-M type stars with log g 4.0. These criteria are consistent with the study of Galactic thick disk (r 4 kpc) stars using SDSS spectra (Carollo et al. 2010). For those KIC stars examined by the Kepler WGSP and brighter than Kp = 14, the distribution of log g’s suggests that the percentage of giants and supergiants among AF stars is about 35% and includes most horizontal branch and RR Lyrae stars. The percentage of giants to dwarf levels off at 40% for G stars (Batalha et al. 2010) and rises again to about 50% among K and early M stars when the red giant branch is included (e.g., Mann et al. 2012). The general conclusion is that the number of dwarfs exceeds that of giants but by less than a factor of two. Aside from our exclusion, otherwise important, of faint (Kp 16.0) and thus most mid to late M-type stars, we found no reason to believe that our sample is different than the full KIC population.
Our provisional strategy was to use the simple Kepler magnitude for the GALEX-SDSS star populations. We note here that the Kp and magnitudes are generally within magnitudes of one another. We used the criterion described by Ciardi et al. 2011) as the demarcation between the space distribution of giants (Kp14.0) and dwarfs (Kp14.0). Of course this rough criterion admits some spillover from one group to the other. Mann et al. (2013) found that 7% of Kp14.0) dwarfs fall into the so-defined giant domain. A somewhat smaller percentage of apparently faint giants, perhaps 4%, fall into the dwarf pool. Therefore, as a secondary criterion, we required that the published KIC log g must be less than 4.0 to 3.5 dex, according to the Ciardi et al. demarcations. In the occasional conflict between these two criteria or if the KIC listed no log g value, we classified the star as a dwarf. This agrees with the findings of Huber et al. catalog (2014), which used spectroscopy and asteroseismology to estimate log g values. Given their study, 23% of “unclassified stars” (those 7% of KIC stars with Kp 14 and without listed log g values) are giants. In terms of “UV excess stars” described below, 98% of this group that we classify as dwarf stars are dwarfs (log g 4.0) in the Huber et al. catalog. Conversely, 96 % of the UV excess stars we call giant stars are giants in this catalog. Although the dwarf/giant dichotomy enters into our discussion below, our conclusions are not sensitive to the sizes of the two populations.
The study of stellar ages for solar-like stars in the thin Galactic disk has meanwhile proceeded apace. The derived ages support the general mix of giants and dwarfs in the KIC catalog. Although nucleocosmochronological techniques applied to the oldest stars in the thin disk suggest that some of them formed 8 Gyr ago (del Peloso et al. 2005), recent studies of the various stellar populations of the Galaxy (e.g., Soderblom, Duncan, & Johnson 1991, Carollo et al. 2010) generally find a typical age of 3-4 Gyr for stars in the solar neighborhood. In terms of stellar subpopulations this range includes F-K main sequence stars, BAF horizontal branch stars (including RR Lyr and Sct variables) and GK giants. It is chiefly to these groups that we now confine our attention.
4. Results
4.1. GALEX and SDSS photometry and spectroscopy
4.1.1 UV-optical colors and stellar parameters
Bianchi et al. (2007, 2011) used the , (FUV-NUV) color diagram with model Spectral Energy Distributions (SEDs) to differentiate stars from extragalactic objects, and to establish a stellar Teff relation with (FUV-NUV). These authors pointed out this color is nearly independent of reddening for a normal Galactic ISM color law (see Table 2 of Bianchi 2011). We plotted Teff values determined from the SDSS spectroscopic pipeline for the stars that SDSS and GALEX observed spectroscopically. The first result of this exercise is a diagonal sequence in Fig. 3 that reflects the relationship between SDSS Teff and (FUV-NUV).
We identified a group of stars within K of a smoothed quadratic fit of the diagonal distribution (solid symbols). These were mapped to the , (FUV-NUV) plane and a quadratic fit was then computed to define a calibration sequence for UV-normal stars. We next transformed this sequence by adding 0.47 magnitudes to the kic’s to obtain the equivalent in the KIS (Vega) system. Note here that many faint K and M stars with normal, weak UV fluxes are not captured in this sample.

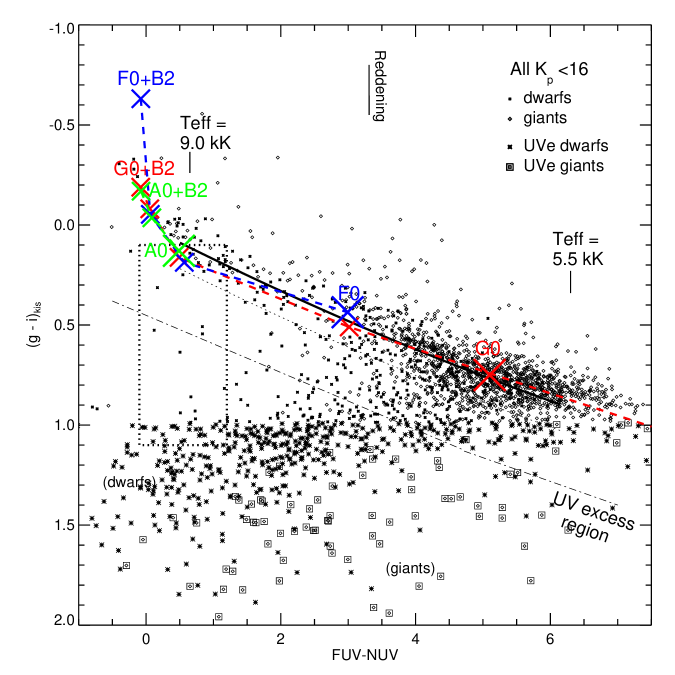
Figure 4 exhibits these stars plotted in the (FUV-NUV) kis plane and the UV-normal sequence curve. Note that by definition our sample of stars has (FUV - NUV) colors and thus is magnitude limited. This means that some mid-K and nearly all M stars with red UV colors are excluded.
Figs. 3 and 4 exhibit a secondary scatter in their respective lower left regions, that is, points falling below the dot-dashed line. The shifted colors of this population are mainly due to a blueing of the (FUV-NUV) color of typically 3-4 and occasionally 5 magnitudes and a much smaller amount of reddening in the color . The displacements from the primary sequence are less on average for the hotter stars and greatest for the cooler ones. We refer below to these objects as UV-excess (“UVe”) stars. We also note that when plotted on the sky plane the UVe stars exhibit no tendency to cluster, e.g., from membership in associations.
All but two stars represented in the lower left region of Fig. 3 have Kp 14.0, and all but eight have log gkic 3.5. This suggests that the great majority of them are dwarfs. As for the stars of Fig. 4 occupying the same region of the diagram, only about 15% (79/506) are giants, according to our brightness and KIC log g criteria. Also, one finds there that the ratio of UVe giants to dwarfs increases as one proceeds to the cooler K stars. In short, 22% of stars represented in this sample fall in the UVe zone to the lower-left. (The % error is derived by comparing the statistics in two halves of the FOV covered by the two KIS surveys.) This fraction is similar to the 17% figure we found in Fig. 3. Thus, we see that the statistics of the UVe stars are similar for populations observed using KIS photometry in the FOV and the high Galactic latitude portion of the sky covered by the SDSS survey.
From the annotations in Fig. 1 we can also see the effect of the differing degrees of scatter in the (FUV-NUV) color for stars in various Teff bins. Fig. 1 shows that the stars with the greatest UV blueing are the coolest ones. Also, the incidence of UVe is smallest among hot stars. Interestingly, when the giants are split out from the dwarfs, we see that the 5 kK dwarf group has a much bluer than the 5 kK giants. To a smaller extent this is true for the 4 kK (early M-type) stars as well. This is another way of demonstrating that the late-G/early-K dwarfs are subject to greater UV excesses than the giants. When arriving at our few M stars, the (FUV-NUV) colors of UVe giants exhibit decreases by similar amounts as dwarfs.
Our sample of GALEX-observed stars in the FOV imposes two countervailing
biases. The first bias depends upon the ratio of sky areas observed in the
NUV and FUV bands and second the loss of detections of FUV-normal (“red”)
stars. The area ratio is 1.15 and is magnitude independent. The second
effect increases the number of faint UVe stars relative to UV normal ones.
At Kp = 14.0 we find this bias in our reddest sample
(kis 1.0) is a 15% effect.
As one goes to Kp = 17.0
the bias increases to 40%. Even though our study limit was Kp = 16.0,
we use the Kp = 17 limit figure.
Then the ratio of these
two values, 1.15/1.40 = 0.82, will be used a rough estimate of the
incompleteness of the (FUV-NUV) colors and the fraction of
faint UV-normal stars that could be missed by the GALEX surveys.
Thus, we expect their UVe numbers are
overrepresented and should be corrected by this factor.
Do the UVe stars stand out among known binaries?
To pursue the possibility that the UVe stars are in binary systems, we consulted the Kepler Eclipsing Binary Catalog (EBC), version 3555The active (in this case, third) version of this catalog may be found on line at http://keplerebs.villanova.edu. (Matijevic et al. 2012) and asked whether the stars listed there and also observed by GALEX show similar UV excesses. We found 116 such stars. The KIC log g values for these stars range from 3.4 to 4.7. Even given the uncertainties in these photometrically derived values, few members of this sample are likely to have optical primary giants or supergiants, and probably none are WDs. Figure 5 depicts the relation between (FUV-NUV) and the KIC effective temperatures. One can see immediately that the distribution is much the same as in Fig. 3. In particular, the number of UVe stars in the lower left of the figure is 20, corresponding to a fraction of 17%, i.e., within the 17-22% range found for the GALEX-SDSS and Kepler FOV samples. In addition, the hotter main sequence stars are again relatively rare, and the (FUV-NUV) blue shifts are the largest for the coolest EBC primary stars. We also find that the distribution of orbital periods of the UVe stars is consistent with the UV-normal star population. For example, if we take those few stars with Porb days, a value chosen to mitigate effects in synchronous or mass-transferring binary systems, we still find no real difference between the UVe and UV-normal subsamples.
‘
We have also examined 12 members of the Kepler Objects of Interest (KOI), as listed (as of July, 2013) in the MAST archives, that have available (FUV-NUV) and colors and Teff or log g values from the EBC. All 12 have F-G spectral types, and all but one are dwarfs. We find their distribution in the (FUV-NUV), Teff diagram to be similar to those shown in the other figures. Only 2 of the 12 KOI members, K03868.01 and K01345.01, fall in the UVe region of this and the (FUV-NUV), diagrams. This is consistent with the 20% fractions found for our two larger populations.
We see from this study that the UVe population has a similar presence in EB systems and the general Galactic disk. This does not mean that binarity is a necessary condition for the UV excesses. In fact, as a counterexample to a binary scenario we can point out that one short-period Algol system in the Kepler FOV, WX Dra (KIC 10581918), fits the physical description of what a UVe system might look like. The KIC (photometric) Teff is 7252 K for this system. Spectral types for the two components have been estimated as A8 and KO (Budding et al. 2004). However, the colors of this system fall on the normal side of the UV-normal/UVe demarcation in Figs. 3 and 4. Clearly, binaries with cool and warm components are not necessarily UVe objects.
4.1.2 GALEX/NUV grism spectroscopy
In one of the few papers devoted to the characteristics of GALEX spectra of normal stars, Bertone & Chavez (2011) have demonstrated the common sense expectation that the flux gradients of spectra obtained with the NUV camera correlate well with spectral types, at least for Henry Draper stars in the range A0-K0. Surprisingly, no corresponding demonstration has been published to date for FUV spectra.
To rule out that the UVe stars’ small and negative (FUV-NUV) colors can arise from noise sources in the FUV filter, and recalling that there is almost no overlap of objects observed in SDSS grism program in the Kepler FOV, we searched through all the SDSS spectroscopic catalog for objects observed in the common GALEX-SDSS sky. Examples of these matches are shown in Figure 6 and are ordered in the panels by increasing (FUV-NUV) from lower left to upper right. This figure also annotates the SDSS Teff values and GALEX (FUV-NUV) colors. Also, following Bianchi (2011), we list computed GALEX colors that we computed by running spectral fluxes through GALEX filter transmission curves. These track both the catalog colors and the continua slopes.
The solid line in Fig. 6a depicts a GALEX spectrum of a G star with a modest positive slope with increasing with wavelength. However, this UV continuum slope is inconsistent with the star the star having a Teff= 5325 K, according to its SDSS optical spectrum. This example is tagged as the point marked with an arrow in Fig. 3 - it is a mild member of the UVe population. Indeed, the decrease in this star’s flux from 2700 Å to 1900 Å is only a factor of two or so, whereas according to Bertone & Chavez the flux reduction across this range should be ten times steeper for G stars of this effective temperature, 5325 K (see Figure 7).

Teff values of six F-G star examples in Fig. 6 lie in the range 5230-7363 K, and their (FUV-NUV) catalog colors range from +4.59 to -0.30. Two of the three spectra represented in the left panel have Teff values consistent with their being late G stars, from the SDSS pipeline whereas two of the examples in the right panel, associated with negative (FUV-NUV) colors, have Teff values corresponding to F types. This is consistent with the smaller blue displacements in UV color in Fig. 3 for warmer members of the UVe population and suggests once again that UV excesses are smaller for warm stars. Note also that the spectra do not show even a hint of emission in the C IV or Mg II h/k doublets.
Fig. 7 assembles FUV/NUV-merged spectra for four HD stars with types A7-K0 represented in Bertone & Chavez (2011). Annotations show the GALEX catalog UV color. The montage also compares these spectra with a UVe spectrum (shown in bold) displayed also in Fig. 6. The UVe star represented has a SDSS (optical) spectrum consistent with a middle F star; the UV continuum slope is indicative of an A star.
In assembling UV colors of these standards we note a curiosity that is confirmed in the catalog and simulated GALEX colors: the change in advancing color with spectral type ultimately decreases among the mid-G and K stars. In our G8 and K0 examples the UV color can overlap. The spectra show that this is because although the FUV continuum decreases with late types the strengthening of the NUV lines increases as well; the two effects nearly cancel. We speculate that this is because by G5 the NUV lines are still saturating whereas the lines in the FUV have already depressed the spectrum.

In any case, the key point from the spectrum figures is that since the continuum slopes track the (FUV-NUV) colors of these stars, there is no reason to doubt the GALEX colors. Instead, we must look to explanations involving stellar classes for the existence of UVe stars.
4.1.3 SDSS (optical) grism spectroscopy
To complement the GALEX UV spectra, we checked the SDSS archives with the on-line Spectroscopic Query Form to examine the appearance of optical spectra. We have used this tool to compare a number of spectra on either side of the UVe/UV-normal demarcation (dot-dashed) line in Figure 3. For brevity we display in Fig. 8 the first and second spectra in Fig. 6, i.e., the near-UV normal spectrum of GLX J172312.5+593928 as well as examples of spectra of two UVe stars, GLX J122321.1+155205 and GLX J121309.5+504539. The SDSS F9 template spectrum is also shown for reference.666SDSS spectral cross-correlation templates can be found at http://www.sdss.org/dr7/algorithms/spectemplates/. These examples summarize most though not all of the differences we find in these objects. In the great majority of cases, and allowing for equal effective temperatures, we find that blue fluxes are greater in the UVe stars.

Our SDSS spectra show similarities with those given by Yanny et al. (2009). In particular, their spectra of “F/G” and ”G giant” stars (their Figs. 9) are similar to our reference standard. However, our UVe star spectra exhibit somewhat a weakened Ca II K and IRT lines and G band with respect to the F9 template. According to Fig. 8, the line weakening extends to the Ca II triplet in the IR as well. This indicates that the line weakening is not necessarily entirely limited to short wavelengths. Indeed, we would expect that the cores of all these Ca II lines would be sensitive to the raising of the atmospheric temperature minimum associated with a strong chromosphere. All told, there is good evidence for a mild flux enhancement in the blue region of these optical spectra, either from a secondary star or a strong chromosphere.
4.2. Adding a 2MASS color to the mix
Another trait of the UVe population is their displacement from the “UV normal” stars in a 2-color UV/optical/IR diagram. In Figure 9 we replot the population from Fig. 4 in an (rkis-K), (FUV-NUV) diagram. Here the K magnitude refers to the 2MASS filter centered at 2.2 m. We see that even for the stars with small UV colors the distribution of UVe stars does not match the normal star distribution. The principal effect is that the (FUV-NUV) colors of the UVe stars are bluened by 4 magnitudes or so. Also, the optical/IR colors of the UVe giants are displaced to the red by at least 0.5 magnitudes. This shift appears to mirror the displacement of the UV-normal late-type giants in this diagram by about +1 magnitude. It is likely an aspect of the intrinsic redness of near-IR colors of late giants.

4.3. UV-red clump: segregating AF III and UVe stars
Smith & Shiao (2011) first noticed a UV-red “clump” island in the , color diagram. This clump feature is composed of stars with (FUV-NUV) 2.5 and values consistent with A and early F stars. But why should AF stars be surrounded within a sea of UV-blue stars, including stars with red optical colors and therefore low effective temperatures?
We addressed this question by first looking at the behavior of stars in the Kepler FOV in a SDSS-filter version of the Johnson , diagram - see the , plot (Figure 10). Straizys et al. (1998) have computed synthetic SDSS color indices for the main population sequences. As with other photometric systems, their work demonstrates the usefulness of the Balmer jump in separating A-F main sequence from higher luminosity stars. In particular, similar to what happens in the , color diagram, the effect of the Balmer jump is to make a marked kink in the , diagram, such that giants and especially dwarfs have nearly the same for a range of and values. Figure 10 shows these colors, again for KIS survey stars with Kp 16; UVe giants and dwarfs from Fig. 4 are denoted by separate symbols. We notice first that the UVe population coincides with the sequence of cool UV-normal stars. Second, the UVe stars, whether giant or dwarfs, are much redder in than UV-normal AF stars. We divided the region occupied by A and early F stars into Fig. 10 into two boxes, indicated by dashed lines. According to Straizys et al. these subregions are expected, from left to right, to be occupied mainly by giants, a mixed population, and giants, respectively. In fact, the fractions of giants in these boxes turn out to be 70%, 43%, and 30%, respectively, according to our Kp and KIC-derived log g criteria.

All stars within the giant-box and dwarf-box regions of Fig. 10 were flagged and are indicated in our , diagram (Figure 11) as blue diamonds and red triangles, respectively, whereas stars formerly marked UVe dwarfs and giants appear there as green asterisks or blue diamonds, respectively. Note first that the UVe giants are significantly redder the UVe dwarfs, similar to the reddening noted in Fig. 4. We see also that some 84% of the stars occupying the UV-red clump region (the trapezoid in Fig. 11) are AF stars. The other 16% in the clump region have SDSS Teff values, where they have been determined, consistent with late B or mid to late F spectral types. The fractions of the population spilling within and without the two trapezoid areas are consistent with the overlap of a wing from one (FUV-NUV) distribution shown in Fig 1 with the peak of the other. The temperature range represented in this region is Teff 6.5-9 kK. Some 70% of the total of 1785 stars in the UV-red clump zone are giants. This is virtually the same value, 71%, that Smith & Shiao (2011) found for UV-red clump stars observed in their independent sample. The numbers of dwarfs and giants in the middle region of the trapezoid (left uncolored in Fig. 11) are about equal.
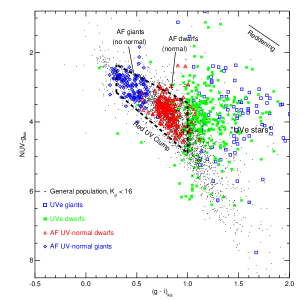
Does the UVe population avoid the UV-red clump? The answer is indeed yes. Only 1.4% of the UV-red clump stars were flagged as UVe in Fig. 4. The colors of the UVe population, dwarfs and even more so giants, are displaced to the red in of the trapezoid region.
In sum, the UV-red clump region is mainly occupied by UV-normal giant and dwarf AF stars. These are the stars in the upper left (calibrated UV-normal relation) of Fig. 4. These populations have blue (FUV-NUV) and colors that are consistent with the temperatures expected for normal single stars. In contrast, a comparatively large fraction of late-type stars are UVe stars. When these are added to the temperature class bins in Fig. 1, their influence is enough to move the mean (FUV-NUV) values markedly, causing the 4 kK and 5 KK symbols to march back to the blue in this diagram.
5. Discussion: Explanations for the UVe population
5.1. Confusion with unresolved extragalactic objects?
To address this question, we recap by first stating that we used the GALEX and SDSS galaxy-star separation flags to assemble our populations. Both the GALEX and SDSS pipelines assess whether the image of an object is point-like. This flag is robust for the SDSS survey down to 21.5 mag. (e.g., Lupton et al. 2002). The limit for GALEX is 3 magnitudes shallower, but still deeper than the 16.0 magnitude limit we imposed. A similar flag was used for the KIC, though it is taken from a variety of earlier photographic catalogs. Based on these flags and the review of spectral features the pipeline judges to be stellar, there is little chance that many of our stars could have been confused with even small resolved galaxies.
As a second consideration, Bianchi et al. (2007, 2009, 2011a) have examined the distribution of objects in the GALEX-SDSS sky with respect to the GALEX UV color and the SDSS and colors. They found that both hot and cool stars and QSOs with redshifts 1 are well separated in these diagrams. For example, In the diagram (Fig. 4 of Bianchi et al. 2011) QSOs inhabit the upper left region of the plot, i.e., ( 0.7, ) 2. This just abuts the region inhabited by UVe stars, according to Fig. 11. This just The QSOs principally fall in a box indicated by dotted lines in Fig 4. One can see that this population falls in between the UVe and UV-normal stellar populations in this diagram. Although it is possible that it would include a handful of objects in the UVe zone, we consider that QSO colors would not include most of the much larger sky area where our UVe objects fall. From this consideration we estimate the contribution to be 1% of our detected UVe objects. The upper limit here comes from the concentration of the extragalactic objects in a smaller color region and the fact that these objects are generally much fainter than the UVe stars.
Third, Bianchi et al. (2007) compiled a census of objects for the GALEX MIS and SDSS surveys as a function of the magnitude (close to the Kepler Kp). Scaling their numbers of objects found to =16 in the overlapping region, 86 deg2, to the overlapping Kepler/GALEX field, one predicts a total of about 587 unresolved galaxies and/or QSOs. This number drops to about 460 if the difference in ISM reddenings between the two sky regions (AFUV = 0.5 mags) is taken into account. The figure 460 falls short of the estimated 1012 (2506; 506 from 4.1.1) UVe objects in the full KIC field. So while the number of objects almost coincides, the shortfall is still significant. Because the Bianchi et al. numbers vary across the sky, and we have taken an average, we once again cannot completely rule out a minor contribution.
Finally, we will find that the fraction of UVe objects, 17-22%, in the Kepler FOV and GALEX-SDSS, magnitude-limited skies are, within errors, the same as the much more carefully vetted (and generally apparently brighter) members of Eclipsing Binaries and Kepler Objects of Interest, also discussed in 4.1.1. All members of these two groups are unquestionably stars.
For these reasons we reject the notion that a significant fraction (1%) of the UVe objects is extragalactic.
5.2. “False positive” stars along the line of sight to UVe objects
If the UVe of this population are in fact caused by foreground/background hot stars along the line of sight to a sky area subtended by the ground-based Kepler and KIS-extracted aperture of a cool star, this might explain the apparent contradiction in UV and optical band photometric colors. Several astronomers working directly with the Kepler Project have considered whether such chance alignments, so-called “false positives,” could be responsible for exoplanetary identifications among the Project’s list of “Kepler Objects of Interest” (KOIs). A recent simulation of the false positive occurrences for the KOI list by Fressin et al. (2013) predicted a rate of 9.4%. So, it is possible in principle that false positives could play a role in the positions of our UVe populations in the GALEX-SDSS two-color diagrams. However, this is actually not likely because false positives for the KOIs invariably refer to transits or interference by faint cooler stars, either red giants or lower main sequence stars. Since the space densities of hot stars are much lower, we do not expect hot background stars to contribute much to our UVe population. Likewise, hot WDs and subdwarfs have lower space densities (as well as smaller sampled volumes). Hence we rule out false positives too.
5.3. Could the UVe stars be WD or hot subdwarf binaries?
Because of their high temperatures the primary candidates for UV excess objects in recent surveys have invariably turned out to be WDs and sdOB stars, whether as single stars or primaries in binary systems. However, several published studies suggest that although WDs are an important constituent of the UV-excess population, they are not the right match to the UVe stars from our color diagrams. We take the WD group first and follow it by another candidate group, the sdB stars.
5.3.1 White dwarfs and single subdwarfs as candidates
After defining the loci of the main stellar populations in GALEX-SDSS color-color diagrams, Bianchi et al. (2007) showed that hot and warm (18 kK) WDs can be separated from other stellar populations according to their UV colors. One then asks could WD single or binary systems be the cause of the UV excesses of the UVe stars? The predicted WD locus in their , (FUV-NUV) plot suggests that a simple extrapolation of the colors of the WD sequence might overlap the UVe class.
Yet, closer examination of extant WD star lists establishes that this explanation is not promising. An unpublished list by Ostensen (2013) of 24 warm to cool WDs classified from stellar spectra shows that the stars are too faint (Kp 18) and/or fall in the wrong section of the (FUV-NUV), diagram to be considered as UVe members. Only three of the Ostensen objects fall within the upper left edge of the observed distribution, and all of them are fainter than the Kp = 16 magnitude limit we considered for our investigations. Cooler WDs do not continue this trend because their red and near-IR colors do not continue to increase. In addition, we find that the computed WD sequences in the , diagram follow a redder sequence in than do the main sequence and fainter stars (e.g. Verbeek et al. 2012b). A similar mismatch is depicted by the WD locus computed by Groot et al. (2009) in Fig. 10 (dotted line). For cool WDs the computed locus lies well to the red of most of the observed colors of our sample.
The Girven et al. (2012a) catalog of single DA white dwarfs verifies this conclusion with a much larger sample. The subset of this catalog population with GALEX and SDSS colors totals 12 149 stars. Only 0.18% of this population fill the upper left edge of the UVe region in our (FUV-NUV), diagram ( 0.7) Nearly all DAs from Girven et al. fall in the upper left region of Fig. 4, where the Bianchi et al. (2007, 2009) diagram predicts they should be. A handful of cooler stars (Teff= 6.5-9 kK) falls to the upper left (defined again as 0.7), but none of these spill into the UVe zone. In a similar , diagram, Girven et al. show that the DA stars have colors that are 1 to 5 magnitudes bluer than all objects in our KIS sample, including our UVe population.
This discussion assumes that catalog objects are either single stars or binary systems in which the late-type secondary companions contribute substantially to the optical/near-IR colors. Indeed, the fact that we find that the DA stars are restricted to a blue region, 0.7, in Fig. 4 would be consistent only with secondaries having early K0 spectral types or earlier.
Other instructive resources are the Rebassas-Mansergas et al. (2010, 2012) catalogs of white dwarf- main sequence (WDMS) systems. These binaries consist of visible wavelength primaries and dM secondaries. These authors’ , (FUV-NUV) figures of WDMS systems in the SDSS-GALEX sky show almost no overlap with our UVe zone. Rather, the UV excesses are significantly larger than our group, the only stellar class in our GALEX-SDSS survey for which this is true. Moreover, their WDMS have magnitudes of Kp = 19-20.
In addition, the space density of all WDs in the solar vicinity is estimated to be 3.2 10-3 M⊙ pc-3 (Holberg et al. 2008), or only about 10% of the local density of lower main sequence stars (Gilmore & Zeilik 2000).
In sum, neither single white dwarfs nor WDs in binaries with late-type secondaries are bright and numerous enough to contribute much to the UVe population.
5.3.2 The subdwarf B stars
Another interesting population to compare to our UVe population is the class of subdwarf B (sdB) stars. These core He-burning stars are found on the extreme blue end of the horizontal branch (eHB) and are thought to reside there for 160 Myrs. Thus, they form a rarer, though more luminous, population than the hot DA or DB stars.
Evolutionary models suggest a few possible routes to the formation of sdB stars, usually in close binaries (e. g., Han et al. 2003). However, it is unclear from observations that the observed frequency (40-70%) of short-period sdB binaries is as high as the models predict (Barlow et al. 2012). Some studies have reported that a substantial fraction of sdB binaries have F-K main sequence secondaries. For example, decompositions of binary sdB spectra suggest typical cross-overs for the fluxes of the two component stars in the blue-yellow wavelength range (Aznar Cuadrado & Jeffery 2001, Németh, Kawka, & Vennes 2012). Even though they emit primarily in the UV, the sdB components of such systems are so bright that usually they are the visible band primaries.
There are problems matching the detailed color anomalies of sdB binaries beyond those we have reported. The simulated sdB-dwarf binary zone in model binary SEDs by Girven et al. (2012b) is shown in our Fig. 9. One can see here that the distribution of our UVe population stars falls to the lower right of where these models indicate they would be. One can imagine a better agreement if the secondaries of sdB systems were late-type giants because this would redden the colors, moving the model locus to the right in the figure. However, we have seen that the fraction of giants among UVe stars is at most 22%. From Girven et al’s models best agreement with our colorimetric results is met when the UV excesses are smaller and hence the radii of the contaminating hot secondaries smaller. According to their work the best match in color-color diagrams for hot degenerate-main sequence binaries occurs for small radii, coresponding to the requirement log g 7. But such high log g values obtain only for WDs, not sdBs, and we all but ruled these out because of their faintness and low space densities.
The space density of sdB objects is only 10-6 M⊙ pc-3 (Nelemans 2013). Then the sdB population fails by two orders of magnitude to explain the UVe stars.
5.4. Other explanations
5.4.1 Color fitting with model binaries
Considering the presence of excess blue flux (Fig. 8), our focus on the cause of the UV color excesses should be directed towards populations that are almost comparable to the full UV-normal population itself. We have mentioned two such explanations. The first is that the chromospheres are strong (e.g., stellar youth). The second is subgiant-main sequence binaries with the components having only slightly unequal masses (e.g., blue stragglers). Such systems would have hot secondaries on the main sequence that dominate the UV and evolved primaries, possibly aged main sequence stars, subgiants or just evolved giants. The systems favor primaries being cool giants, for which temperature differences are greatest. However, the contribution from the hot dwarf secondaries would then be less because of their smaller radii. We consider here whether a viable parameter space exists for the nondegenerate binary scenario.
To address this question we tested whether fluxes of less evolved, hot secondaries dominate the GALEX UV colors of binary systems. We did this by folding the GALEX and SDSS filter transmission curves of each star, in the matter described by Bianchi (2009), and evaluating the summed fluxes in each filter. To carry out these tests we took atmospheric flux models for standard main sequence Teff, log g, and radii from Astrophysical Quantities (Cox 1999). We repeated the exercise for various ranges of temperatures and secondary radii.
Our computed colors show that for late/early type binary configurations, we could not explain the positions of the UVe stars in a (FUV-NUV), diagram. In Fig. 4 we indicate the sequences for G0, F0 and A0 optical primaries by colored crosses. Our computations show that temperature differences between the component binary stars carry the (FUV-NUV) and colors along the main sequence for single stars - but this is not what is required. As one moves to models with B type secondaries, the (FUV-NUV) color indeed becomes much bluer, but the effect on the color is also to make it too blue for a given shift in (FUV-NUV). As a result the vector extends approximately along the main sequence locus for single stars. For no combination of star component temperatures do we find that the color vectors move to the lower left (ar even horizontally) and into the UVe zone. Moreover, if the hot primary is a late-type giant instead of a main sequence star, the shifts toward bluer colors quickly become small or insignificant. These and all other trials from our models demonstrated conclusively that the colors of binary stars are not moved to the UVe zone. Accordingly, we must reject a cool-primary, hot-primary binary scenario.
5.4.2 Strong chromospheres?
Stellar ages and activity considerations:
In active G and K type stars the atmospheric temperature minimum occurs at large depths, causing higher temperatures to prevail above this point. If a chromospheric temperature rise is strong, it can influence the formation of strong UV/optical lines. The effects are greatest for the principal resonance lines such as Mg II (h/k) and Ca II (H/K) resonance lines, and therefore they are the first spectral features to be driven into emission. Also, enhanced emission of continuum flux first shows its presence in FUV spectra of young stars.
Several authors have found that the mean FUV emission decreases with age but levels off by about 1.5 Gyr (e.g., Pace & Pasquini 2004, Pace 2013). The mean NUV decay rate is less certain for older stars. Another consideration is that for a given age the enhanced flux from UV lines and continuum tends to be weaker as one proceeds along the main sequence to M stars (Guinan, Engle, & DeWarf 2009). Although the general dependences of these diagnostics on age have long been known broadly, recent work indicates that critical details of the age-activity-relation are still not understood. Contrary to earlier discussions, it is no longer clear that magnetic activity, whether measured by optical or X-ray flares, or strong chromospheric emission in the UV, is necessarily a reliable indicator of age or vice versa (Soderblom 2010). Indeed, like chromospheric strengths can be found in stars that are either very young or as old as the Hyades.
Despite these ambiguities ages of stars in the KIC can be estimated
from asteroseismology and from matching the colors and magnitudes to
up-to-date stellar isochrones. Mathur et al.
(2013) studied the pulsational mode structure of 22 bright solar-type stars
using different asteroseismological tools and found a uniform distribution of
ages in the range 3-11 Gyr.
More comprehensively, preliminary results based on
model fittings to isochrones computed from the Dartmouth Stellar Evolution
Database (Dotter et al. 2008) have been constructed by the
Kepler WG on Stellar Properties (Huber et al. 2014).
This work finds a flat distribution out to 5 Gyr,
a secondary flat distribution of older stars out to 15 Gyr with an incidence
of 40% as great as the incidence of the younger stars.
A caveat to this description is that below
0.5 Gyr there is a relative dearth, and then a significant
increase, of stars with ages of 0.5-1 Gyr. This estimate suggests
that the incidence of young ( 0.5 Gyr) stars is 4%.
This is about the same as the 3%
fraction of a total of 700 solar type stars that exhibit so-called “very
active” levels of K line emission (Bastien et al. 2013 and Bastien 2013).
These estimates, albeit preliminary, suggest that the active
chromospheres hypothesis cannot be dismissed.
Light curves and rotational periods:
Another clue to a G/K star’s age is its rotational period or, if no spot-induced modulation is observable, the presence of a “flat lined” light curve. To investigate this property we examined Kepler light curves of 55 “extreme UVe” stars for which (FUV-NUV) and kis colors are -2.9 and 0.4 magnitudes, respectively, from those indicated by the dot-dashed demarcation line in Fig. 4 and also have Kepler light curves in the MAST archives. Twenty nine dwarfs satisfied this criterion. Typical parameters for these are Teff 5000 K and log g 4.4. Contrary to the young active star hypothesis, a substantial fraction of these stars exhibit intermediate to long (7–23 day) rotational periods. Seven have light curves that can be described as “flat” or imperceptibly weak rotational signals. These are arguably old stars still on the main sequence. Light curves of the remaining extreme UVe stars are chaotic, possibly late-type Dor variables or eclipsing binaries. About half of these have been studied in detail (Basri et al. 2010, Prsa 2011, Walkowicz et al. 2011, Howard et al. 2012), but none has been called out as especially young stars. According to our search, most of the UVe stars are not very young.
Any results to be drawn from the statistics of binary and
chromospherically active stars are far from final. Indeed, if we take a
control sample of UV-normal Kepler-observed dwarfs, we find that their
light curves are not all flat or dominated by long rotational periods;
many of these stars are pulsators or eclipsing binaries. UV-normal
G stars with flat curves also exist (e.g., KIC 11606351), but so
are stars with short rotational periods (e.g., KIC 11658452; Prot
6 days). These are counterexamples to the proposition that
moderately rotating G stars must show UV excesses. In all, the light
curves provide neither refutation nor support for the idea that the
a young population with active chromospheres is responsible for the
UVe class.
Enhanced UV flux and X-ray activity:
Examples of UV color blueing of spectra of young solar-type stars have been documented (Ribas et al. (2005), Guinan & Engle (2006), and Linsky et al. 2012). These examples show that the far-UV continua of young G-M dwarfs can be over 3 magnitudes brighter relative to the continua of their oldest stars. This is in agreement with the photometric results of Findeisen, Hillenbrand, & Soderblom (2011). In addition, in Figure 12 we exhibit four merged IUE spectra for fluxes for four solar-type standards (all near G1 V) and for which ages have been estimated by Ribas et al. Here have we scaled the spectra to fluxes of unity at 3000 Å. These spectra clearly show a spread of fluxes below 2200 Å such that the younger stars have the greatest far-UV fluxes. Differences can be discerned even between the youngest two stars, EK Dra (0.1 Gyr), and 1 UMa (0.3 Gyr). Our computed (FUV-NUV) colors from their spectra are 4.93, 4.70, 6.44, and 6.19. The FUV span is only about 1 magnitudes. This is less than the 2 magnitudes range in the FUV region alone. Inspection of the spectra suggests that this difference is due to a confluence of Fe emission lines at 2000-2100 Å is stronger, e.g., for 1 UMa than for the very youngest star, EK Dra. Similarly, enhanced Fe lines are responsible for a (FUV-NUV) color inversion of the two older stars, although both FUV and NUV continuum levels maintain a monotonic sequence with age.

To examine the rotational/UV activity arguments further, we have cross-correlated the positions of the UVe stars in the Kepler field with HEASARC’s bright and faint Rosat All Sky Survey catalogs. Young stars with active chromospheres can be expected to exhibit strong soft X-ray flux. However, among our UVe sample we find only one solar-type star, KIC 10730406 that has even a barely significant (3) X-ray fluxes detected by the ROSAT surveys. (None of our stars were detected in the Chandra or RXTE imaging catalogs either, but their coverages of the Kepler fields are very small.) For a reddening-corrected distance of 700 pc for KIC 10730406, the implied Lx in the band 0.5-2 keV is 31030 erg s-1. This is consistent with a very young (30 Myr) star with a strong corona, but not with an older star. Yet many of our stars are more distant than this one, so it is possible that we might miss several X-ray active stars.
It may be a problem to suppose that young stars (e.g., 500-600 Gyr old) are even numerous enough to explain the observed population of UVe stars. The mean age of 3-4 Gyr quoted earlier for solar-type stars implies a more or less uniform distribution of ages. This argument carries even more weight for the UVe stars in our high latitude GALEX-SDSS sample. Similarly, the Eclipsing Binary Catalog suffers no known bias toward young stars (Prsa, priv. comm.). To the contrary, any biases in this catalog should be toward underrepresentation of large (evolved) stars in close binaries, not small ones on the ZAMS. Finally, those UV excesses that are observed in GK giants cannot be expected to arise from strong chromospheres. All this said, we would not be surprised if strong chromospheres of some late-type dwarfs, whether strong from their youth or association in close binaries, are the cause behind many or most of the UVe stars.
6. Summary and Conclusions
Spurred by curious features in GALEX-SDSS color diagrams found by Smith & Shiao (2011), we have investigated populations of solar-type stars (F-K dwarfs and some giants) with Kp 16.0 to demonstrate that at least 17% of them are observed with FUV excesses of about 3-4 magnitudes. The existence of these excesses is robust, and they are present with nearly the same frequency for three stellar samples we investigated: (1) the GALEX-SDSS overlap region of the sky, (2) those overlap regions of the Kepler FOV observed by the GALEX surveys, (3) the systems listed in the Kepler Eclipsing Binary Catalog. Among a smaller number taken from the KOI list, a subsample (2 of 12 stars) exhibits UV excesses consistent with these populations. GALEX and SDSS spectra of stars show that these excesses diminish from the far-UV wavelength region and are still visible in the blue and even through the visible region. The distribution of UVe stars in Fig. 4 suggests that the color is redder than the UV-normal stars that have the same spectral type and Teff. We speculate that the reddening of the visible band color arises from the protrusion of a strong chromosphere into the photosphere. The warmer temperature would produce a shift of the primary continuum contributor from the H- ion to bound-free transitions of hydrogen. This in turn shifts the formation of the near infrared continuum ( filter) deeper into the atmosphere, resulting in relatively more IR flux relative to the optical ( filter). A similar explanation may hold for the reddening in (r-K) color by UVe stars. Thus, the reddening of this color could be consistent with the strong chromosphere hypothesis.
In all, degenerate star populations (DA and sdOB stars) and especially chromospherically active F-K stars could contribute a minor fraction to the population of UVe stars. We estimate from their occurrence rates a total of no more than 2% and 4%, respectively. From the expectation that the number of young F-G main sequence stars is low, we are hard pressed to accept that they are numerous to account for the full UVe population by themselves. Considering the similar UVe population fractions in the GALEX-SDSS sky (Fig. 3), we estimate a floor of perhaps 15-17% of the apparent UVe population. One or more other populations are evidently needed to explain their numbers. With correction for the FUV incompleteness, this floor falls to 12-14%.
We summarize our evaluation of the contributions of the likeliest contributors to the UVe population in Table 1. Our estimates in the table for old yet chromospherically active stars and close binaries are taken from Pace (2013). Our assessment of the contributions of extragalactic and compact objects (WDs, sdBs) come our assessments in 5. We have added halo stars to the latter group as a minor possibility. Their expected numbers (Gilmore & Zeilik 2000) are only about one sixtieth of the UVe population. Moreover, their UVe excesses are not as large the as 3-4 magnitudes observed, and their rotations are slower than the moderate ones reported above. As noted, we estimate that roughly 4% of the F-K stars can be young (0.5 Gyr). Our total of 15% in the table is already optimistic and yet it falls short of our estimate of the observed fraction, 17-22%. However, if we multiply the observed rate by the FUV-incompleteness factor 0.82, estimated in 3.1, the corrected observed UVe rate becomes 14-18%. This puts us within striking distance of agreement to the SUBTOTAL line in the table. We represent this correction exercise in Table 1 by bringing the predicted component population rates to the observed values, i.e., by applying the factor’s reciprocal, 1.22, to the TOTAL line. The agreement is only modestly comforting because most of the estimated percentages are upper limits. Hence, we cannot be assured that we have identified all the components of the UVe population or their relative proportions.
As this paper was being refereed, A. Brown et al. (2013) reported on a study of young G-K V bright dwarfs in a 5 deg.2 Kepler field. They found that spectra of 51 out of 300 stars in their sample exhibit strong lithium lines and concluded tentatively that approximate equal numbers of the sample are young single stars and active binaries. This is consistent with our findings in Table 1.
| Contributing Population | Estimated Percentage |
|---|---|
| Extragalactic | 1 |
| WD, sdB, halo | 2 |
| Old active Stars | 5 |
| Active binaries | 4 |
| Young stars | 4 |
| SUBTOTAL: | 16% |
| FUV incompleteness corr.: | 1.22 |
| TOTAL: | 20% |
The existence of the UVe population influences the mean UV colors of another stellar group. Our UVe group consists mainly of late F to G and K stars. Yet the A/early-F stars, especially giants. are not among them. The AF stars constitute a distinct “UV blue” population because of their higher effective temperatures. In contrast, the UVe frequency is higher among GK and early M-type main sequence stars. This strongly pulls their mean (FUV-NUV) colors to the blue (Fig. 1). These late-type stars comprise the UV-blue stars in Fig. 2, and thus they appear to surround a “UV-red clump.” To complete this discussion, notice that the blue peak of the histogram in Fig. 1 is significantly augmented by the addition of faint, point-like extragalactic objects (Bianchi et al. 2007). This can be seen in the 17 Kp 19 mag. distribution broken out in this figure.
We look forward to detailed studies of the EBC systems and particularly KOI stars with UVe colors. These can determine if near-UV fluxes from the secondaries influence the colors of the primaries as they eclipse them. We also anticipate that radial velocity studies of many of these stars will refine the frequency estimates of active binaries. A study of the ages of these objects via asteroseismology will also address whether young active chromospheres can be expected to be prevalent after all. In that event one can hope to amass a sample of young planet-hosting stars to compare with older stars to find out how planet-bearing incidence changes with time and also to map the evolution of planetary system properties.
References
- (1)
- (2) Aznar Cuadrado, R., & Jeffery, C. S. 2001, A & A, 368, 994A
- (3)
- (4) Allende Prieto, C., Sivarani, T., Beers, et al. 2008, AJ, 136, 2070A
- (5)
- (6) Barlow, B. N., Wade, R. A., Liss, S. E., et al. 2012, ApJ, 758, 58B
- (7)
- (8) Bastien, F. A. 2013, priv. commun.
- (9)
- (10) Bastien, F. A., Stassun, K. G., Basri, G., et al. 2013, Nature, 500, 437B
- (11)
- (12) Batalha, N. M., Borucki, W. J., Koch, W. J., et al. 2010, ApJ, 713L, 713B
- (13)
- (14) Bertone, E., & Chavez, M. 2011, Ap. Sp. Sci., 335, 69B
- (15)
- (16) Bianchi, L. 2009, ApSS, 329, 11B
- (17)
- (18) Bianchi, L., Hutchings, J. B., Efremova, B., et al. 2009, AJ, 137, 3761B
- (19)
- (20) Bianchi, L. 2011, ApSS, 335, 51B
- (21)
- (22) Bianchi, L., Efremova, B., Herald, J., et al. 2011, MNRAS, 411, 2770B
- (23)
- (24) Bianchi, L., Rodriquez-Merino, L, Viton, M., et al. 2007, ApJS, 175, 659B
- (25)
- (26) Bianchi, L., Seibert, M.,Zheng, W., et al. 2005, ApJL, 2005, L27B
- (27)
- (28) Brown, A., Korhonen, H., Berdyugina, S., et al. 2010, Proc. IAUS No. 273, p. 78
- (29)
- (30) Brown, A., Ayres, T., Neff, J., et al. 2013, Second Kepler Science Conference, Nov. 4-8th, http://nexsci.caltech.edu/conferences/KeplerII/agenda.shtml
- (31)
- (32) Brown, T. M., Latham, D. W., Everett, M. E., et al. 2011, AJ, 142, 112B
- (33)
- (34) Budding, E., Erdem, A., Cicek, C., et al. 2004, A&A, 417 263B
- (35)
- (36) Carollo, D., Beers, T. C., Chiba, Masashi, et al. 2010, ApJ, 712, 692C
- (37)
- (38) del Peloso, E. F., da Silva, L., Porto de Mello, G. F., et al. 2005, A&A, 440, 1153D
- (39)
- (40) Dotter, A., Chaboyer, B., Jevremovi/’c, D., et al. 2008, ApJS, 178 89D
- (41)
- (42) Drilling, J. S., & Landolt, A. U. 2000, in Allen’s Astrophysical Quantities, ed. A. N. Cox (4th ed.: New York: AIP), 381
- (43)
- (44) Findeisen, K., Hillenbrand, L., & Soderblom, D. 2011, AJ, 142, 23F
- (45)
- (46) Fressin, F., Torres, G., Charbonneau, D., et al. 2013, ApJ, 766, 81F
- (47)
- (48) Gilmore, G. F, & Zeilik, M. 2000, in Allen’s Astrophysical Quantities, ed. A. N. Cox (4th ed.: New York: AIP), 471
- (49)
- (50) Girven, J., Gänsicke, B. T., Steeghs, D., et al. 2012a, MNRAS, 417, 1210G
- (51)
- (52) Girven, J., Steeghs, D., Heber, U., et al. 2012b, MNRAS, 425, 1013G
- (53)
- (54) Groot, P., Verbeek, K., Grimel, R. et al. 2009, MNRAS, 399, 323G
- (55)
- (56) Guinan, E. F., & Engle, S. G. 2006, IAU Symp. 258, vol. 14, eds. A. Gomez de Castro & M. Barstow, p. 395G
- (57)
- (58) Guinan, E. F., & Engle, S. G. 2012, ASPC, 451, 285E
- (59)
- (60) Guinan, E. F., Engle, S. G., DeWarf, L. E. 2009, AIPC, 1135, 244G
- (61)
- (62) Gunn, J. E., Siegmund, W. A., Mannery, E. J., et al. 2006, ApJ, 131, 2332G
- (63)
- (64) Han, Z., Podsiadlowski, Ph, Maxted, P. F., et al. 2003, MNRAS, 341, 649H
- (65)
- (66) Holberg, J. B., Sion, E. M., Oswalt, T., et al. 2008, AJ, 125, 1225H
- (67)
- (68) Huber, D., Mathews, J. P., Pinnonsault, M. H., et al. 2014, ApJS, 211, 2H
- (69)
- (70) Lee, Y. S., Beers, T. C., Sivarani, T., et al. 2008, AJ, 136, 2050L
- (71)
- (72) Linsky, J. L., Bushinsky, R., Ayres, T., Fontela, J., & France, K. 2012, ApJ, 745, 25L
- (73)
- (74) Lupton, R. H., Izevic, Z., Gunn, J. E. 2002, Proc. SPIE, 4836 350L
- (75)
- (76) Lupton, R. H., Izevic, Z., Gunn, J. E. 2002, Proc. SPIE, 4836 350L
- (77)
- (78) Mann, A. W., Gaidos, E., Lepine, S., et al. 2012, ApJ, 753, 90M
- (79)
- (80) Mann, A. W., Brewer, J. M., Gaidos, E., et al. 2013, AJ, 145, 52M
- (81)
- (82) Mathur, S., Metcalfe, T. S., Woitaszek, M., et al. 2012, ApJ, 749, 152M
- (83)
- (84) Matijevic, G., Prsa, A., Orosz, J. A., et al. 2012, AJ, 143, 123M
- (85)
- (86) Maxted, P. F., Heber U., Marsh, T., et al. 2001, MNRAS, 326, 1391M
- (87)
- (88) Morrissey, P., Conrow, T., Barlow, T. A. 2007, ApJS, 173, 682M
- (89)
- (90) Németh, P., Kawka, A., & Vennes, S. 2012, MNRAS, 427, 2180N
- (91)
- (92) Nelemans, G. 2013, ApSS, in press (arXiv:1302.0135)
- (93)
- (94) Oke, J. B., & Gunn, J. E. 1983, ApJ, 286, 713O
- (95)
- (96) Ostensen, R. 2013, priv. commun.
- (97)
- (98) Pace, G. 2013, A&A, 426, 1021P
- (99)
- (100) Pace, G., & Pasquini, L. 2004, A&A, 426, 1021P
- (101)
- (102) Pagano, I, Linsky, J. L., Valenti, J., et al. 2004, A&A, 415, 331
- (103)
- (104) Pinsonneault, M. H., An, D., Molenda-Zakowcz, J. et al. 2012, ApJS, 199, 30P
- (105)
- (106) Rebassa-Mansergas, A., Gänsicke, B. T., Schreiber, M. R., et al. 2010, MNRAS, 402, 620R
- (107)
- (108) Rebassa-Mansergas, A., Nebot Gömez-Moran, A., Schreiber, M. R., et al. 2012, MNRAS, 419, 806R (2013yCat..35369043N).
- (109)
- (110) Ribas, I., Guinan, E. F., Güdel, M., & Audard, M. 2005, ApJ, 622, 680R
- (111)
- (112) Schlegel, D. J., Finkbeiner, D. P., & Davis, M. 1998, ApJ, 500, 525S
- (113)
- (114) Smee, S. A., Gunn, J. E., Uomoto, A., et al. AJ 146, 32S
- (115)
- (116) Smith, M. A. & Shiao, B. 2011, Bull. AAS, 43, 140.16S
- (117)
- (118) Soderblom, D. R. 2010, Ann. Rev. Astron. Astrophys, 48, 581S
- (119)
- (120) Soderblom, D. R., Duncan, D. K., Johnson, D. R., 1991, ApJ, 375, 722S
- (121)
- (122) Stoughton, C., Lupton, R. H., Bernardi, M., et al. 2002, AJ, 123, 485S
- (123)
- (124) Straizys, V., Lazauskaité, R., Liubertas, R., et al., 1998, Baltic Astr., 7, 605S
- (125)
- (126) Vanden Berk, D. E., Richards, G. T., Bauer, A., et al. 2001, AJ, 122, 549V
- (127)
- (128) Verbeek, K., de Groot, E., Groot, P. J., et al. 2012a, MNRAS, 420, 1115V
- (129)
- (130) Verbeek, K., Groot, P. J., Scaringi, S., et al. 2012b, MNRAS, 426, 1235V
- (131)
- (132) Yanny, B., Rockosi, C., Newberg, H. J., et al. 2009, AJ, 137, 4377Y
- (133)
- (134) York, D. G., Adelman, J., Anderson, J. E., et al. 2000, AJ, 120, 1579Y
- (135)