Frequent Spin Reorientation of Galaxies due to Local Interactions
Abstract
We study the evolution of angular momenta of () galaxies utilizing large-scale ultra-high resolution cosmological hydrodynamic simulations and find that spin of the stellar component changes direction frequently, caused by major mergers, minor mergers, significant gas inflows and torques by nearby systems. The rate and nature of change of spin direction can not be accounted for by large-scale tidal torques, because the latter fall short in rates by orders of magnitude and because the apparent random swings of the spin direction are inconsistent with alignment by linear density field. The implications for galaxy formation as well as intrinsic alignment of galaxies are profound. Assuming the large-scale tidal field is the sole alignment agent, a new picture emerging is that intrinsic alignment of galaxies would be a balance between slow large-scale coherent torquing and fast spin reorientation by local interactions. What is still open is whether other processes, such as feeding galaxies with gas and stars along filaments or sheets, introduce coherence for spin directions of galaxies along the respective structures.
1 Introduction
The angular momentum or spin of galaxies is a physical quantity that is far from being fully understood but is of fundamental importance to galaxy formation and cosmological applications. While N-body simulations have shed useful light on spin properties of dark matter halos (e.g., Vitvitska et al., 2002), it is expected that, given the vastly different scales between the stellar component and dark matter halo component and different physical processes governing stellar, gas and dark matter components, the angular momentum dynamics of galaxies may be quite different and not necessarily inferable from N-body simulations with any reasonable accuracy. We herewith perform a detailed analysis of the dynamics of spin of galaxies in a full cosmological context, utilizing ab initio LAOZI cosmological hydrodynamic simulations of the standard cold dark matter model (Cen, 2014) with an unprecedented galaxy sample size and ultra-high numerical resolution. This paper is the second in the series “On the Origin of the Hubble Sequence”.
2 Method
The reader is referred to Cen (2014) for detailed descriptions of our simulations and validations. Briefly, we perform cosmological simulations with the adaptive mesh refinement hydrocode, Enzo (The Enzo Collaboration et al., 2013). The periodic box has a size of Mpc, within which a zoom-in box of a comoving size of Mpc3 is emdedded. The resolution is better than pc (physical). The cosmological parameters are the same as the WMAP7-normalized (Komatsu et al., 2010) CDM model.
We identify galaxies using the HOP algorithm (Eisenstein & Hut, 1998) operating on the stellar particles. A sample of galaxies with stellar masses greater than are used. For each galaxy at a genealogical line is constructed from to by connecting galaxy catalogs at a series of redshifts. Galaxy catalogs are constructed from to at a redshift increment of (corresponding to Myr at ) and from to at a redshift increment of (corresponding to Myr at ). The parent of each galaxy is identified with the one at the next higher redshift catalog that has the most overlap in stellar mass.
We compute the specific angular momentum vector for stars of each galaxy within a radius at each output snapshot . The time derivative of is computed as
| (1) |
One notes that due to the finite number of outputs for our simulation data, is somewhat underestimated in cases of rapid changes of angular momentum on time scales shorter than our snapshot intervals. A similar definition for gas is also used. We denote as the time required to change the spin vector by degree of arc at each snapshot for each galaxy, defined as
| (2) |
where is the unit vector of . For the first time, we address the evolution of the spin of galaxies statistically in a cosmological setting. All length units below will be physical.
3 Results
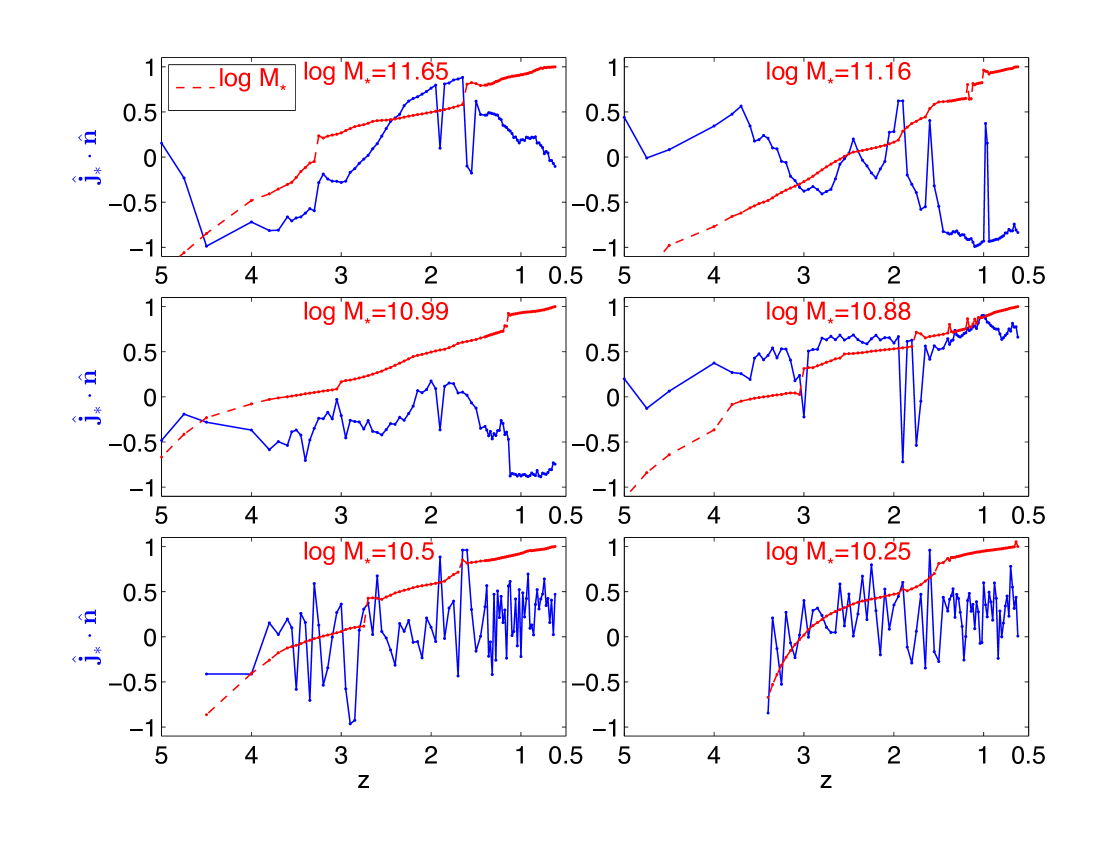
Figure 1 shows the dot product of the unit vector of the specific angular momentum of the central 3kpc radius stellar region and an arbitrary fixed unit vector as a function of redshift in blue. It is visible that a significant increase in stellar mass within a short period of time (i.e., mergers) is often accompanied by dramatic changes in angular momentum vectors. We note that the angular momentum vector of a galaxy over its history displays a substantial amount of change even in “quiet” times without major mergers. Ensuing analysis provides some physical insight into this.
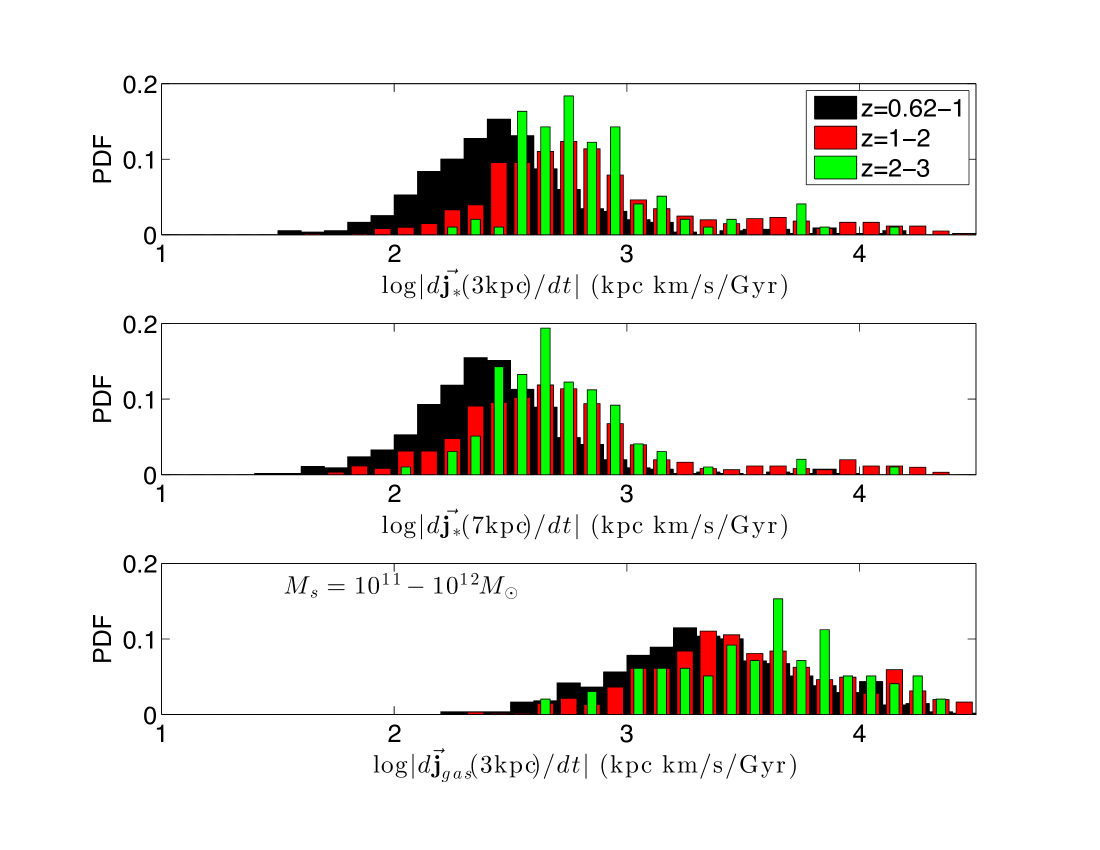
The top panel of Figure 2 shows the PDF of the time derivative of specific angular momentum of the central kpc radius stellar regions for galaxies of stellar mass in the range . The middle panel shows the same as in the top panel, except it is for the central kpc radius stellar regions. We see that the overall rate of change of angular momenta is significantly higher at compared to that at . The distribution of has an extended tail at the high-end, due to major mergers; due to our finite time sampling these rates are capped by the frequency of our snapshots. Consistent with the expected decline of major merger rate below , the high tail of the distribution at is significantly less pronounced. No major difference is seen between kpc and kpc cases, suggesting that angular momentum changes within the two radii are approximately in tandem and our analysis is robust using kpc. The choice of proper kpc is appropriate by noting that a (spiral, elliptical) galaxy of stellar mass is observed to have a size of kpc (Shen et al., 2003) for low redshift galaxies. The size roughly scales with the root of the stellar mass and decreases with increasing redshift (e.g., Trujillo et al., 2006).
The bottom panel of Figure 2 shows the PDF for gas in the central kpc radius region. We see that the specific angular momenta of the gas within central kpc change at rates times higher than that of stars (top panel of Figure 2). There is no doubt that gas inflows contribute significantly to the change of the stellar angular momentum in two ways. First, significant gas inflows at inclined angles to the stellar mid-plane may torque the stars (and vice versa). Second, new gas that reaches there will form new stars that have different angular momentum vector and cause the overall angular momentum to change in both direction and magnitude. At high redshift the orientation of the gas inflows on large scales are not well correlated with that of the stars or gas that is already there. Since the amount of gas tend to be smaller than that of stars, it is easier to alter the angular momentum of the gas than that of the stars. In the absence of major mergers, we expect minor stellar mergers could also alter the angular momentum vector.
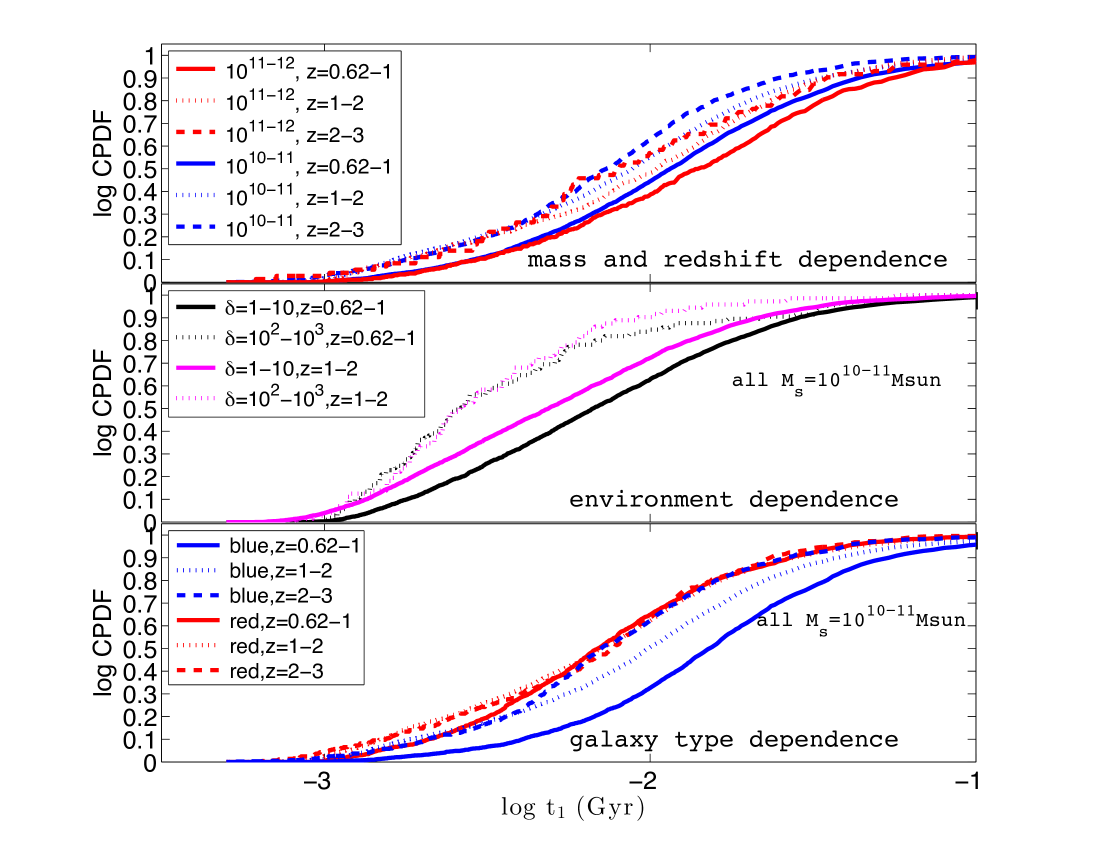
Figure 3 shows the CPDF of the time to change the direction of spin of the central kpc radius stellar region by degree of arc, for dependence on mass and redshift (top panel), environment (middle panel) and galaxy type (bottom panel). Consistent with Figure 2 we see that the frequency of spin direction change increases with redshift; the median decreases by from to with the higher mass group corresponding to the high end of the range of change. The median decreases by from to with the dependence on mass somewhat stronger at low redshift than at high redshift. That less massive galaxies tend to experience more rapid changes of specific angular momenta is anecdotally apparent in Figure 3. We also find large mis-alignment between inner stellar (and gas) regions with outer halos (not presented here), in broad agreement with the conclusions of Hahn et al. (2010).
A dependence on environment is seen in the middle panel, with the median decreasing by a factor of from to ; the environment dependence weakens at higher redshift. This finding that the spin direction of galaxies changes more frequently in dense environment can be attributed to enhanced local interactions there. In the bottom panel the dependence on galaxy type gives mixed trends. For blue () galaxies the median decreases steadily from to by a factor of , whereas for red () galaxies the median hardly changes from to . The median for red galaxies is comparable to that of blue galaxies at ; at lower redshift the median for red galaxies becomes progressively lower compared to that of blue galaxies, mainly due to the latter increasing with decreasing redshift. In Cen (2014) we show that the vast majority of red galaxies do not gain significant stellar mass in the red sequence. Thus we conclude that the rapid change of spin direction for red galaxies are due to torques by nearby galaxies, whereas blue galaxies are subject to all three local interactions - gas accretion, stellar accretion and torques.
It is instructive to put the frequency of spin direction change into some perspective. For a point mass of at a distance , the torque of on the galaxy with a quadrupole moment and angular momentum is (e.g., Peebles, 1969), where is the angle between the separation vector and the symmetry axis of the galaxy. Expressing in terms of overdensity of the region centered on mass , , where is redshift, the mean mass density at . Approximating spirals as flat axisymmetric uniform disks with (giving the quadrupole moment of ) and full rotation support. This allows to express the torquing time , defined to be the time taken to change the spin direction by degree of arc,
| (3) |
giving Gyr for , and for spiral galaxies. Comparing to the median Gyr seen in Figure 3, it is evident that the rapid spin reorientation of galaxies can not possibly be due to tidal torques by large-scale structure. It is noted that the intrinsic alignment sourced by primordial large-scale gravitational field is inconsistent with the frequent directional change shown in Figure 1.
Under the (unproven) assumption that the large-scale tidal field is the sole alignment agent, any alignment between galaxies on large-scales would result from a balance between the fast reorientation rate due to local processes and slow coherent torques by large-scale structure, which is expressed as the ratio to , denoted as . If the quadrupole of the galaxy is, in this case, produced by loal interactions, independent of the large-scale tidal field, the alignment in this simplified model would be linear [instead of quadratic, see Hirata & Seljak (2004)] to the large-scale gravitational tidal field. We obtain finally the expression for the mean value of weighted by the distribution of [, shown in Figure 3], denoted as :
| (4) |
at redshift for galaxies of mass and type (spiral or elliptical). We approximate elliptical galaxies as oblate axisymmetric spheroids with and , resulting in the quadrupole moment of . The sizes of galaxies are adopted from observations by Shen et al. (2003). The bias factor is from Tegmark et al. (2004) adjusted to . The stellar mass to light ratio as a function of absolute magnitude is taken from from Kauffmann et al. (2003). We incorporate these into to get
| (5) |
as well as into in Equations (3) for different galaxy types, where is the linear density growth factor normalized to be unity at , is the bias factor of galaxies of mass ,
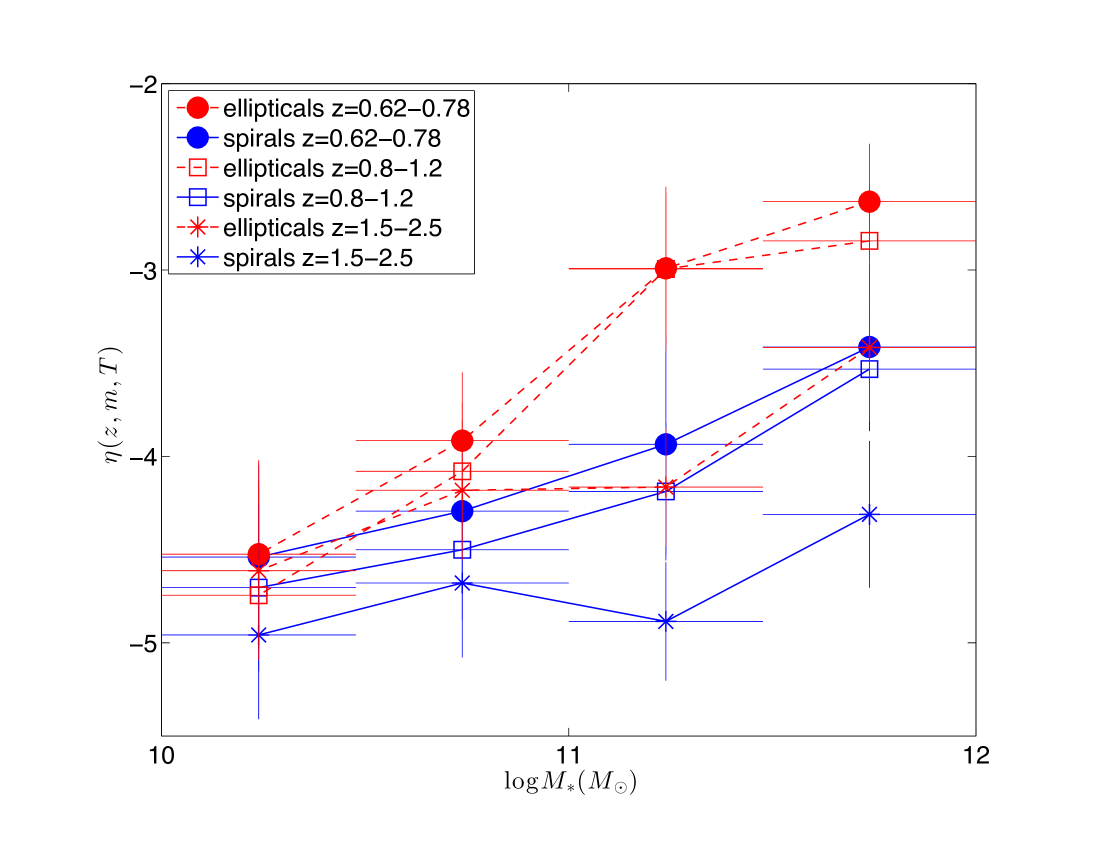
The results using Equation (4), in conjunction with Equations (3, 5), are shown in Figure 4. As in the linear alignment model (e.g., Catelan et al., 2001), the difficulty is to define a demarcating scale between local and linear large-scale structures. We tentatively have left the scalings to be relative, absorbed into . If compelled to give an estimate relevant to weak lensing, one might choose to be in the range . In this case, we get a tangential sheer that is times in Figure 4, resulting in of for the most massive elliptical galaxies (i.e., luminous red galaxies, LRGs, red dots in Figure 4), which, coincidentally, falls in the range of observed GI (galaxy-gravitational tidal field) signal for LRGs (e.g., Mandelbaum et al., 2006; Hirata et al., 2007; Joachimi et al., 2011). The negative sign comes about, because the galaxies, under the torque of a central mass, have a tendency to align their disks in the radial direction that is dynamically stable.
Three separate trends with respect to , and are seen: the alignment (1) decreases with increasing redshift, (2) decreases with decreasing stellar mass, and (3) is larger for elliptical galaxies than for spiral galaxies. The first two trends are accounted for by trends of seen in Figure 3. The last trend requires some discussion. The bottom panel of Figure 3 shows that ellipticals have shorter than spirals, due to a large part to their residing in overdense environments and in addition to their having a lower overall specific angular momentum amplitude. However, also because the specific angular momentum of ellipticals is a factor of lower than that of spiral galaxies, elliptical galaxies are easier to slew.
It is argubly a relatively more straight-forward comparison to observations of (radial) alignments of satellite galaxies with respect to the central galaxies of groups and clusters. But this is in fact complicated by (at least) four issues. First, the observed detection and non-detection of radial alignment of galaxies around groups and clusters of galaxies concern radial ranges that are already mostly in the nonlinear regime (i.e., overdensity ). Second, most of the observed galaxy samples analyzed contain of order 100-10000 galaxies, hence statistical uncertainties are in the range of . Third, observed samples likely contain a large number of projected galaxies with physical separations that are much larger than their lateral distance from the cluster/group center; the degree of projection effects is strongly dependent on the orientation of the line of sight (e.g., viewing a cluster along a filament) and significantly complicates interpretation of results. Fourth, on some very small scales, binary interactions between a satellite and the central galaxy may play the dominant role. A combination of these factors may explain the current confused state with conflicting observational results (e.g., Bernstein & Norberg, 2002; Pereira & Kuhn, 2005; Agustsson & Brainerd, 2006; Torlina et al., 2007; Faltenbacher et al., 2007; Hao et al., 2011). Nonetheless, we expect that the radial alignment, if exists, is expected to decrease with increasing redshift, perhaps already hinted by some observations (e.g., Hung & Ebeling, 2012), and with decreasing cluster mass at a fixed radius.
The simple model presented has two notable caveats. First, it assumes that the only alignment mechanism is gravitational torque by some large-scale structure. So far we have presented only the relative scalings among different galaxies under this assumption, but not the absolute magnitude. We cannot justify this rather critical assumption with confidence at this time. Second, one notes that a significant portion of the galaxy spin direction reorientation is likely due to gas feeding and substructure merging. Thus, it is not unreasonable to expect that the gas feeding and substructure merging have some preferred directions, such as along the filaments and sheets. In this case, while galaxy spin direction changes frequenctly as shown here, it may do so with some degree of coherence over some scales (such as the scale of filaments), either temporaneously or through long-term memory of large-scale structure (e.g., Libeskind et al., 2012). If this were true, it then suggests that intrinsic alignments may be a result of balance between high-frequency random re-orientation at short time scales and some sort of large-scale “mean” feeding pattern on long time scales. There is some empirical evidence for galaxies to be aligned with large-scale structures in a sense that is consistent with this “feeding” picture (e.g., Zhang et al., 2013; Li et al., 2013). It should be a priority to understand this issue systematically.
4 Conclusions
Utilizing ab initio Large-scale Adaptive-mesh-refinement Omniscient Zoom-In cosmological hydrodynamic simulations (LAOZI Simulation) of the standard cold dark matter model, we study the evolution of angular momenta of massive () galaxies. The simulation has an ultra-high resolution of pc/h and contains more than 300 galaxies with stellar mass greater than . We find that spin of the stellar component changes direction frequently, caused by major mergers, minor mergers, significant gas inflows and torques by nearby systems, with a median time in the range Myr for directional change of spin vector by degree of arc. The spin of the gas component changes at a factor of higher rates than the stellar component. Because the processes that are responsible are mostly in the nonlinear regime. we do not expect that the findings significantly depend on precise cosmological parameters,
The rate of change of spin direction can not be accounted for by large-scale tidal torques, because the latter fall short in rates by orders of magnitude. In addition, the nature of change of spin direction - apparent random swings - is inconsistent with alignment by linear density field. A new paradigm emerging with respect to intrinsic alignment of galaxies is that it is determined, primarily, by a balance between slow large-scale coherent torquing (if it were the sole alignment process) and fast spin reorientation by local interactions. This suggests that a significant revision to the large-scale tidal torque based alignment theory is perhaps in order. A simple analysis presented here indicates that intrinsic alignment of galaxies is dependent on redshift, luminosity, environment and galaxy type. Specifically, it is found that the alignment (1) decreases with increasing redshift, (2) decreases with decreasing stellar mass, and (3) is larger for elliptical galaxies than for spiral galaxies. While no detailed comparisons are made, the found trends appear to be broadly consistent with and thus provide the physical basis for the observed trends.
What remains open is whether other processes, such as feeding galaxies with gas and stars along filaments or sheets, introduce some coherence of their own kind for spin direction of galaxies along the respective structures. This will require a separate study in greater detail.
I would like to thank Claire Lackner for providing the SQL based merger tree construction software, and (Turk et al., 2011) for providing the very useful analysis and visualization program yt. Computing resources were in part provided by the NASA High-End Computing (HEC) Program through the NASA Advanced Supercomputing (NAS) Division at Ames Research Center. This work is supported in part by grant NASA NNX11AI23G. The simulation data are available from the author upon request.
Conclusions
- Agustsson & Brainerd (2006) Agustsson, I., & Brainerd, T. G. 2006, ApJ, 644, L25
- Bernstein & Norberg (2002) Bernstein, G. M., & Norberg, P. 2002, AJ, 124, 733
- Catelan et al. (2001) Catelan, P., Kamionkowski, M., & Blandford, R. D. 2001, MNRAS, 320, L7
- Cen (2014) Cen, R. 2014, ApJ, 781, 38
- Eisenstein & Hut (1998) Eisenstein, D. J., & Hut, P. 1998, ApJ, 498, 137
- Faltenbacher et al. (2007) Faltenbacher, A., Li, C., Mao, S., van den Bosch, F. C., Yang, X., Jing, Y. P., Pasquali, A., & Mo, H. J. 2007, ApJ, 662, L71
- Hahn et al. (2010) Hahn, O., Teyssier, R., & Carollo, C. M. 2010, MNRAS, 405, 274
- Hao et al. (2011) Hao, J., Kubo, J. M., Feldmann, R., Annis, J., Johnston, D. E., Lin, H., & McKay, T. A. 2011, ApJ, 740, 39
- Hirata et al. (2007) Hirata, C. M., Mandelbaum, R., Ishak, M., Seljak, U., Nichol, R., Pimbblet, K. A., Ross, N. P., & Wake, D. 2007, MNRAS, 381, 1197
- Hirata & Seljak (2004) Hirata, C. M., & Seljak, U. 2004, Phys. Rev. D, 70, 063526
- Hung & Ebeling (2012) Hung, C.-L., & Ebeling, H. 2012, MNRAS, 421, 3229
- Joachimi et al. (2011) Joachimi, B., Mandelbaum, R., Abdalla, F. B., & Bridle, S. L. 2011, A&A, 527, A26
- Kauffmann et al. (2003) Kauffmann, G., Heckman, T. M., White, S. D. M., Charlot, S., Tremonti, C., Brinchmann, J., Bruzual, G., Peng, E. W., Seibert, M., Bernardi, M., Blanton, M., Brinkmann, J., Castander, F., Csábai, I., Fukugita, M., Ivezic, Z., Munn, J. A., Nichol, R. C., Padmanabhan, N., Thakar, A. R., Weinberg, D. H., & York, D. 2003, MNRAS, 341, 33
- Komatsu et al. (2010) Komatsu, E., Smith, K. M., Dunkley, J., Bennett, C. L., Gold, B., Hinshaw, G., Jarosik, N., Larson, D., Nolta, M. R., Page, L., Spergel, D. N., Halpern, M., Hill, R. S., Kogut, A., Limon, M., Meyer, S. S., Odegard, N., Tucker, G. S., Weiland, J. L., Wollack, E., & Wright, E. L. 2010, ArXiv e-prints
- Li et al. (2013) Li, C., Jing, Y. P., Faltenbacher, A., & Wang, J. 2013, ApJ, 770, L12
- Libeskind et al. (2012) Libeskind, N. I., Hoffman, Y., Knebe, A., Steinmetz, M., Gottlöber, S., Metuki, O., & Yepes, G. 2012, MNRAS, 421, L137
- Mandelbaum et al. (2006) Mandelbaum, R., Seljak, U., Kauffmann, G., Hirata, C. M., & Brinkmann, J. 2006, MNRAS, 368, 715
- Peebles (1969) Peebles, P. J. E. 1969, ApJ, 155, 393
- Pereira & Kuhn (2005) Pereira, M. J., & Kuhn, J. R. 2005, ApJ, 627, L21
- Shen et al. (2003) Shen, S., Mo, H. J., White, S. D. M., Blanton, M. R., Kauffmann, G., Voges, W., Brinkmann, J., & Csabai, I. 2003, MNRAS, 343, 978
- Tegmark et al. (2004) Tegmark, M., Blanton, M. R., Strauss, M. A., Hoyle, F., Schlegel, D., Scoccimarro, R., Vogeley, M. S., Weinberg, D. H., Zehavi, I., Berlind, A., Budavari, T., Connolly, A., Eisenstein, D. J., Finkbeiner, D., Frieman, J. A., Gunn, J. E., Hamilton, A. J. S., Hui, L., Jain, B., Johnston, D., Kent, S., Lin, H., Nakajima, R., Nichol, R. C., Ostriker, J. P., Pope, A., Scranton, R., Seljak, U., Sheth, R. K., Stebbins, A., Szalay, A. S., Szapudi, I., Verde, L., Xu, Y., Annis, J., Bahcall, N. A., Brinkmann, J., Burles, S., Castander, F. J., Csabai, I., Loveday, J., Doi, M., Fukugita, M., Gott, III, J. R., Hennessy, G., Hogg, D. W., Ivezić, Ž., Knapp, G. R., Lamb, D. Q., Lee, B. C., Lupton, R. H., McKay, T. A., Kunszt, P., Munn, J. A., O’Connell, L., Peoples, J., Pier, J. R., Richmond, M., Rockosi, C., Schneider, D. P., Stoughton, C., Tucker, D. L., Vanden Berk, D. E., Yanny, B., York, D. G., & SDSS Collaboration. 2004, ApJ, 606, 702
- The Enzo Collaboration et al. (2013) The Enzo Collaboration, Bryan, G. L., Norman, M. L., O’Shea, B. W., Abel, T., Wise, J. H., Turk, M. J., Reynolds, D. R., Collins, D. C., Wang, P., Skillman, S. W., Smith, B., Harkness, R. P., Bordner, J., Kim, J.-h., Kuhlen, M., Xu, H., Goldbaum, N., Hummels, C., Kritsuk, A. G., Tasker, E., Skory, S., Simpson, C. M., Hahn, O., Oishi, J. S., So, G. C., Zhao, F., Cen, R., & Li, Y. 2013, ArXiv e-prints
- Torlina et al. (2007) Torlina, L., De Propris, R., & West, M. J. 2007, ApJ, 660, L97
- Trujillo et al. (2006) Trujillo, I., Förster Schreiber, N. M., Rudnick, G., Barden, M., Franx, M., Rix, H., Caldwell, J. A. R., McIntosh, D. H., Toft, S., Häussler, B., Zirm, A., van Dokkum, P. G., Labbé, I., Moorwood, A., Röttgering, H., van der Wel, A., van der Werf, P., & van Starkenburg, L. 2006, ApJ, 650, 18
- Turk et al. (2011) Turk, M. J., Smith, B. D., Oishi, J. S., Skory, S., Skillman, S. W., Abel, T., & Norman, M. L. 2011, ApJS, 192, 9
- Vitvitska et al. (2002) Vitvitska, M., Klypin, A. A., Kravtsov, A. V., Wechsler, R. H., Primack, J. R., & Bullock, J. S. 2002, ApJ, 581, 799
- Zhang et al. (2013) Zhang, Y., Yang, X., Wang, H., Wang, L., Mo, H. J., & van den Bosch, F. C. 2013, ApJ, 779, 160