Influence of interactions with non-condensed particles on the coherence of a 1D polariton condensate
Abstract
One-dimensional polariton condensates (PoCos) in a photonic wire are generated through non-resonant laser excitation, by which also a reservoir of background carriers is created. Interaction with this reservoir may affect the coherence of the PoCo, which is studied here by injecting a condensate locally and monitoring the coherence along the wire. While the incoherent reservoir is mostly present within the excitation laser spot, the condensate can propagate ballistically through the wire. Photon correlation measurements show that far from the laser spot the second order correlation function approaches unity value, as expected for the coherent condensed state. When approaching the spot, however, the correlation function increases up to values of 1.2 showing the addition of noise to the emission due to interaction with the reservoir. This finding is substantiated by measuring the first order coherence by a double slit experiment, which shows a reduced visibility of interference at the excitation laser spot.
pacs:
71.36.+c, 42.55.Px, 42.55.Sa, 73.22.LpI introduction
After the demonstration of Bose-Einstein-Condensation (BEC) of alkali atoms Davis et al. (1995); Anderson et al. (1995) the efforts to observe condensation phenomena in condensed matter were intensified, because the small mass of candidate excitations promises high condensation temperatures. Particularly promising are polaritons in semiconductor microcavities in the strong coupling regimeWeisbuch et al. (1992): due to their photon admixture the polariton mass is extraordinarily small, enabling condensation under ambient conditions. The efforts soon rendered success with demonstration of polariton condensation in several semiconducting materials. Deng et al. (2002); Kasprzak et al. (2006); Balili et al. (2007); Christopoulos et al. (2007); Franke et al. (2012) In the meantime unambiguous criteria to distinguish polariton lasing by a polariton condensate (PoCo) from photon lasing have been worked out. Bajoni et al. (2007); Sanvitto et al. (2010); Aßmann et al. (2011); Tempel et al. (2012); Schneider et al. (2013)
A polariton laser promises low power consumption as it operates without the need for population inversion.Imamoglu et al. (1996) For practical applications the carriers have to be injected non-resonantly with significant excess energy, e.g., by electrical currents, as demonstrated very recently.Schneider et al. (2013); Bhattacharya et al. (2013) Consequently, during relaxation a broad distribution of background carriers is generated. This might limit the performance of such a device in terms of coherence of the emission due to interaction between condensed polaritons and uncondensed particles. Comparative linewidth measurements on 2D PoCos Askitopoulos et al. (2013) indicated already, that the separation of reservoirs carriers from the PoCo may improve the coherence properties.
PoCos in 2D cavity structuresDeng et al. (2007); Lai et al. (2007); Belykh et al. (2013) are affected not only by interaction with background carriers but undergo also considerable scattering among the polaritons. Such scattering is elastic in that the energy maintains in the polariton system. In 2D cavities the phase space of possible scattering events is rather large so that the bare effect of background carriers on the PoCo coherence is hard to assess. This is in particular the case when the coherence is studied underneath the laser spot only as in Refs. Deng et al., 2007; Lai et al., 2007; Belykh et al., 2013. Promising in this respect are photonic wire structures in which the one-dimensionality suppresses polariton scattering due to the reduced phase space accessible for quasi-elastic scattering. Propagation several away from the excitation laser spot has been demonstrated in these structures.Wertz et al. (2010)
In this report we present a spatially resolved study of the coherence properties of a laser-excited 1D PoCo. To that end, we use two complementary experimental techniques, namely a second order correlation measurementWiersig et al. (2009); Aßmann et al. (2010) as well as a Young’s double-slit experiment. Both approaches give evidence for a reduced coherence of the PoCo when background carriers are present. On the other hand, polaritons propagating out of the excitation spot maintain their coherence, so that with increasing separation coherence is established. We attribute this loss of coherence to interaction between background carriers and the PoCo. To our opinion two different effects contribute to the interaction: (i) The Coulomb-potential mediated by the background carriers and (ii) nonresonant scattering between background carriers and polaritons. However, a detailed evaluation of the exact contributions of these effects is beyond the scope of this report.
This manuscript is structured as follows: In Sec. II the investigated sample as well as the used experimental techniques are described. Here, special attention is attributed to the second order correlation measurements using a streak camera and the corresponding data analysis. This is followed by a presentation of our experimental results in Sec. III. Finally, a conclusion and an outlook for further experiments is given in Sec. IV.
II Experimental details
We investigate a GaAs-based -microcavity with an experimentally determined Q factor of about . The design of the sample is as follows: Three stacks of four GaAs quantum wells are placed in the three central antinodes of the electric field confined by two distributed Bragg reflector (DBR) structures in a /2-cavity. The quantum wells are in thickness and separated by thick barrier layers of AlAs. The upper (lower) DBR structure consists of 23 (27) alternating layers of Al0.2Ga0.8As and AlAs. The interaction of the cavity field with the exciton resonance of the 12 contained GaAs quantum wells leads to a Rabi splitting of about . Photonic wires are fabricated by lithography and etching. A wire with the following parameters is used: The exciton-cavity detuning .111For convenience the exciton-photon detuning is defined as difference in energy between the lowest confined, cavity subbranch and the uncoupled quantum well exciton. The wire length and the wire width .
The sample is mounted in a helium-flow cryostat, measurements are performed at . For non-resonant optical excitation a femtosecond-pulsed Titanium-Sapphire laser (repetition rate ) with central wavelength at () is used. The laser beam is focused under normal incidence onto the sample, the shape of the spot is Gaussian and about in diameter.
The emission from the sample is collected using a microscope objective (numerical aperture ); the far field emission is studied by imaging the Fourier plane of the objective onto the entrance slit of a monochromator. For detection a liquid nitrogen-cooled CCD-camera is used. For real-space imaging the photonic wire is magnified by a factor of and projected onto the entrance slit of a monochromator.
To study the spatial coherence of the PoCo along the wire we have performed Young’s double-slit experiment. Therefore, we magnify the emission from the sample by a factor 100 onto four different double slits. Thereby the spatial coherence between two small areas of diameter with distances of can be investigated. The interference fringes are recorded with the CCD camera behind the monochromator. Contrary to previous reports Deng et al. (2007); Lai et al. (2007); Wertz et al. (2010); Belykh et al. (2013), we have chosen the location of the slit center with respect to the excitation laser spot as an additional variable to investigate the spatial coherence. corresponds to the situation of the double slit placed symmetrically with respect to the excitation laser spot. From observed interference fringes the visibility within a spectral range of is calculated, which is used as measure for spatial coherence.
For the measurement of we have slightly modified the streak camera setup described in Ref. Aßmann et al., 2010. A drawback of the experimental approach presented there lies in photon reconstruction errors especially for short time delays of the built-in streak camera routine in the single photon counting mode. This prevents a direct determination of the -function for which can only be extrapolated from values of the -function for larger . Due to these photon reconstruction errors one can speak of a dark time in the order of . A similar problem occurs when measuring photon-statistics using avalanche photodiodes which exhibit a dark time in the order of . To circumvent this problem two avalanche photodiodes in conventional Hanbury-Brown-Twiss (HBT) setups are used. Similar as in a HBT setup, we can use our streak-camera actually as two detectors by the following approach:
We split the emission of the photonic wire into two different optical paths delayed by in time, thereby giving access to , where reflects the real time delay between the detection of two photons and the time delay due to the artificial time delay given by different optical path lengths. Therefore two 50:50 beamsplitters and a shortpass (SP) filter with cutting wavelength at are used (Fig. 1). The SP-filter provides transmission of the excitation laser as well as reflection of the investigated polariton-emission from the sample. Both emission patterns are magnified by a factor of 25 onto the entrance slit of a streak camera equipped with an additional horizontal deflection unit. The temporal resolution of the setup is approximately . Spectral sensitivity is provided by a bandpass filter with a Full Width at Half Maximum (FWHM) of .
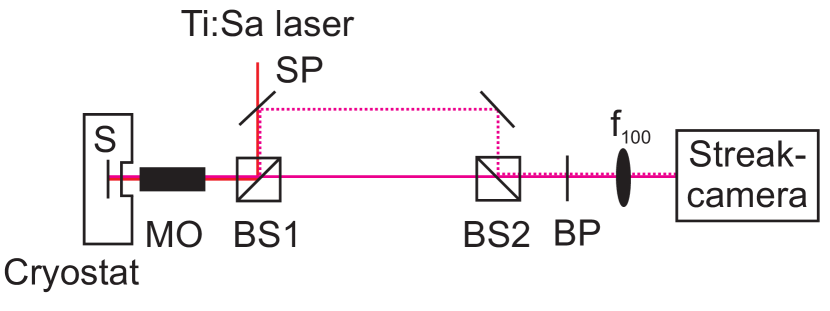
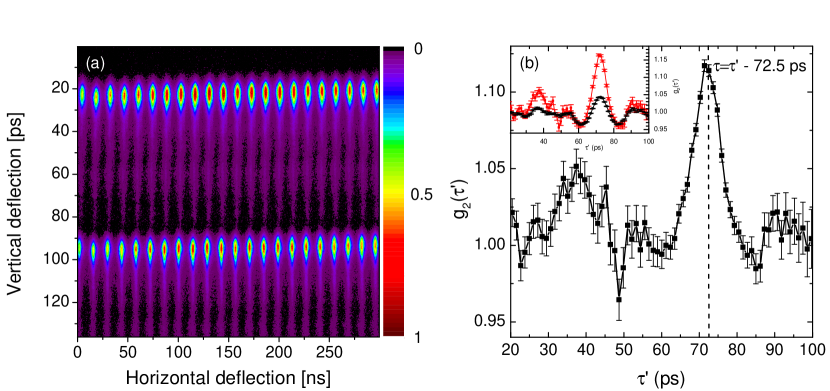
For the second order correlation measurement we select emission regions of width along the wire, using a vertical slit, and use a horizontal deflection time of per screen. For a reliable signal to noise ratio 100 000 frames are recorded, Fig. 2 (a) shows a typical integrated image over 100 000 frames. Every frame consists of 22 streaks and each streak corresponds to one single excitation pulse. Every photon within one frame is sorted into different streaks and second order correlation functions are calculated as described in Ref. Aßmann et al., 2010. A typical example for such a -function is shown by the red line in the inset of Fig. 2 (b). However, especially for short pulses the -function can be distorted by jitter-effects as described in Ref. Aßmann et al., 2010, which are indicated by -values significantly below . To account for these effects we average the -functions between several combinations of different streaks which is indicated by the black line in the inset of Fig. 2 (b). Since neighboring streaks are separated by in time, the shape of this curve does not reflect second order correlation of the emission from the sample, but jitter arising from our streak camera system. By dividing the -function of photons within the same streak by the average of the -functions of photons between different streaks we can separate jitter from second order correlation of the emission from the sample. Fig. 2 (b) gives a typical example of such a normalized -function. Here corresponds to due to the time delay between the two emission profiles. The additional peak for is probably caused by the tail of the pulse as it can be seen in Fig. 2 (a).
III Results and discussion
III.1 Real-space and Fourier-space spectroscopy
For identification of the different subbranches of the lower polariton Kuther et al. (1998) in the photonic wire and evaluation of the PoCo propagation we perform real-space and Fourier-space spectroscopy at different excitation powers.
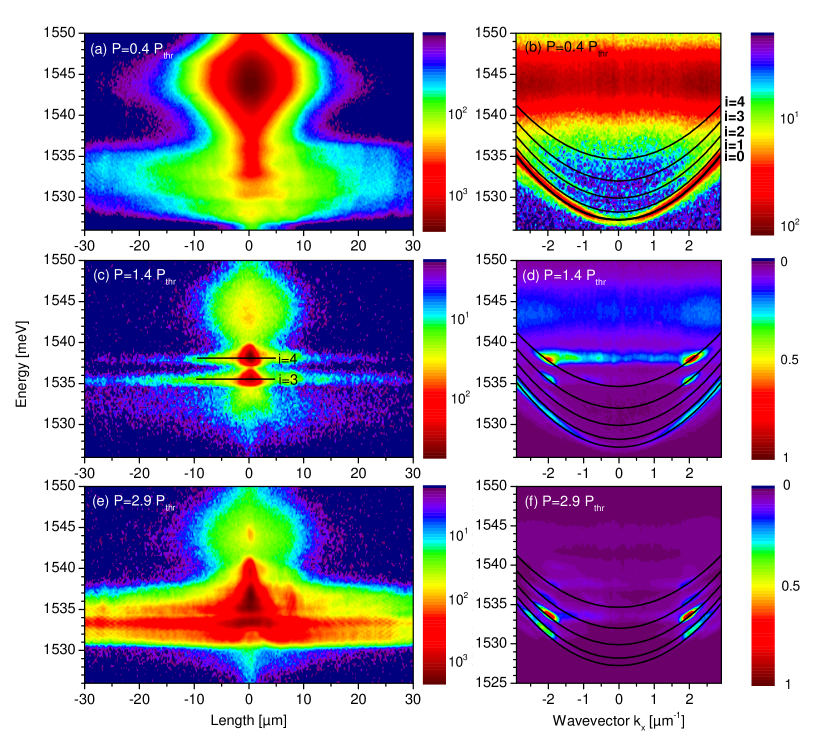
Figs. 3 (a) and (b) show the corresponding images for an excitation power below threshold. Here, the excitation laser spot is located in the center of the photonic wire. Several dispersion curves of LP subbranches can be distinguished in panel (b) and allocated to different photonic wire subbranches. The most intensive mode corresponds to the i=0-subbranch, also weak signatures of the i=2-, i=3- and i=4-subbranches are seen [Fig. 3 (b)]. The reason for the weak signals from higher subbranches is the orientation of the photonic wire parallel to the entrance slit of the monochromator, leading to detection within a small -space range . For this detection geometry the emission in Fourier-space is dominantly contributed by the ground mode, due to the symmetric, nodeless mode pattern perpendicular to the wire axis.Kuther et al. (1998); Lecomte et al. (2013) The strong emission centered at is attributed to the bare uncoupled quantum well exciton (QWE). This QWE photoluminescence is emitted mostly through the edge of the wire. In real-space the confined LP modes show up as several emission peaks below the QWE in the energy range of [Fig. 3 (a)]. Already below threshold, propagation of the LPs along the wire is observed [Fig. 3 (a)], which is extended compared to the exciton due to the light polariton mass.
At threshold significant changes of the emission patterns occur both in real- [Fig. 3 (c)] and in Fourier-space [Fig. 3 (d)] due to PoCo formation. The PoCo emission is most pronounced from the i=3- and i=4-subbranches with the main emission at wavevectors of . This can be attributed to conversion of potential energy mediated by background carriers within the excitation laser spot into kinetic energy, and to pair scattering effects.Wertz et al. (2010) When the excitation power is further increased, the main emission shifts to lower subbranches [Fig. 3 (e) and (f)] and the propagation along the photonic wire becomes much more pronounced. The emission in real-space broadens, so that a clear distinction especially between the i=0-, i=1- and i=2-LP subbranches in real-space is hardly possible, also because of the small energy splitting between them.
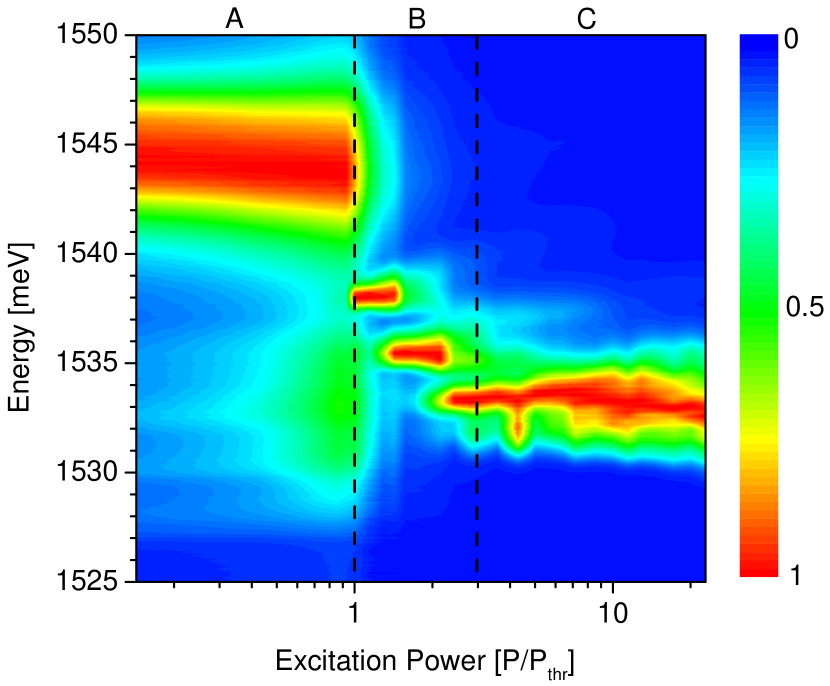

Fig. 4 summarizes the power dependent spectra for increasing excitation power, divided into three different regimes. Below threshold (regime A) the strongest emission comes from the QWE, for intermediate excitation powers in regime B the main emission is shifted from the i=4 LP subbranch to the LP i=0-, i=1- and i=2-subbranches, whereas for high excitation power clearly above threshold (regime C) the emission energy remains about constant. In addition we have performed cross-correlation measurements using a HBT setup in the excitation regime B between PoCos of different subbranches. For investigations in this regime near threshold the streak camera setup cannot be used due to the low duty cycle which is limited to 130 frames per second by the CCD camera.Aßmann et al. (2010) The temporal resolution of our HBT setup is in the order of . Fig. 5 shows a typical crosscorrelation measurement between two condensate modes at energies of and , respectively. Clearly, antibunching at is observed. This indicates mode competition between PoCos in different subbranches. A similar antibunching effect was observed in Ref. Kusudo et al., 2013 between two degenerate orbital states in a honeycomb lattice potential which was attributed to stochastic formation of different PoCos.
III.2 First-order spatial coherence
For spatially resolved investigation of the PoCo coherence properties we choose high excitation power levels within regime C, where pronounced propagation effects along the wire are observed.

In Fig. 6 the dependence of the visibility on the probed location of photonic wire is presented for an emission energy of at an excitation power . For far away from the center of the excitation laser spot, the visibility is more or less constant and shows the expected monotonous behavior as observed elsewhere Deng et al. (2007); Lai et al. (2007); Wertz et al. (2010): The visibility increases from roughly to when decreasing the slit separation from to . However, in the vicinity of the laser spot around a drastic decrease of the visibility becomes evident for slit separations of and . The FWHM in both cases is approximately which is in the order of the excitation laser spot size. For the cases of and , no pronounced minimum of visibility at is observed. Instead two pronounced minima located symmetrically relative to are seen. In addition the distance between the minima matches with the slit separation . Therefore, the observation of the minima corresponds to the situation where the spatial coherence between PoCos located at the excitation laser spot and PoCos located and , respectively, apart from the excitation spot is probed.
We tentatively assign the reduced spatial coherence around the laser spot to interaction between condensed polaritons and the thermalized reservoir of excitons localized around the excitation laser spot as suggested in Refs. Wertz et al., 2012; Wouters et al., 2010. Recently, there was a claim for observation of the detrimental effect of uncondensed polaritons on the spatial coherence.Spano et al. (2012) In this study a 2D PoCo was created under the optical parametric oscillation excitation scheme and the spatial coherence was compared between phase-matching condition and excitation energy slightly shifted out of phase-matching. In the latter case spatial coherence was found to be decreased which was attributed to the detrimental effect of uncondensed polaritons on the spatial coherence. However, the decrease of coherence in this report might also be explained as consequence of a lower density of the PoCo Manni et al. (2011) in the case of phase mismatch of the excitation laser. In our experiment we can rule out this explanation, as we observe similar polariton densities at the pump spot and apart in our real space spectra, whereas the visibility is at the pump spot and [Fig. 6 (a)].
III.3 Spatially resolved measurement of second-order time correlation
To substantiate our interpretation of the results of the double slit experiment we additionally measure the -function spatially resolved using the correlation streak-camera technique. To that end we place the excitation laser at the edge of the photonic wire and image the emission of the sample centered at onto the entrance slit of the streak camera. Under this condition condensate emission occurs at lower wavevectors compared to excitation in the wire center. Thus, the intensity of the strongest emission feature is redshifted compared to the power-dependent spectra shown in Fig. 4.
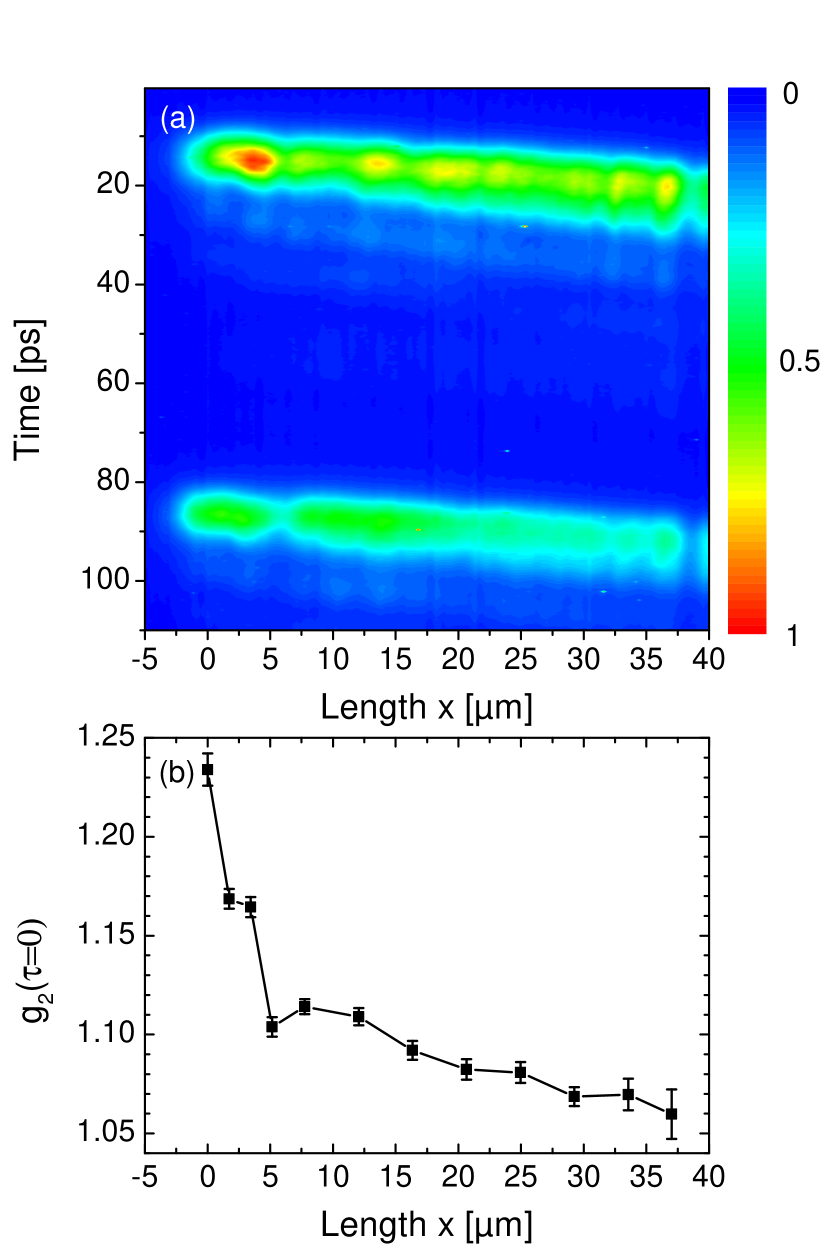
In Fig. 7 (a) the time-resolved spatial distribution of the PoCo is shown. Here, indicates the location of the excitation laser spot. Using a beamsplitter, we image the emission from the photonic wire twice on the entrance slit of the streak camera with a relative time delay of to avoid photon reconstruction errors for as outlined in Sec. II. From this image one can deduce a group velocity of in accordance with Ref. Wertz et al., 2012. Individual second order correlations are measured collecting signal from a region of the photonic wire with extension using a vertical slit. Subsequently this region is shifted along the wire. Fig. 7 (b) shows the result of these spatially resolved measurements of , the correlation function for simultaneous arrival of two photons.
We clearly see a bunching of photons emitted from the center of the excitation laser spot, reflected by values increased above unity, . decreases significantly within down to . Further on, a slight decrease down to for a distance of from the excitation laser spot is observed. Whereas reflects a Poissonian statistics and therefore a coherent photon source, increased values of indicate a deviation from such a distribution and hence a decreased coherence.
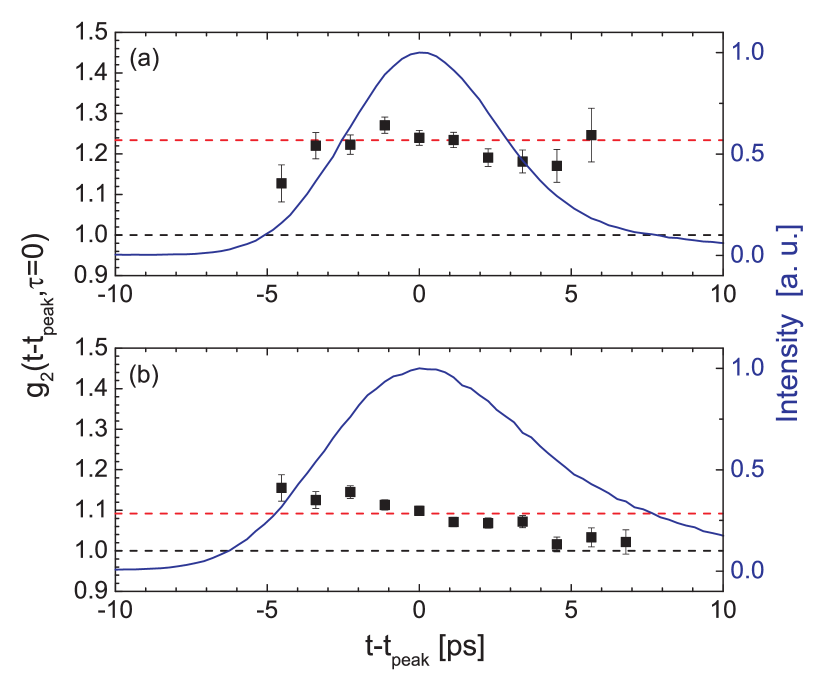
We have additionally analyzed the -function for different positions along the photonic wire (Fig. 8). At the location of the excitation laser spot we can see only small fluctuation around the mean value of within the emission pulse of the polariton condensate [Fig. 8 (a)]. Interestingly, far away from the excitation laser the situation is different [Fig. 8 (b)]: We observe a monotonous decrease of towards 1 within the pulse which demonstrates the recovery of a coherent light emission when no reservoir of background carriers is present. Therefore this experiment additionally corroborates our interpretation of a decreased coherence of the PoCo when background carriers are present.
We have also considered the possibility that the high -values observed at the pump spot can be interpreted in terms of simultaneously detected thermal photons. However, an analysis of the input-output curve at the location of the excitation laser spot revealed an ratio of roughly of thermal photons and of photons from the polariton condensate within the timewindow of roughly of the polariton condensate emission [Fig. 8 (a)]. Even for the very unlikely case that every detected pair consisting of a thermal/coherent photon would contribute with , the overall value for would be which is significantly lower as the average value within the emission pulse from the polariton condensate at the excitation laser spot [Fig. 8 (a)]. Therefore we can exclude that our results can be explained in terms of simultaneously measured thermal photons.
A similar decrease of second-order coherence induced by interaction with a reservoir was recently observed for a photon BEC.Schmitt et al. (2014) One of the key findings of this report is the observation of an increased particle number fluctuation for decreasing condensate fraction with respect to the reservoir (excited dye-molecules in this study) which is evidenced by an increase of up to values of for low condensate fractions. The high -values observed are attributed to the grand-canonical ensemble conditions of the experiment when the condensate fraction is low and the particle exchange between the reservoir and the condensate is very effective. To our opinion, a similar effect is seen in our experiment: As the reservoir is mainly located within the excitation laser spot we have a gradient of low condensate fractions within the laser spot to high condensate fractions several away from the excitation laser.
IV conclusion and outlook
In conclusion, we have demonstrated the detrimental effects of background carriers on the coherence properties of PoCos using Young’s double slit experiment and second order correlation measurement due to interaction between the reservoir and the PoCo. We have also presented a technique to determine second order correlation spatially resolved, which should also allow one to measure second order cross-correlations of PoCos in space. This could pave the way for the identification of event horizons exhibiting Hawking radiation.Solnyshkov et al. (2011); Gerace and Carusotto (2012)
V acknowledgments
The Dortmund group acknowledges support from the Deutsche Forschungsgemeinschaft (grants 1549/18-1 and 1549/19-1). We are grateful to Julian Fischer for initial sample characterization and measurements. Technical support in the fabrication of microwires by M. Emmerling and A. Wolf is acknowledged.
References
- Davis et al. (1995) K. B. Davis, M. O. Mewes, M. R. Andrews, N. J. van Druten, D. S. Durfee, D. M. Kurn, and W. Ketterle, Phys. Rev. Lett. 75, 3969 (1995).
- Anderson et al. (1995) M. H. Anderson, J. R. Ensher, M. R. Matthews, C. E. Wieman, and E. A. Cornell, Science 269, 198 (1995).
- Weisbuch et al. (1992) C. Weisbuch, M. Nishioka, A. Ishikawa, and Y. Arakawa, Phys. Rev. Lett. 69, 3314 (1992).
- Deng et al. (2002) H. Deng, G. Weihs, C. Santori, J. Bloch, and Y. Yamamoto, Science 298, 199 (2002).
- Kasprzak et al. (2006) J. Kasprzak, M. Richard, S. Kundermann, A. Baas, P. Jeambrun, J. M. J. Keeling, F. M. Marchetti, M. H. Szymanska, R. Andre, J. L. Staehli, V. Savona, P. B. Littlewood, B. Deveaud, and L. S. Dang, Nature 443, 409 (2006).
- Balili et al. (2007) R. Balili, V. Hartwell, D. Snoke, L. Pfeiffer, and K. West, Science 316, 1007 (2007).
- Christopoulos et al. (2007) S. Christopoulos, G. B. H. von Högersthal, A. J. D. Grundy, P. G. Lagoudakis, A. V. Kavokin, J. J. Baumberg, G. Christmann, R. Butté, E. Feltin, J.-F. Carlin, and N. Grandjean, Phys. Rev. Lett. 98, 126405 (2007).
- Franke et al. (2012) H. Franke, C. Sturm, R. Schmidt-Grund, G. Wagner, and M. Grundmann, New Journal of Physics 14, 013037 (2012).
- Bajoni et al. (2007) D. Bajoni, P. Senellart, A. Lemâitre, and J. Bloch, Phys. Rev. B 76, 201305 (2007).
- Sanvitto et al. (2010) D. Sanvitto, F. M. Marchetti, M. H. Szymanska, G. Tosi, M. Baudisch, F. P. Laussy, D. N. Krizhanovskii, M. S. Skolnick, L. Marrucci, A. Lemaitre, J. Bloch, C. Tejedor, and L. Viña, Nat Phys 6, 527 (2010).
- Aßmann et al. (2011) M. Aßmann, J.-S. Tempel, F. Veit, M. Bayer, A. Rahimi-Iman, A. Löffler, S. Höfling, S. Reitzenstein, L. Worschech, and A. Forchel, Proceedings of the National Academy of Sciences 108, 1804 (2011).
- Tempel et al. (2012) J.-S. Tempel, F. Veit, M. Aßmann, L. E. Kreilkamp, A. Rahimi-Iman, A. Löffler, S. Höfling, S. Reitzenstein, L. Worschech, A. Forchel, and M. Bayer, Phys. Rev. B 85, 075318 (2012).
- Schneider et al. (2013) C. Schneider, A. Rahimi-Iman, N. Y. Kim, J. Fischer, I. G. Savenko, M. Amthor, M. Lermer, A. Wolf, L. Worschech, V. D. Kulakovskii, I. A. Shelykh, M. Kamp, S. Reitzenstein, A. Forchel, Y. Yamamoto, and S. Höfling, Nature 497, 348 (2013).
- Imamoglu et al. (1996) A. Imamoglu, R. J. Ram, S. Pau, and Y. Yamamoto, Phys. Rev. A 53, 4250 (1996).
- Bhattacharya et al. (2013) P. Bhattacharya, B. Xiao, A. Das, S. Bhowmick, and J. Heo, Phys. Rev. Lett. 110, 206403 (2013).
- Askitopoulos et al. (2013) A. Askitopoulos, H. Ohadi, A. V. Kavokin, Z. Hatzopoulos, P. G. Savvidis, and P. G. Lagoudakis, Phys. Rev. B 88, 041308 (2013).
- Deng et al. (2007) H. Deng, G. S. Solomon, R. Hey, K. H. Ploog, and Y. Yamamoto, Phys. Rev. Lett. 99, 126403 (2007).
- Lai et al. (2007) C. W. Lai, N. Y. Kim, S. Utsunomiya, G. Roumpos, H. Deng, M. D. Fraser, T. Byrnes, P. Recher, N. Kumada, T. Fujisawa, and Y. Yamamoto, Nature 450, 529 (2007).
- Belykh et al. (2013) V. V. Belykh, N. N. Sibeldin, V. D. Kulakovskii, M. M. Glazov, M. A. Semina, C. Schneider, S. Höfling, M. Kamp, and A. Forchel, Phys. Rev. Lett. 110, 137402 (2013).
- Wertz et al. (2010) E. Wertz, L. Ferrier, D. D. Solnyshkov, R. Johne, D. Sanvitto, A. Lemaître, I. Sagnes, R. Grousson, A. V. Kavokin, P. Senellart, G. Malpuech, and J. Bloch, Nat Phys 6, 860 (2010).
- Wiersig et al. (2009) J. Wiersig, C. Gies, F. Jahnke, M. Aßmann, T. Berstermann, M. Bayer, C. Kistner, S. Reitzenstein, C. Schneider, S. Höfling, A. Forchel, C. Kruse, J. Kalden, and D. Hommel, Nature 460, 245 (2009).
- Aßmann et al. (2010) M. Aßmann, F. Veit, J.-S. Tempel, T. Berstermann, H. Stolz, M. van der Poel, J. M. Hvam, and M. Bayer, Opt. Express 18, 20229 (2010).
- Note (1) For convenience the exciton-photon detuning is defined as difference in energy between the lowest confined, cavity subbranch and the uncoupled quantum well exciton.
- Kuther et al. (1998) A. Kuther, M. Bayer, T. Gutbrod, A. Forchel, P. A. Knipp, T. L. Reinecke, and R. Werner, Phys. Rev. B 58, 15744 (1998).
- Lecomte et al. (2013) T. Lecomte, V. Ardizzone, M. Abbarchi, C. Diederichs, A. Miard, A. Lemaitre, I. Sagnes, P. Senellart, J. Bloch, C. Delalande, J. Tignon, and P. Roussignol, Phys. Rev. B 87, 155302 (2013).
- Kusudo et al. (2013) K. Kusudo, N. Y. Kim, A. Löffler, S. Höfling, A. Forchel, and Y. Yamamoto, Phys. Rev. B 87, 214503 (2013).
- Wertz et al. (2012) E. Wertz, A. Amo, D. D. Solnyshkov, L. Ferrier, T. C. H. Liew, D. Sanvitto, P. Senellart, I. Sagnes, A. Lemaître, A. V. Kavokin, G. Malpuech, and J. Bloch, Phys. Rev. Lett. 109, 216404 (2012).
- Wouters et al. (2010) M. Wouters, T. C. H. Liew, and V. Savona, Phys. Rev. B 82, 245315 (2010).
- Spano et al. (2012) R. Spano, J. Cuadra, G. Tosi, C. Antón, C. A. Lingg, D. Sanvitto, M. D. Martín, L. Viña, P. R. Eastham, M. van der Poel, and J. M. Hvam, New Journal of Physics 14, 075018 (2012).
- Manni et al. (2011) F. Manni, K. G. Lagoudakis, B. Pietka, L. Fontanesi, M. Wouters, V. Savona, R. André, and B. Deveaud-Plédran, Phys. Rev. Lett. 106, 176401 (2011).
- Schmitt et al. (2014) J. Schmitt, T. Damm, D. Dung, F. Vewinger, J. Klaers, and M. Weitz, Phys. Rev. Lett. 112, 030401 (2014).
- Solnyshkov et al. (2011) D. D. Solnyshkov, H. Flayac, and G. Malpuech, Phys. Rev. B 84, 233405 (2011).
- Gerace and Carusotto (2012) D. Gerace and I. Carusotto, Phys. Rev. B 86, 144505 (2012).