MERIDIONAL FLOW IN THE SOLAR CONVECTION ZONE. I.
MEASUREMENTS FROM GONG DATA
Abstract
Large-scale plasma flows in the Sun’s convection zone likely play a major role in solar dynamics on decadal timescales. In particular, quantifying meridional motions is a critical ingredient for understanding the solar cycle and the transport of magnetic flux. Because the signal of such features can be quite small in deep solar layers and be buried in systematics or noise, the true meridional velocity profile has remained elusive. We perform time-distance helioseismology measurements on several years worth of GONG Doppler data. A spherical harmonic decomposition technique is applied to a subset of acoustic modes to measure travel-time differences to try to obtain signatures of meridional flows throughout the solar convection zone. Center-to-limb systematics are taken into account in an intuitive, yet ad hoc manner. Travel-time differences near the surface that are consistent with a poleward flow in each hemisphere and are similar to previous work are measured. Additionally, measurements in deep layers near the base of the convection zone suggest a possible equatorward flow, as well as partial evidence of a sign change in the travel-time differences at mid-convection zone depths. This analysis on an independent data set using different measurement techniques strengthens recent conclusions that the convection zone may have multiple “cells” of meridional flow. The results may challenge the common understanding of one large conveyor belt operating in the solar convection zone. Further work with helioseismic inversions and a careful study of systematic effects are needed before firm conclusions of these large-scale flow structures can be made.
1 Introduction
Meridional circulation plays a critical role in models of solar dynamo, magnetic flux transport, and the solar cycle (Glatzmaier & Gilman, 1982; Wang et al., 1989, 1991; Choudhuri et al., 1995; Dikpati & Charbonneau, 1999; Wang et al., 2002; Nandy et al., 2011). It is well established observationally that meridional flow is poleward in each hemisphere with an amplitude of about in the near-surface layers, peaking in strength at mid latitudes (Duvall, 1979; Hathaway, 1996; Braun & Fan, 1998; González Hernández et al., 1999; Basu et al., 1999; González Hernández et al., 2006; Basu & Antia, 2010; Hathaway & Rightmire, 2010; Ulrich, 2010).
Since mass does not pile up at the poles, it is believed that a return equatorward flow in both hemispheres is operating somewhere in the convection zone, likely near its base. One of the most promising and complete attempts to measure this meridional circulation was during the graduate work of P. Giles (Giles et al., 1997; Giles, 2000). Using the SOHO spacecraft’s Michelson Doppler Imager (MDI) helioseismic data, Giles found that the poleward meridional flows continued throughout almost all of the convection zone and that there was indirect evidence of a return equatorward flow near the tachocline of a few . His methods and analysis imposed a constraint of mass conservation. Thus, the picture that emerged was of two closed circulating flows, one cell in each hemisphere, that diverge from the equator at the surface and converge toward the equator in the deep interior.
Since then, other helioseismology studies using a variety of techniques have offered many differing views. For example, Chou & Dai (2001); Beck et al. (2002); Chou & Ladenkov (2005) observe an additional “cell” of meridional circulation at mid latitudes near the location of the active sunspot latitudes, which is divergent and varies in time. Also, Zhao & Kosovichev (2004); González Hernández et al. (2010) found that such a cell has a convergent flow field (Cameron & Schüssler, 2010). Indeed, large-scale flow profiles (in both meridional and zonal directions) have been found to vary rather strongly with the solar cycle, and several studies have found that the amplitude of the flow is anti-correlated with the strength of the cycle (e.g., Komm et al., 1993; Chou & Dai, 2001; Haber et al., 2002; Basu & Antia, 2003; González Hernández et al., 2008; Gizon & Rempel, 2008). The latitudinal extent of the surface poleward flow has widely varied in the two previous cycles, and some helioseismic measurements indicate a high-latitude, reverse, equatorward surface component (Dikpati & Gilman, 2012). To add to the complexity, recent observations have shown an increasing polar flow magnitude as one probes deep into the convection zone (Kholikov et al., 2011), and Hathaway (2012) place the equatorward return flow at a depth of 70 Mm.
Recently Zhao et al. (2012b) observed a new systematic center-to-limb signal in time-distance measurements (Duvall et al., 1993), which may play a key role in obtaining reliable deep meridional flow measurements and be one of the sources of the discrepant results mentioned above. The approach of Zhao et al. (2012b) was to remove the systematic travel-time shifts found in the east-west measurements, after rotation is removed, from the meridional (north-south) measurements. This correction led to consistent helioseismic measurements using several different observables. While the source of this signal is not completely understood, it could be related to existing observational limitations like changes of the line formation heights across the solar disk, which produce additional acoustic travel-time shifts in cross-correlation measurements between different locations. Baldner & Schou (2012) showed that the effect of the vertical flows from convection in the outer solar convection zone can similarly affect travel-time measurements.
Subsequently, Zhao et al. (2013) applied their local techniques to measure two meridional circulation cells in the solar convection zone, while Schad et al. (2013) implemented a new global helioseismic analysis that resulted in evidence of a complex multicellular velocity structure. These new and exciting findings from space-based data present a potentially revised view of these important large-scale flows.
This paper is the first in a series where we explore meridional circulation using time-distance helioseismology applied to Global Oscillation Network Group (GONG) data. Here we describe in detail the travel-time measurement procedure we implement, which is non-standard and differs from the methods of Zhao et al. (2012a); Hartlep et al. (2013), for example. We use more than 600 daily sets of GONG velocity images to probe deep into the convection zone. In order to decrease possible geometric and observational artifacts we have selected dates with a duty cycle of more than 85% and time periods when the solar tilt angle . These strict requirements substantially decrease the amount of data that can be used. We assume that the center-to-limb systematic mentioned above is the same in any direction on the solar disk and we compute it only using the equatorial region of the observations. Travel-time differences are computed for north-south flows and corrected by subtracting the east-west signal. We find strong evidence of a change of sign in the travel-time differences at mid latitudes and depths of about 200 Mm beneath the surface, and compelling evidence that travel times may change sign (thus signaling a flow reversal) at shallower depths of about 50-60 Mm. In Section 2 we describe the data and analysis procedure, with results and discussion provided in Section 3.
2 Data and analysis technique
| Min. | Max. | Depth | |||
|---|---|---|---|---|---|
| Index | (deg) | (deg) | () | () | |
| 1 | 2.75 | 5.75 | 52.5 | 250 | 0.98 |
| 2 | 5.00 | 8.75 | 74.3 | 200 | 0.96 |
| 3 | 8.00 | 11.75 | 96.2 | 150 | 0.94 |
| 4 | 12.50 | 17.75 | 122.4 | 100 | 0.91 |
| 5 | 17.00 | 23.00 | 148.7 | 85 | 0.88 |
| 6 | 23.00 | 27.50 | 183.7 | 70 | 0.84 |
| 7 | 28.25 | 33.50 | 223.0 | 60 | 0.80 |
| 8 | 33.50 | 38.75 | 258.0 | 50 | 0.77 |
| 9 | 38.00 | 43.25 | 284.3 | 45 | 0.74 |
| 10 | 42.50 | 47.00 | 319.2 | 40 | 0.71 |
In this study we utilize GONG Doppler velocity images, and have selected 652 daily sets of observations with duty cycle higher than 85% during the 2004-2012 time period. The typical travel-time measurements are based on cross-correlation (CCF) analysis between two locations on the solar surface separated by certain distances [] (Duvall et al., 1993). It is well known that waves with the same phase speed form a wave packet and propagate along approximately the same ray path. In order to increase the signal-to-noise ratio of cross-correlation functions, phase velocity filters are used to isolate particular wave packets. To infer the meridional flow signal we measure wave travel times for waves propagating in opposite directions along the same ray path that lies between a pair of points (more precisely, a point and an arc) at constant longitude. In this case, the travel-time difference for waves propagating in the two opposite directions is sensitive only to the meridional (North-South) component of the flow (Kosovichev & Duvall, 1997). Below we itemize the main steps of the analysis and computation procedure:
-
1.
Daily velocity time series (1440 images/day) were tracked according to the surface Synodic differential rotation profile (Librecht & Morrow, 1991) relative to 12:00 (noon) and remapped into coordinates, where and are latitude and longitude, respectively.
-
2.
Spherical harmonic (SH) decomposition is performed for each image and SH coefficient time series are obtained for modes and , where is the SH degree and is the azimuthal order.
-
3.
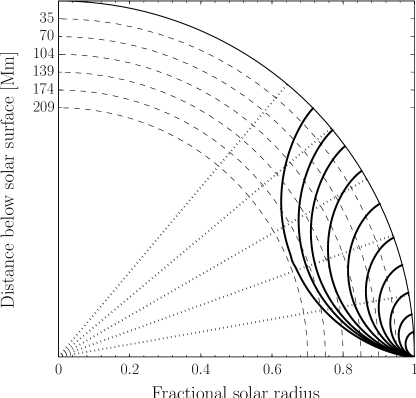
Ten different phase speed filters are employed and designed to cover the approximate depths of 0.98-0.70R☉. Details of their parameters are given in Table 1. Only modes within temporal frequencies between 1.8 and 4.5 mHz are retained. The approximate ray paths of the filtered wave packets considered here are illustrated in Fig. 1.
-
4.
Phase speed filters are applied to the time series for each of the 10 cases to yield .
-
5.
Velocity images are reconstructed from the using the inverse SH decomposition relation:
(1) Here, are the associated Legendre polynomials, denotes latitude, longitude, and . The fraction of the reconstructed solar disk was in latitude and in longitude relative to the center of the disk.
-
6.
The CCF between a point and the signal averaged over a 30 arc for a given longitude was computed as
(2) where is the filtered velocity time series, and is the angular distance between two spatial locations on the solar surface () and (). Arcs in the four cardinal directions are considered. For each filtered set of data the cross-correlations were computed for some range of travel distances with increments of around the maximum of the first bounce in the CCF. In total 72 correlation functions are computed for travel distances covering (see Table 1).
-
7.
The cross correlations were averaged over about 250 longitude bins in the range . Using smaller bands in longitude provides more proper center-to-limb corrections, but leads to a decrease in the signal-to-noise ratio of cross correlation measurements. Simple comparison using narrower bands showed significant increase of the variance of individual measurements. Since we are interested in travel time differences of about 1 s we decided to use a wider longitude range.
-
8.
Northward and southward travel times were obtained by fitting a Gabor wavelet function to both the positive and negative lags () of the cross correlations as
(3) where parameters , , , and are the amplitude, group and phase travel times, mean frequency, and width of wave packet, respectively.
-
9.
The difference between two oppositely directed travel times is computed for travel distances corresponding to each phase velocity filter. We use the convention of “south minus north” (SN) travel-time differences.
In addition, travel-time differences in the “east minus west” (EW) direction have also been computed using all of the exact steps of the data processing procedure outlined above. The travel times for these measurements were averaged over in latitude. A constant shift due to internal solar rotation is observed and removed for each travel distance measurement. These measurements are used to correct the systematics for the meridional observations.
3 Results and Discussion
(a) (b)
(a) (b)
(c) (d)
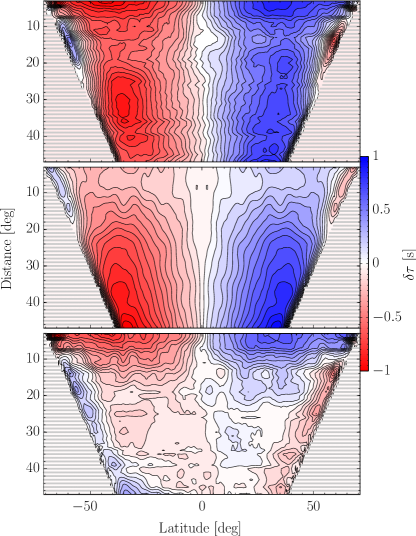
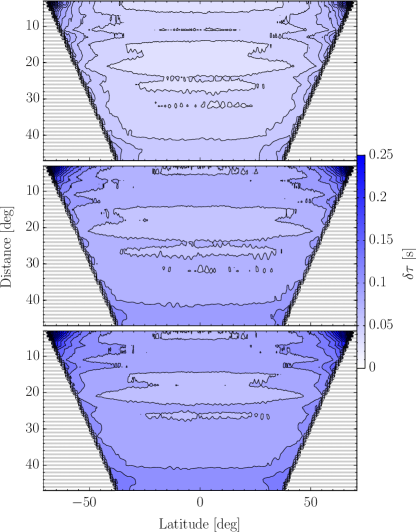
The top left panel of Fig. 2 shows an average over 652 days of SN travel-time differences presented as a function of latitude and travel distance. Each point at a given travel distance corresponds to the middle position between a point and an arc in our cross-correlation scheme. To avoid very high latitude information where the endpoints of the cross correlations lie, the measurements are cut off as a function of distance. The uncertainties are given in the second column, computed from the dispersion in individual measurements for each longitude and each day. These are typically a very small percentage of the averaged signal.
Signatures of poleward meridional flow in each hemisphere are clearly seen in Fig. 2(a). The color convention in this figure is such that blue is consistent with a flow toward the North Pole, and red a flow toward the South Pole. Indeed, in addition to a peak at mid latitudes as expected, an increase in the travel-time difference with depth (i.e., travel distance) is also observed. We expect this to be due to one or several systematics. To explore this further, EW travel times computed from the same dataset are shown in the middle panel of Fig. 2 as a function of longitude on the axis. The EW map has been symmetrized about the central meridian, as we expect there to be no significant differences between the two (east/west) hemispheres since the data have been tracked to account for differential rotation. These measurements show a similar pattern of center-to-limb variation as the SN map.
Zhao et al. (2012a) reported a very detailed analysis of travel-time measurements from different observables. Since they found that the shape and magnitude of center-to-limb variations is quite different for Doppler, continuum, line core and line depth of HMI measurements, one might conclude that these variations are not caused by any large-scale sub-surface flow of solar origin. Here we follow the same procedure and “correct” the SN measurements by subtraction of the EW measurements, the result shown in the bottom panel of Fig. 2(a). This correction removes the tendency of the travel times to increase with depth. Furthermore, some evidence of sign changes can be seen.
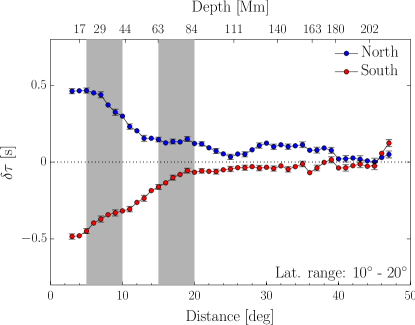
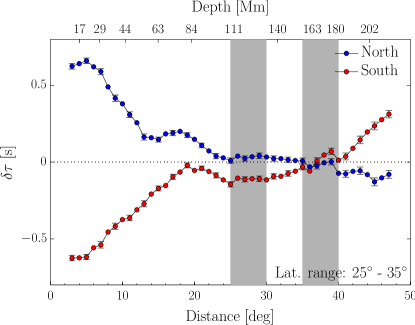
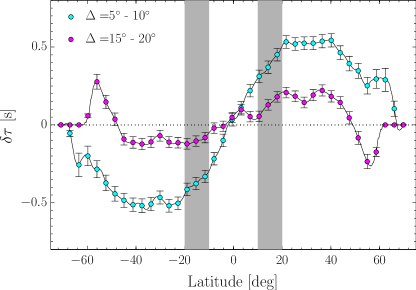
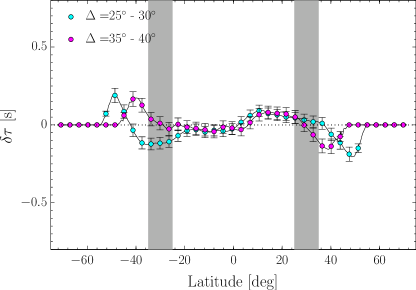
Figure 3 shows various cuts through the travel-time difference maps. Panels (a) and (c) are cuts at lower latitudes and shorter travel distances, while panels (b) and (d) are for mid latitudes and larger travel distances. These figures confirm that travel-time differences are strongest at mid latitudes around for a range of depths, as has been observed in past studies. This representation shows a clear yet peculiar asymmetry between the northern and southern hemispheres. Most importantly, we also observe evidence that a change in sign occurs in the measurements for two cases: (1) at high latitudes in each hemisphere for travel distances greater than about ; and (2) for large distances for most latitudes greater than about in each hemisphere.
Indeed, if large-scale flows are responsible for these signals, Figs. 3(a)-(b) show a tendency for the flow to approach a change of sign at skip distances of for a broad latitude range. At larger distances this signal then resurrects its poleward sense, eventually reversing again at the deepest probe depths. This very broadly suggests a multicellular structure as discussed in Zhao et al. (2012a) and Zhao et al. (2013), who found poleward flows down to , equatorward flows in the range, and then poleward again beneath that. Very recent work by Schad et al. (2013) reports yet another measurement of multicellular structure of the meridional flow using a different, global approach.
We caution that the change in sign at all distances at the maximal latitudes considered here (most evident in Fig. 2) could be due to a systematic caused by the solar variation, as demonstrated recently in Kholikov & Hill (2013). However, in the measurements here such an artifact is somewhat puzzling since we have restricted the data coverage to epochs when this angle is small. Another possible cause could simply be the use of the ad hoc correction method and any of its inherent systematics. Also evident in the measurements is a north-south hemispheric asymmetry from GONG and space-based data that has been noted in previous works (e.g., Zaatri et al., 2006; Rightmire-Upton et al., 2012).
The real origin of the center-to-limb variation across the solar disk is not well understood at present. The work of Baldner & Schou (2012) in explaining it is promising. Anomalous artifacts were even identified as early as Duvall & Hanasoge (2009), who consider effects due to the finite speed of light in meridional-flow measurements as causing an overall inflow towards the disk center. While only several seconds, the proper correction for this effect individually actually tends to add to the already unphysical increasing travel-time difference signal with depth as observed in the top panel of Fig. 2(a). Presumably this systematic is already accounted for in the east-west subtraction correction implemented here, although more confidence in such an approach is certainly needed and is the focus of current work.
Nevertheless, we find strong evidence of variations in depth of the large-scale flow in the solar convection zone. The deepest measurements where the ray path is horizontal and less sensitive to surface flows show strong evidence of a change of sign. The tendency for the travel-time shifts to approach zero at mid-convection zone depths is also intriguing, as one must recall that these measurements are integrated over depth and smoothed to some degree. Inversions may separate the two directional components of the flow and provide amplitudes and a more accurate depth structure.
We have shown robust travel-time measurements of the meridional flow signature in the solar convection zone using GONG data and independent measurement techniques. Preliminary evidence of a change of sign, indicating an equatorward return flow at one or several depths in the convection zone is observed, and is approximately consistent with results found in other recently published work. Overall the findings might suggest multicellular structure in the large-scale flows in the Sun. Only a consistent inversion procedure and a very careful treatment of the systematics can unravel the significance of these trends in the measurements. A forthcoming paper will show such inversions and discuss the implications for convection-zone dynamics.
References
- Baldner & Schou (2012) Baldner, C. S., & Schou, J. 2012, ApJ, 760, L1
- Basu & Antia (2003) Basu, S., & Antia, H. M. 2003, ApJ, 585, 553
- Basu & Antia (2010) Basu, S., & Antia, H. M. 2010, ApJ, 717, 488
- Basu et al. (1999) Basu, S., Antia, H. M., & Tripathy, S. C. 1999, ApJ, 512, 458
- Beck et al. (2002) Beck, J., Gizon, L., & Duvall T. Jr, 2002, ApJ, 575, L47
- Braun & Fan (1998) Braun, D. C., & Fan, Y. 1998, ApJ, 508, L105
- Cameron & Schüssler (2010) Cameron, R. H., & Schüssler, M. 2010, ApJ, 720, 1030
- Chou & Dai (2001) Chou, D.-Y., & Dai, D.-C. 2001, Astrophys. J. Lett., 559, L175
- Chou & Ladenkov (2005) Chou, D.-Y., & Ladenkov, O. 2005, ApJ, 630, 1206
- Choudhuri et al. (1995) Choudhuri, A. R., Schussler, M., & Dikpati, M. 1995, A&A, 303, L29
- Dikpati & Charbonneau (1999) Dikpati, M., & Charbonneau, P. 1999, ApJ, 518, 508
- Dikpati & Gilman (2012) Dikpati, M., & Gilman, P. A. 2012, ApJ, 746, 65
- Duvall (1979) Duvall, T. L, Jr., 1979, Sol. Phys., 63, 3
- Duvall & Hanasoge (2009) Duvall, Jr., T. L., & Hanasoge, S. M. 2009, in Astronomical Society of the Pacific Conference Series, Vol. 416, Solar-Stellar Dynamos as Revealed by Helio- and Asteroseismology: GONG 2008/SOHO 21, ed. M. Dikpati, T. Arentoft, I. González Hernández, C. Lindsey, & F. Hill, 103
- Duvall et al. (1993) Duvall, Jr., T. L., Jefferies, S. M., Harvey, J. W., & Pomerantz, M. A. 1993, Nature, 362, 430
- Giles (2000) Giles, P. M. 2000, PhD thesis, Stanford University
- Giles et al. (1997) Giles, P. M., Duvall, T. L., Scherrer, P. H., & Bogart, R. S. 1997, Nature, 390, 52
- Gizon & Rempel (2008) Gizon, L., & Rempel, M. 2008, Sol. Phys., 251, 241
- Glatzmaier & Gilman (1982) Glatzmaier, G. A., & Gilman, P. A. 1982, ApJ, 256, 316
- González Hernández et al. (2010) González Hernández, I., Howe, R., Komm, R., & Hill, F. 2010, ApJ, 713, L16
- González Hernández et al. (2008) González Hernández, I., Kholikov, S., Hill, F., Howe, R., & Komm, R. 2008, Sol. Phys., 252, 235
- González Hernández et al. (2006) González Hernández, I., Komm, R., Hill, F., Howe, R., Corbard, T., & Haber, D. A. 2006, ApJ, 638, 576
- González Hernández et al. (1999) González Hernández, I., Patrón, J., Bogart, R. S., & SOI Ring Diagram Team. 1999, ApJ, 510, L153
- Haber et al. (2002) Haber, D. A., Hindman, B. W., Toomre, J., Bogart, R. S., Larsen, R. M., & Hill, F. 2002, ApJ, 570, 855
- Hartlep et al. (2013) Hartlep, T., Zhao, J., Kosovichev, A. G., & Mansour, N. N. 2013, ApJ, 762, 132
- Hathaway (1996) Hathaway, D. H. 1996, ApJ, 460, 1027
- Hathaway (2012) Hathaway, D. H. 2012, ApJ, 749, L13
- Hathaway & Rightmire (2010) Hathaway, D. H., & Rightmire, L. 2010, Science, 327, 1350
- Kholikov & Hill (2013) Kholikov, S., & Hill, F. 2013, Sol. Phys., 289, 1077
- Kholikov et al. (2011) Kholikov, S., Leibacher, J., & Hill, F. 2011, in AAS/Solar Physics Division Abstracts #42, 1618
- Komm et al. (1993) Komm, R. W., Howard, R. F., & Harvey, J. W. 1993, Sol. Phys., 147, 207
- Kosovichev & Duvall (1997) Kosovichev, A. G., & Duvall, Jr., T. L. 1997, in ASSL 225: SCORe’96: Solar Convection and Oscillations and their Relationship, ed. F. P. Pijpers, J. Christensen-Dalsgaard, & C. S. Rosenthal, 241–260
- Nandy et al. (2011) Nandy, D., Muñoz-Jaramillo, A., & Martens, P. C. H. 2011, Nature, 471, 80
- Librecht & Morrow (1991) Librecht, K. G., & Morrow, C. A. 1991, Solar Interior and Atmosphere, Univ. Arizona Press, 479
- Rightmire-Upton et al. (2012) Rightmire-Upton, L., Hathaway, D. H., & Kosak, K. 2012, ApJ, 761, L14
- Schad et al. (2013) Schad, A., Timmer, J., & Roth, M. 2013, ApJ, 778, L38
- Ulrich (2010) Ulrich, R. K. 2010, ApJ, 725, 658
- Wang et al. (2002) Wang, Y.-M., Lean, J., & Sheeley, Jr., N. R. 2002, ApJ, 577, L53
- Wang et al. (1989) Wang, Y.-M., Nash, A. G., & Sheeley, Jr., N. R. 1989, Science, 245, 712
- Wang et al. (1991) Wang, Y.-M., Sheeley, Jr., N. R., & Nash, A. G. 1991, ApJ, 383, 431
- Zaatri et al. (2006) Zaatri, A., Komm, R., González Hernández, I., Howe, R., & Corbard, T. 2006, Sol. Phys., 236, 227
- Zhao et al. (2012a) Zhao, J. et al. 2012a, Sol. Phys., 275, 375
- Zhao & Kosovichev (2004) Zhao, J., & Kosovichev, A. G. 2004, Astrophys. J., 603, 776
- Zhao et al. (2012b) Zhao, J., Nagashima, K., Bogart, R. S., Kosovichev, A. G., & Duvall, Jr., T. L. 2012b, ApJ, 749, L5
- Zhao et al. (2013) Zhao, J., Bogart, R. S., Kosovichev, A. G., Duvall, Jr., T. L. , Hartlep, T. 2013, ApJ, 774, L29