Characterizing the Evolving X-Ray Spectral Features During a Superburst from 4U 1636–536
Abstract
Recent studies have shown that runaway thermonuclear burning of material accreted onto neutron stars, i.e. Type I X-ray bursts, may affect the accretion disk. We investigate this by performing a detailed time-resolved spectral analysis of the superburst from 4U 1636–536 observed in 2001 with the Rossi X-ray Timing Explorer. Superbursts are attributed to the thermonuclear burning of carbon, and are approximately times more energetic than the regular short Type I bursts. This allows us to study detailed spectra for over , compared to at most for regular bursts. A feature is present in the superburst spectra around that is well fit with an emission line and an absorption edge, suggestive of reflection of the superburst off the accretion disk. The line and edge parameters evolve over time: the edge energy decreases from at the peak to in the tail, and both features become weaker in the tail. This is only the second superburst for which this has been detected, and shows that this behavior is present even without strong radius expansion. Furthermore, we find the persistent flux to almost double during the superburst, and return to the pre-superburst level in the tail. The combination of reflection features and increased persistent emission indicates that the superburst had a strong impact on the inner accretion disk, and it emphasizes that X-ray bursts provide a unique probe of accretion physics.
Subject headings:
accretion, accretion disks — stars: neutron — stars: individual: 4U 1636-536 — X-rays: binaries — X-rays: bursts1. Introduction
Superbursts are energetic X-ray flares observed from accreting neutron stars in low-mass X-ray binaries (Cornelisse et al., 2000; Strohmayer & Brown, 2002). They are attributed to the runaway thermonuclear burning of carbon in the ashes layer of many short Type I X-ray bursts (e.g., Cumming & Bildsten, 2001; Cooper et al., 2009). Only 23 superbursts have been detected thus far (e.g., Keek et al., 2012; Negoro et al., 2012), some of which are only candidates, as the start of the burst is often not observed, which makes it difficult to constrain the flare’s parameters and confirm the thermonuclear origin. Most superburst observations have been performed with wide-field instruments with limited spectral resolution and collecting area. The highest quality data available is for two superburst observations with the Proportional Counter Array (PCA) on board the Rossi X-ray Timing Explorer (RXTE). One of these superbursts, from 4U 1820–30 (Strohmayer & Brown, 2002), was exceptionally powerful. It exhibits superexpansion during two phases of the superburst, and it has the longest period of moderate photospheric radius expansion (PRE) of any known X-ray burst (in ’t Zand & Weinberg, 2010; Keek, 2012). Detailed spectral analysis found the presence of reflection features in the spectrum (Ballantyne & Strohmayer, 2004), where part of the emission from the neutron star surface is thought to be reflected from the accretion disk. This allowed for the study of changes of the accretion disk properties during an X-ray burst, which may be interpreted as the disk receding and subsequently returning to its original configuration. Reflection features have also been detected from neutron stars outside of bursts (e.g., Bhattacharyya & Strohmayer, 2007; Cackett et al., 2008; Miller et al., 2013). Normal X-ray bursts last too short a time to collect enough photons to detect reflection features with current instrumentation (for constraints on the effect on the continuum for one of the brightest bursts, see in ’t Zand et al., 2013).
4U 1636–536 is a prolific burster, that exhibits a wide range of bursting behavior including both bursts with and without PRE (e.g., Hoffman et al., 1977; Galloway et al., 2008), burst oscillations (Strohmayer et al., 1998), short recurrence time bursts (Galloway et al., 2008; Keek et al., 2010), mHz QPOs (Revnivtsev et al., 2001; Altamirano et al., 2008), double- and triple-peaked bursts (van Paradijs et al., 1986; Bhattacharyya & Strohmayer, 2006; Zhang et al., 2009), and four superbursts (Wijnands, 2001; Strohmayer & Markwardt, 2002; Kuulkers, 2009). One superburst was observed with the PCA. Pulsations at the neutron star spin frequency were detected near the peak of the superburst (Strohmayer & Markwardt, 2002). Preliminary results of the spectral analysis show that its peak flux and its fluence are within the range that is typical for most known superbursts (Kuulkers et al., 2004; Kuulkers, 2004), such that it may be classified as a ‘typical’ superburst, whereas 4U 1820–30’s superburst is exceptional. The start of the superburst was observed, including a brief double-peaked precursor, although the data quality is insufficient to establish the presence of PRE (Keek, 2012).
The classical approach to the spectral analysis of X-ray bursts and superbursts is to assume that the spectrum produced by the accretion process persists throughout the burst, i.e. the ‘persistent’ spectrum is unchanged. This spectrum is determined from a time interval prior to the burst, which serves as the background during the burst. The remainder of the spectrum is assumed to originate exclusively from the neutron star surface, and is typically well-fit by a black body with interstellar absorption (Swank et al., 1977; Kuulkers et al., 2002a), although small deviations may be apparent in high quality spectra (e.g., van Paradijs & Lewin, 1986). A recent analysis of a large number of PRE bursts observed with the PCA, however, finds indications that the persistent spectrum is not constant, but has an increased normalization during the burst (Worpel et al., 2013; in ’t Zand et al., 2013). One explanation is Poynting-Robertson drag (e.g., Walker, 1992): the photons emitted by the neutron star surface transfer momentum to the disk, reducing its angular momentum, allowing for more material to fall in, which increases the flux generated by the accretion process. Furthermore, stacking large numbers of X-ray bursts reveals that the high energy () flux is significantly reduced during bursts, which is suggested to indicate the cooling of a corona (Maccarone & Coppi, 2003; Chen et al., 2012, 2013; Ji et al., 2014).
In this paper we present the detailed spectral analysis of the superburst observed with the PCA from 4U 1636–536. This superburst’s behavior is a better representation of the typical superburst than 4U 1820–30, and we investigate whether reflection features are present even for less powerful bursts. Furthermore, we investigate changes in the persistent flux during the superburst.
2. Observations
On 2/22/2001 a superburst was observed from 4U 1636-536 with all instruments on RXTE (Bradt et al., 1993). This space-based X-ray observatory was launched in December 1995, and operated until January 2012. Its instrumentation consists of the PCA (Jahoda et al., 2006), the High Energy X-ray Timing Experiment (HEXTE; Rothschild et al., 1998), and the All-Sky Monitor (ASM; Levine et al., 1996). The PCA consists of five proportional counter units (PCUs), that are sensitive to X-ray photons in the 2 to 60 keV range, and have a combined collecting area of . During an observation only a subset of these five may be active. The combination of its energy band and large collecting area make the PCA the optimal instrument to study the superburst. The ASM, although its energy band overlaps, has a substantially smaller effective area. ASM data is, therefore, not included in this study.
HEXTE consists of two clusters of Phoswich detectors with a band-pass of 15 to 250 keV and an effective area of per cluster. During an observation the clusters alternately point on and off source, such that the source is always observed by one cluster, while the other measures the high-energy background. The HEXTE light curve of this superburst has been previously presented by Kuulkers et al. (2010). We will briefly mention how the HEXTE spectral data compares to PCA data, but our analysis will focus on the latter. We extract HEXTE spectra from Standard 2 data for each cluster, separating the on-source and off-source pointings. We check that no bright X-ray source was present in the field of view at the off-source positions. Using the tool hxtdead, we correct for ‘dead time’: the reduction of the exposure by the time that the on-board electronics takes to process a detected event. During the analysis, the off-source spectrum is subtracted as a background from the on-source spectrum.
Due to an overflow of the on-board data buffer some data products were lost, most notably the high time resolution PCA data at the superburst onset (Strohmayer & Markwardt, 2002). Throughout the entire superburst Standard 1 and 2 data products are available. The former has a time resolution of , but no spectral information, whereas the latter has a time resolution of and energy channels. From the Standard 1 light curve we find that, apart from the very start of the superburst, the Standard 2 time resolution is sufficient for our purposes.
The superburst observation lasted subsequent RXTE orbits (Obs IDs 50030-02-08-01 and 50030-02-08-02), and is interrupted by data gaps due to Earth occultations. For time-resolved spectroscopy during the first orbits we choose a time resolution of , which increases the statistics of the spectra over the maximal resolution of , while still providing sufficient sampling of the changes in the spectral parameters with time (see also Strohmayer & Brown, 2002). In the last orbits the count rate per PCU is lower by over a factor compared to the peak. We increase the time resolution to to obtain spectra with similar statistics. This resolution is still sufficient to follow the changes with time, because in this part of the superburst tail the decay of the light curve has slowed down.
We extract spectra from data in the to energy range, which is well calibrated, whereas at higher energies the instrument background dominates, and uncertainties in the background modeling may be substantial (Jahoda et al., 2006). Different combinations of PCUs were active during the different orbits. We use PCUs 0, 2, and 3, which were on during all four orbits. Using the procedure recommended by the instrument team,111http://heasarc.gsfc.nasa.gov/docs/xte/recipes/pcadeadtime.html we correct for dead time. Furthermore, we group neighboring channels if the number of counts of a channel is less than , ensuring that statistics are applicable.
We use the tool pcabackest to model the instrument background, which is based on blank-sky observations and takes into account a possible particle background from prior passage through the South Atlantic Anomaly. We generate one background spectrum per orbit. The background is, however, expected to change somewhat during an orbit (Jahoda et al., 2006). In tests where we generate a background for each or time interval, the results of our analysis did not change significantly, because the orbital variability is strongest , which is outside the considered energy range. We give preference to the single background spectrum per orbit, because the background model uses the anti-coincident signals, and its relative error is reduced when a longer time interval is used.
Spectral analysis is performed with XSPEC version 12.8.1 (Arnaud, 1996). A systematic uncertainty is added in quadrature to the errors in the data points of the spectra, to take into account uncertainties in the response (Jahoda et al., 2006). The reported uncertainties are at .
At the start of the observation, the spacecraft was slewing. We only consider data from the time when the final pointing was reached. This is of no consequence to our analysis, because the source appeared to have a constant photon flux during and directly after the slew. We define the time at MJD .
Finally, near the peak of the superburst, oscillations have been detected with an amplitude of at the neutron star’s spin frequency of (Strohmayer & Markwardt, 2002). This suggests an inhomogeneity in the heating of the star’s surface. Because we integrate spectra over much longer time intervals than the spin period, and because of the small amplitude, we do not expect the oscillations to significantly alter the spectral shape.
3. Results
First we follow the classical approach to X-ray burst and superburst spectroscopy by subtracting a persistent spectrum and fitting the net spectrum with an absorbed black body. Next we attempt to improve the spectral fits by investigating a changing persistent spectrum as well as emission and absorption features.
3.1. Persistent emission: fit to pre-superburst orbit
We investigate the persistent flux in the orbit immediately prior to the superburst observation. In this orbit the count rate is comparable to that at the end of the superburst tail. We extract a spectrum using data from the entire orbit. First we fit a cut-off power law model that depends on energy, , as with normalization , photon index , and a high-energy exponential cutoff at (model cutoffpl in XSPEC). We include photoelectric absorption using the vphabs model and fix its parameters, including the hydrogen column , to the mean of the best fit values of Pandel et al. (2008) (Table 1; abundances relative to Wilms et al. 2000; cross sections from Balucinska-Church & McCammon 1992). The best fit has for the goodness of fit per degree of freedom .
Including a black body component at lower energies does not substantially improve the fit, nor does allowing to vary. Including a (smeared) absorption edge gives with an apparent feature in the fit residuals around . Including instead a Gaussian emission line with centroid energy , width , and normalization yields without strong features in the residuals. When is allowed to vary in the latter model with a Gaussian, we find and a vanishingly small value for that is consistent with within its uncertainty. Therefore, we choose vphabs(cutoffpl+gaussian) with fixed to the mean value from Pandel et al. (2008) as our fiducial model for the persistent spectrum (Table 1). This model is consistent with the best fit model found in other, broad-band studies (Pandel et al., 2008; Lyu et al., 2014, see Section 4.1). With this model we determine the unabsorbed flux of the cut-off power law component both in the to energy band, , and extrapolated to the to band, , as a measure of the bolometric flux (Table 1). The Gaussian line has an equivalent width of .
Simultaneous fits of the PCA and HEXTE data give results consistent with PCA-only fits. The HEXTE spectra confirm the cut-off power law continues in the energy range . At higher energies the number of counts is rather low and the background dominates the spectrum; no significant deviation from the cut-off power law is observed at these energies.
Using the same model we also analyze the spectrum of the orbit that starts hours after the superburst onset. The flux is close to higher than the pre-superburst flux.
3.2. Classic superburst spectral fits
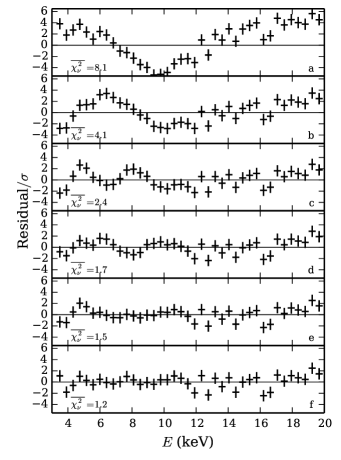
Extracting spectra every in the first two and in the last two orbits, we follow the common approach of deriving the net superburst spectra by subtracting the pre-superburst persistent spectrum. To this we fit a black body with temperature and normalization , with radius of the emitting area in km and distance in units of kpc (XSPEC model bbodyrad), and we take into account interstellar absorption as described in the previous section. The best fit has an average of in the first orbit where the data quality is highest. There is a strong feature in the fit residuals around , and the high-energy tail has a higher flux compared to the best fit black body (Figure 1a).
3.3. Variable persistent flux and features in the first orbit
To investigate improvements to the spectral fits, we start by considering the first orbit, where the count rate and data quality are highest. We no longer subtract the persistent spectrum. Instead, we subtract a modeled instrumental background, and include in the fits the persistent spectral model (Table 1) in addition to a black body. The parameters of the persistent model, a cut-off power law, are fixed to the pre-superburst best-fit values, with the exception of (similar to the approach by Worpel et al., 2013). Also, we leave out the Gaussian emission line from the persistent model, as it is undetectable in the short time intervals during the burst. The best fit improves: , and the excess at high energies is reduced. The feature around , however, remains (Figure 1b). Allowing more parameters of the cut-off power law to vary during the fit further improves , but competition between the power law and the black body components leads to large uncertainties in the fit parameters. We, therefore, choose to keep all cut-off power law parameters fixed except .
Inspired by previous studies (Strohmayer & Brown, 2002; Ballantyne & Strohmayer, 2004), we investigate the feature’s interpretation as a reflection line and/or an absorption edge. We employ as additional model components a gaussian and an edge. Note that we consider this Gaussian to be different from the one in the pre-superburst spectrum, and scale it independently from the cut-off power law. When the parameters of these components are left unconstrained, the line and edge may ‘drift’ away from the location of the feature and compete with the two continuum components. We, therefore, restrict certain parameters to a physically motivated range: the Gaussian line’s energy to and width , and the edge energy to . Note that if we allow the Gaussian’s width to vary freely, it will fit to the continuum instead of the feature. Because of the limited spectral resolution, the precise value of is of little consequence to the best-fit values of the other parameters. Furthermore, we analyze spectra in chronological order, and use the best fit values of the previous interval as starting values for the fit of the next interval, such that we can follow changes over time even when the significance of these features is reduced in the superburst tail.
Including either the Gaussian line (Figure 1c) or the edge (Figure 1d) improves the fit: and , respectively. Features remain, however, in the residuals. Adding both components reduces these features and further improves the fit: (Figure 1e).
The most pronounced remaining issue in the residuals is at the lowest energies . Allowing of the absorber to vary, removes this: . There are no more significant features visible in the residuals (Figure 1f). The measured distribution of the values of all time bins in the first orbit is consistent with the theoretical distribution for perfect fits.
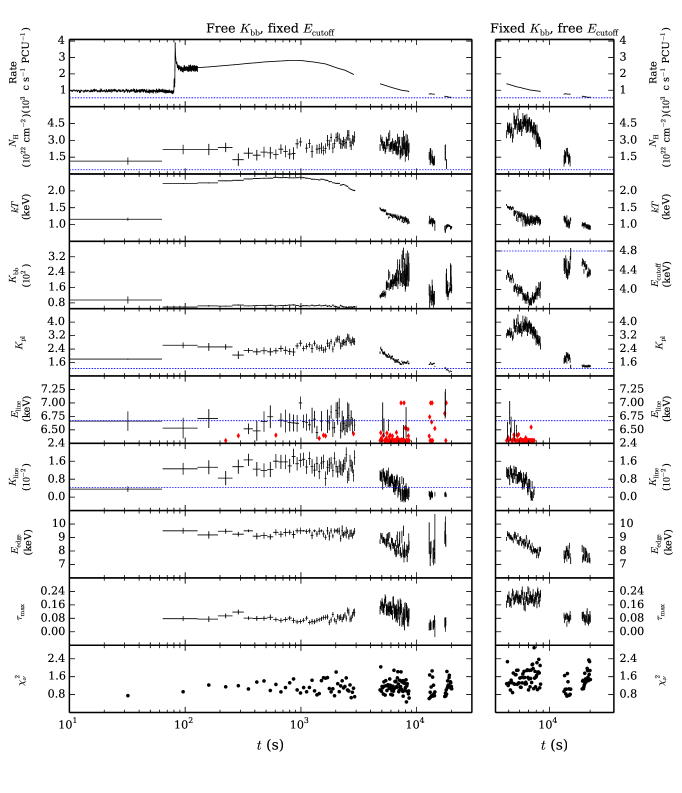
In conclusion, the spectra in the first orbit are well described by the combination of an absorbed black body and cut-off power law, where the shape of the cut-off power law is fixed to the pre-superburst persistent values, whereas its normalization is left free. In addition, a Gaussian, an absorption edge, and increased values of describe spectral features at lower energies. We apply this model (vphabs*edge(cutoffpl+bbodyrad+gaussian) in XSPEC) to all spectra from the entire superburst (Figure 2 left).
Comparing from the pre-superburst spectrum to the weighted mean from the first superburst orbit, the latter is larger by a factor . Given that the spectra during the superburst have fewer counts than the pre-superburst spectrum, this justifies our choice to include only one (dominant) Gaussian line in our model.
The first of our data shows a plateau of enhanced flux (Figure 2 top left), which we include in our fits. Attempting a fit with only an absorbed cut-off power law, similar to the pre-superburst fits, leaves an excess at low energies that is not well-fit by a gaussian line (with ), but that is well-described by a black body.
3.4. Evolution of the spectrum in the second orbit
Applying the best fit model for the first orbit to the second orbit, we find an increase in the black-body normalization (Figure 2 left), implying a mean radius expansion by a factor . PRE usually occurs at the peak of energetic bursts, not in the tail. Our model, therefore, most likely does not correctly describe the physical behavior of the system (see Section 4.4 for alternative explanations).
We take the mean value of the black-body normalization from the first orbit, , and for fits to the subsequent orbits fix it to this number. This does not provide a good fit, which suggests that the shape of the cut-off power law component changes from the pre-superburst value. Indeed, allowing to vary produces reasonable fits: on average in the second orbit. When we allow to vary instead, similar improvements to the fits are obtained. One would like to further improve the fits to optimize . Allowing one extra parameter from the black-body or power-law model components to vary indeed produces values that follow the ideal distribution. As mentioned previously, competition between these two components causes large uncertainties in the fit parameters. We, therefore, can use only a limited number of free parameters to fit the continuum, and we cannot simultaneously constrain both the black body normalization and the power law shape.
During the superburst decay, is substantially lower than measured in the pre-superburst orbit. At a minimum is reached of (determined from the weighted mean of bins around the maximum; Figure 2 right). This is preceded at by a maximum in .
If we apply the same fit to the first orbit, has a somewhat larger value than pre-superburst. The uncertainty in each data point, however, is relatively large, because around the superburst peak the spectrum is dominated by the black body. Therefore, the fit here is not strongly dependent on the precise value of . We continue to use the best fit model from Section 3.3 in orbit 1, and we employ the model with fixed and free in the subsequent orbits.
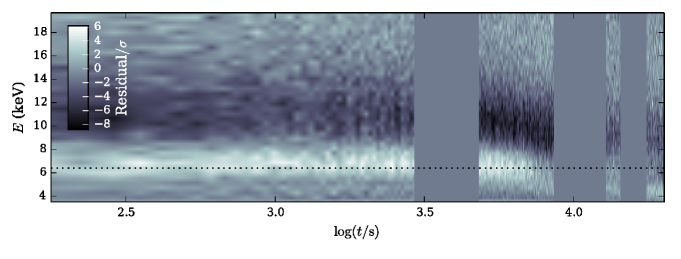
The uncertainty in the line and edge parameters for each data point is rather large. is not well-constrained in most of the time bins of the second orbits, although is constrained, because we restricted to an energy range that lies within the broad spectral feature around . To illustrate the clear presence of this feature, its shift in energy, and its reduction in amplitude over time, we plot the fit residuals as a function of time (Figure 3). For this, we use the two best fit models for the first and subsequent orbits, respectively, without the edge and line components.
3.5. Return to pre-superburst values in the third and fourth orbits
The line is not detected and the edge is detected at lower significance in the final two orbits of the superburst observation, even though we integrate our spectra over . is reduced in orbit compared to orbits and . In the last orbit it is no longer constrained by the data, similar to the fits of the pre-superburst data (Section 3.1). Furthermore, the cut-off power law parameters approach the persistent values.
3.6. Black-body and power-law flux
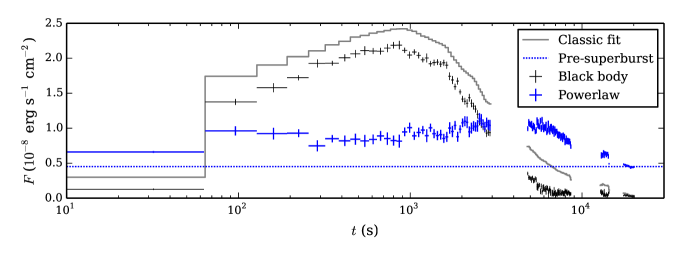
The classic fit yields a bolometric unabsorbed black body fluence that is larger than the one from our “optimal” fits (Section 3.4) by a factor . For the data gaps we perform linear interpolation, using the mean of three data points on each side of the gaps. Without interpolation, the factor is .
In the first orbit, the in-band flux is dominated by the black body, whereas the power law dominates at later times (Figure 4). Furthermore, only in the first orbit, around the count rate peak, is the peak of the black body distribution of counts within the observed energy range. In the subsequent orbits the peak is at an energy that is lower than the considered energies, and only the tail is visible. The peak of the black body energy distribution is always well within the considered energy range, such that we capture most of the black body energy flux.
We obtain high values of for the neutral absorption component of our spectral model. This suggests that a substantial part of the black-body flux is absorbed. In the to band the weighted mean of the fraction of the black-body flux that is absorbed is , , and in orbits , , and , respectively. The neutral absorber is, however, constrained by only a few spectral bins at low energy. Detailed spectral modeling of both an ionized absorber and the reflection features may provide a better motivated description of this part of the spectrum.
4. Discussion
We have presented the results of our time resolved spectral analysis of the RXTE PCA spectrum of the 2001 superburst from 4U 1636-536. We find features in the spectra of both the superburst and pre-superburst emission that are suggestive of reflection off the accretion disk. Furthermore, the persistent flux more than doubles during the superburst, and returns to the pre-superburst value in the tail.
4.1. Components of the persistent spectrum
We have analyzed the spectrum of the persistent flux in the orbit directly prior to the superburst and in an orbit after the superburst (Table 1). The flux in the latter orbit is larger, which may be due to the tail of the superburst, but variations in the persistent flux of this magnitude are common in 4U 1636–536 on the timescale of the RXTE orbit. Both spectra are well described by an absorbed cut-off power law in combination with a Gaussian emission line. This is consistent with previous analyses of higher resolution spectra from observations with XMM-Newton and Suzaku (Pandel et al., 2008; Lyu et al., 2014). These spectra extend to lower energies (), and discern two extra thermal components, which are attributed to the inner accretion disk and the neutron star surface. The latter possibly includes a contribution from a boundary layer, depending on where the accreted material dissipates its angular momentum as it approaches the neutron star surface. The thermal components have temperatures , such that their contribution to the flux in the PCA band is negligible (Pandel et al., 2008; Lyu et al., 2014). The cut-off power law component is thought to be produced by Compton scattering off hot electrons in a corona. Irradiation of the inner accretion disk by the corona and the neutron star surface may produce a reflection spectrum, which includes an emission line (e.g., Miller, 2007). Our spectral model, therefore, qualitatively agrees with the previous studies, and is quantitatively similar, keeping in mind the time variability of the persistent flux (e.g., Pandel et al., 2008). Lyu et al. (2014) identify correlations between the different spectral components as a function of the hardness of the source, but it may not be correct to directly compare these to the behavior that we observe during the superburst, as the processes that set the state of the disk are different.
During the superburst the neutron star surface heats up, and its thermal emission dominates the PCA spectrum at lower energies. The cut-off power-law flux in the PCA band approximately doubles. If the black-body flux from the inner accretion disk and the boundary layer also double, then the black-body temperatures increase by only , or even less if the emitting area grows as well. The contribution of these two thermal components to the flux in the PCA band is, therefore, expected to remain small compared to the main black body component during the superburst.
4.2. Reflection features
Flux reflected off the accretion disk can produce a reflection spectrum that includes a relativistically broadened fluorescent Fe K emission line as well as a blend of absorption edges (for a review see, e.g., Miller, 2007). Indeed, an emission line close to is detected from 4U 1636–536 (Pandel et al., 2008; Lyu et al., 2014). We also find this feature in the pre-superburst spectrum, although the edge is not detected, because the feature is rather weak. Because outside of the burst the cut-off power law dominates the flux, this line may be interpreted as reflection of the flux from the corona. The line has a large width, which may in part be explained by a blending of Fe lines from different ionization states (Pandel et al., 2008).
During the superburst we need both an emission line and an absorption edge to obtain satisfactory fits. A similar requirement was found for the 1999 superburst from 4U 1820–30 (Strohmayer & Brown, 2002), and these features were found to be well described by reflection of the neutron star surface emission off the accretion disk (Ballantyne & Strohmayer, 2004). The line as observed during the superburst is much stronger than if it were to be produced by reflection of the brightened cut-off power law, and is therefore predominantly powered by reflected burst emission from the neutron star surface. Note that local spectral features have been detected with the PCA in bright X-ray bursts that were not well-fit with a reflection model, but are better described by absorption edges thought to originate with heavy element ashes mixed into the neutron star photosphere (in ’t Zand & Weinberg, 2010). Therefore, despite the limited spectral resolution of the PCA, it is possible to distinguish reflection features from absorption features in the neutron star photosphere.
Comparing the line and edge parameters in the first RXTE satellite orbit of the superbursts from 4U 1820–30 and 4U 1636–536, in both cases the line and edge energies decrease somewhat during the burst, and so do the line normalization and the edge depth (Strohmayer & Brown, 2002, this paper). For 4U 1820–30 it was argued that the receded inner disk returns in the tail to smaller radii, increasing the gravitational red shift (Ballantyne & Strohmayer, 2004). Also, for that superburst the reflection features are somewhat stronger, which is consistent with the reflection of emission from a brighter superburst.
In a future study we will further investigate these spectral features using detailed reflection spectra, similar to the study by Ballantyne & Strohmayer (2004).
4.3. Superburst increases persistent emission
in the first RXTE orbit is on average larger than measured before the superburst by a factor (the factor in Worpel et al., 2013), and the cut-off power-law flux increases with this factor as well. In the superburst tail, the cut-off power-law flux smoothly returns to the pre-superburst value. Worpel et al. (2013) infer much larger increases for a selection of PRE bursts observed with the PCA, including from 4U 1636–536 (see also in ’t Zand et al., 2013). This may be because the superburst is less bright, as it does not reach the Eddington limit.
The increase in the cut-off power-law flux has been suggested to result from an increase in accretion due to Poynting-Robertson drag (e.g., Walker, 1992) induced by the burst emission from the neutron star surface (Worpel et al., 2013). Alternatively, the enhanced cut-off power-law could be the result of an increase in seed photons for the Comptonization process (in ’t Zand et al., 2013). These seed photons would be produced by the reprocessing in the accretion disk of the burst emission. The reflection features may trace the irradiation of the disk and, therefore, the reprocessed flux. The increase in the normalization is, however, much larger for the Gaussian line than for the cut-off power law. This may be due to a difference in the efficiency for reflection and reprocessing. Detailed modeling of the reflection spectrum can provide further insight.
Recent X-ray burst atmosphere spectral models provide a better physical description of the neutron star photosphere, and they predict a hard comptonized tail in addition to the black body (Suleimanov et al., 2011b). This tail, however, is substantially weaker than the cut-off power law component in our model. In fact, in the presence of variable persistent emission, such as what we find in the superburst, fits with the atmosphere model are problematic (Suleimanov et al., 2011a). We have tested the use of the atmosphere model as a substitute for the black-body component, and we find that does not improve. The increase in the cut-off power law is also too strong to be explained by rotational Doppler broadening.
It is interesting that no variable persistent component was required to describe the spectra of the 1999 superburst from 4U 1820–30, for which similar data products are available as for the superburst studied in this paper (Strohmayer & Brown, 2002; Ballantyne & Strohmayer, 2004). That superburst was exceptionally bright and it reached the Eddington limit (Strohmayer & Brown, 2002; in ’t Zand & Weinberg, 2010; Keek, 2012). If the enhanced cut-off power-law flux is due to Poynting-Robertson drag induced accretion, the effect is expected to be stronger for 4U 1820–30 than for 4U 1636–536. Perhaps the Eddington limited flux from the neutron star during superexpansion as well as the long period of moderate radius expansion prevent an increase in the accretion rate (e.g., Ballantyne & Everett, 2005). Both the occurrence of superexpansion, during which the flux drops below the pre-superburst level, and of variability in the tail (achromatic in the PCA-band; see Kuulkers, 2004; in ’t Zand et al., 2011) may be indications of mass outflow during the 4U 1820–30 superburst. The 4U 1636–536 superburst lacks both features.
4.4. Black-body emitting area and the power law cut-off
The PCA spectra constrain only a limited number of parameters, and we must make assumptions about the rest. The assumption of a fixed shape of the cut-off power law produces in the second RXTE orbit fits where increases by as much as a factor (Figure 2). is proportional to the black-body emitting area, and the increase implies radius expansion, which is not expected to take place in the decay phase of the superburst light curve. Also, the count rate does not exhibit a dip, which is characteristic for PRE (Grindlay et al., 1980; Tawara et al., 1984; Lewin et al., 1984). Furthermore, PRE is typically observed for bursts from 4U 1636–536 with peak black-body fluxes in excess of (in the PCA band; Galloway et al., 2008), whereas the superburst does not reach that flux (Figure 4).
Similar increases in have been measured in the tails of a number of PRE bursts from 4U 1636–536, and are suggested to originate from the deviation of the neutron star’s photospheric spectrum from a black body (Güver et al., 2012; Zhang et al., 2013, both studies assume the persistent flux is constant). Suleimanov et al. (2011b) predict correction factors to that span a range of approximately a factor as a function of flux. As the superburst peak does not reach the Eddington limit, however, only a smaller range of a factor is applicable. This can only explain a small part of the increase in . Alternatively, variations in between bursts have been attributed to different covering factors of the neutron star by the disk, depending on its ionization state or on the geometry of the disk and boundary layer (e.g., Suleimanov et al., 2011a). So-called anisotropy factors of up to have been predicted (Fujimoto, 1988), which falls short of the increase that we observe.
We measure the black-body normalization in the first RXTE orbit as . At a distance of (e.g., Galloway et al., 2008), this corresponds to a black-body radius of (not taking into account the uncertainty in the distance). The values of measured for short non-PRE bursts from 4U 1636–536 that are observed with the PCA span a broad range, and the superburst value is at the lower end of the distribution (Galloway et al., 2008, assuming a constant persistent flux). In our analysis with a fixed persistent flux, was larger compared to fits with a free normalization of the persistent flux. The increased values of the normalization that we obtain in fits where we keep fixed, span the range of of the short bursts. As shown by Worpel et al. (2013) for the case of PRE bursts, short X-ray bursts as well have an enhanced persistent flux. The assumption of a constant flux leads, therefore, to the over-prediction of the black body flux, which may be expressed by an increased normalization.
We, therefore, regard it as unlikely that the increased black-body emitting area is physical. The limited data quality does not allow us to simultaneously constrain more parameters of the spectral components. We choose to fix for the final three RXTE orbits, and allow the shape of the cut-off power law to change through . The values, however, suggest that the fits are not optimal and the changes to the shape of the spectrum require additional parameters. Nevertheless, the trends in the parameter values appear to evolve smoothly between the first RXTE orbit and the subsequent orbits.
is substantially reduced with respect to the pre-superburst value, and reaches a minimum around , coinciding with a maximum in . This may correspond to a viscous timescale on which the accretion disk responds to the effects of the superburst. After this time, increases towards the pre-superburst value. A similar change in the high energy tail of the spectrum has been noted for short bursts, where the decrease of the count rate above has been linked to the cooling of the corona in response to the burst (e.g., Ji et al., 2014).
4.5. Strong local absorber
We find a strong enhancement of the photoelectric absorption to improve the fits: is larger by an order of magnitude during the superburst compared to the persistent emission. The absorption component is typically used to describe interstellar absorption, but this enhancement indicates the majority of the absorption during the superburst is local to the binary. A local ionized absorber may provide a more physically motivated spectral model. Furthermore, is only constrained by a few spectral bins at low energy. One must, therefore, use caution in interpreting our fit values for this parameter.
A similar increase in was observed for the 1999 superburst from 4U 1820–30 (Ballantyne & Strohmayer, 2004). For that superburst it was speculated that the absorption was produced by material ejected from the neutron star atmosphere during the PRE phase. 4U 1636–536’s superburst, however, does not exhibit PRE. Alternatively, the absorbing material may originate from a disk wind driven by the superburst emission from the neutron star.
4.6. Flux enhancement prior to the superburst
At the start of the first RXTE orbit of the superburst, a plateau is visible where the flux is larger by a factor than in the previous orbit. The spectrum of the plateau is not well-fit by the persistent model (Section 3.1). A broad excess remains at lower energies, which is well described by a black body with an effective area that is consistent with the value measured near the superburst peak (Figure 2). This suggests that the neutron star surface has heated up prior to the superburst. This is puzzling, because the precursor burst at is thought to be instigated by a shock within a second after the thermonuclear runaway (Weinberg & Bildsten, 2007; Keek & Heger, 2011). Perhaps it is related to an event that escaped detection because of the prior data gap. In two cases a short Type I burst has been observed within minutes of the superburst onset, and at both times the flux remained at a somewhat higher value until the superburst rise (Kuulkers et al., 2002b; Chenevez et al., 2011). Because of the small number of occurrences it is, however, not excluded that these short bursts merely happened by chance, and are unrelated to the superburst ignition.
4.7. Comparison of analyses and superbursts
Our results from the classical fit with a fixed persistent flux are consistent with the preliminary analysis reported by Kuulkers et al. (2004) as well as the analysis of the ASM data of the superburst (Wijnands, 2001). Our “optimal” spectral model with variable persistent flux yields substantial contributions to the flux from both the black body and the cut-off power law. We use the black-body flux to measure the emission from the neutron star surface due to thermonuclear burning. For the reasons explained in Section 4.1, we do not expect a large contribution from a boundary layer to the black body, especially near the superburst peak. The enhancement of the cut-off power law suggests that it is powered by the star’s surface emission. This, however, must be black-body radiation that was not in our direct line of sight, and that is accounted for if we use only the black body and assume isotropic emission (see also Kuulkers et al. 2002a for a discussion on decoupling burst and persistent flux).
| Spectral model: | Classical a | Optimal b |
|---|---|---|
| c | ||
| Fluence |
a Section 3.2. Note: uncertainties in parameters do not include a correction for the high in this fit.
b Section 3.4
c The parameters are for the black body in the
to range at the time of maximal flux, :
unabsorbed flux , ; temperature, ;
normalization, . The to
unabsorbed black-body fluence includes linear interpolation over the
data gaps.
Using the optimal spectral model gives different results for some superburst properties compared to the classical fit (Table 2). The peak times are consistent: is different by only one time bin of the spectra. The peak black-body temperature differs by . The peak flux is lower in our optimal model, because a smaller part of the flux is attributed to the black-body component. This, combined with the higher temperature, leads to a lower black-body normalization. The largest difference is, therefore, apparent in the measured black-body normalization.
Comparison of the classical fit to other superbursts, characterizes this superburst as “typical” (e.g., Kuulkers, 2004; Keek & in ’t Zand, 2008). The increase of the persistent flux and its effect on the derived burst properties, may play a role in other superbursts as well, although usually the data is of insufficient quality to determine this. If the superburst fluence is smaller than previously derived, the inferred energy content of the fuel is lower. Using our values of the fluence (Table 2), this means that the amount of carbon or of heavy rp-process ashes (targets for photodisintegration; Schatz et al., 2003) in the neutron star ocean is lower by (Cumming & Bildsten, 2001; Cumming et al., 2006). As it has been challenging to explain the production of enough carbon to power superbursts (e.g., Woosley et al., 2004), this reduction alleviates the problem, although it does not completely solve it. In a forthcoming paper we will investigate the consequences using numerical models of the nuclear burning in the neutron star envelope.
5. Conclusions
Detailed time resolved spectral analysis of the 2001 superburst from 4U 1636-536 reveals an emission line and absorption edge suggestive of reflection of the superburst off the accretion disk. This is only the second superburst for which this has been observed, and shows that typical non-PRE superbursts also are powerful enough to produce these features. Furthermore, we find an increase in the persistent flux during the burst. We observe the shape of the non-thermal component of the spectrum to change under influence of the superburst, and return to the pre-superburst state in the burst tail. The increase in the persistent flux may suggest that previous measurements overestimate the energetics of superbursts. This has consequences for the inference of the composition of the neutron star ocean that is the fuel for superbursts. In forthcoming papers we will discuss how this changes our understanding of nuclear burning in the envelope, and we will employ detailed models to study the reflection spectrum.
References
- Altamirano et al. (2008) Altamirano, D., van der Klis, M., Wijnands, R., & Cumming, A. 2008, ApJ, 673, L35
- Arnaud (1996) Arnaud, K. A. 1996, in ASP Conf. Ser. 101: Astronomical Data Analysis Software and Systems V, ed. G. H. Jacoby & J. Barnes, 17
- Ballantyne & Everett (2005) Ballantyne, D. R., & Everett, J. E. 2005, ApJ, 626, 364
- Ballantyne & Strohmayer (2004) Ballantyne, D. R., & Strohmayer, T. E. 2004, ApJ, 602, L105
- Balucinska-Church & McCammon (1992) Balucinska-Church, M., & McCammon, D. 1992, ApJ, 400, 699
- Bhattacharyya & Strohmayer (2006) Bhattacharyya, S., & Strohmayer, T. E. 2006, ApJ, 636, L121
- Bhattacharyya & Strohmayer (2007) —. 2007, ApJ, 664, L103
- Bradt et al. (1993) Bradt, H. V., Rothschild, R. E., & Swank, J. H. 1993, A&AS, 97, 355
- Cackett et al. (2008) Cackett, E. M., Miller, J. M., Bhattacharyya, S., et al. 2008, ApJ, 674, 415
- Chen et al. (2013) Chen, Y.-P., Zhang, S., Zhang, S.-N., et al. 2013, ApJ, 777, L9
- Chen et al. (2012) Chen, Y.-P., Zhang, S., Zhang, S.-N., Li, J., & Wang, J.-M. 2012, ApJ, 752, L34
- Chenevez et al. (2011) Chenevez, J., Brandt, S., Kuulkers, E., et al. 2011, The Astronomer’s Telegram, 3183, 1
- Cooper et al. (2009) Cooper, R. L., Steiner, A. W., & Brown, E. F. 2009, ApJ, 702, 660
- Cornelisse et al. (2000) Cornelisse, R., Heise, J., Kuulkers, E., Verbunt, F., & in ’t Zand, J. J. M. 2000, A&A, 357, L21
- Cumming & Bildsten (2001) Cumming, A., & Bildsten, L. 2001, ApJ, 559, L127
- Cumming et al. (2006) Cumming, A., Macbeth, J., in ’t Zand, J. J. M., & Page, D. 2006, ApJ, 646, 429
- Fujimoto (1988) Fujimoto, M. Y. 1988, ApJ, 324, 995
- Galloway et al. (2008) Galloway, D. K., Muno, M. P., Hartman, J. M., Psaltis, D., & Chakrabarty, D. 2008, ApJS, 179, 360
- Grindlay et al. (1980) Grindlay, J. E., Marshall, H. L., Hertz, P., et al. 1980, ApJ, 240, L121
- Güver et al. (2012) Güver, T., Psaltis, D., & Özel, F. 2012, ApJ, 747, 76
- Hoffman et al. (1977) Hoffman, J. A., Lewin, W. H. G., & Doty, J. 1977, ApJ, 217, L23
- in ’t Zand et al. (2011) in ’t Zand, J. J. M., Galloway, D. K., & Ballantyne, D. R. 2011, A&A, 525, A111
- in ’t Zand & Weinberg (2010) in ’t Zand, J. J. M., & Weinberg, N. N. 2010, A&A, 520, A81
- in ’t Zand et al. (2013) in ’t Zand, J. J. M., Galloway, D. K., Marshall, H. L., et al. 2013, A&A, 553, A83
- Jahoda et al. (2006) Jahoda, K., Markwardt, C. B., Radeva, Y., et al. 2006, ApJS, 163, 401
- Ji et al. (2014) Ji, L., Zhang, S., Chen, Y., et al. 2014, ApJ, 782, 40
- Keek (2012) Keek, L. 2012, ApJ, 756, 130
- Keek et al. (2010) Keek, L., Galloway, D. K., in ’t Zand, J. J. M., & Heger, A. 2010, ApJ, 718, 292
- Keek & Heger (2011) Keek, L., & Heger, A. 2011, ApJ, 743, 189
- Keek et al. (2012) Keek, L., Heger, A., & in’t Zand, J. J. M. 2012, ApJ, 752, 150
- Keek & in ’t Zand (2008) Keek, L., & in ’t Zand, J. J. M. 2008, in Proceedings of the 7th INTEGRAL Workshop. 8 - 11 September 2008 Copenhagen, Denmark. Online at http://pos.sissa.it/cgi-bin/reader/conf.cgi?confid=67, p.32
- Kuulkers (2004) Kuulkers, E. 2004, Nucl. Phys. Proc. Suppl., 132, 466
- Kuulkers (2009) Kuulkers, E. 2009, The Astronomer’s Telegram, 2140, 1
- Kuulkers et al. (2002a) Kuulkers, E., Homan, J., van der Klis, M., Lewin, W. H. G., & Méndez, M. 2002a, A&A, 382, 947
- Kuulkers et al. (2004) Kuulkers, E., in ’t Zand, J., Homan, J., et al. 2004, in AIP Conf. Proc. 714: X-ray Timing 2003: Rossi and Beyond, 257–260
- Kuulkers et al. (2002b) Kuulkers, E., in ’t Zand, J. J. M., van Kerkwijk, M. H., et al. 2002b, A&A, 382, 503
- Kuulkers et al. (2010) Kuulkers, E., in ’t Zand, J. J. M., Atteia, J., et al. 2010, A&A, 514, A65+
- Levine et al. (1996) Levine, A. M., Bradt, H., Cui, W., et al. 1996, ApJ, 469, L33+
- Lewin et al. (1984) Lewin, W. H. G., Vacca, W. D., & Basinska, E. M. 1984, ApJ, 277, L57
- Lyu et al. (2014) Lyu, M., Mendez, M., Sanna, A., et al. 2014, ArXiv e-prints, arXiv:1402.2350
- Maccarone & Coppi (2003) Maccarone, T. J., & Coppi, P. S. 2003, A&A, 399, 1151
- Miller (2007) Miller, J. M. 2007, ARA&A, 45, 441
- Miller et al. (2013) Miller, J. M., Parker, M. L., Fuerst, F., et al. 2013, ApJ, 779, L2
- Negoro et al. (2012) Negoro, H., Asada, M., Serino, M., et al. 2012, The Astronomer’s Telegram, 4622, 1
- Pandel et al. (2008) Pandel, D., Kaaret, P., & Corbel, S. 2008, ApJ, 688, 1288
- Revnivtsev et al. (2001) Revnivtsev, M., Churazov, E., Gilfanov, M., & Sunyaev, R. 2001, A&A, 372, 138
- Rothschild et al. (1998) Rothschild, R. E., Blanco, P. R., Gruber, D. E., et al. 1998, ApJ, 496, 538
- Schatz et al. (2003) Schatz, H., Bildsten, L., & Cumming, A. 2003, ApJ, 583, L87
- Strohmayer & Brown (2002) Strohmayer, T. E., & Brown, E. F. 2002, ApJ, 566, 1045
- Strohmayer & Markwardt (2002) Strohmayer, T. E., & Markwardt, C. B. 2002, ApJ, 577, 337
- Strohmayer et al. (1998) Strohmayer, T. E., Zhang, W., Swank, J. H., White, N. E., & Lapidus, I. 1998, ApJ, 498, L135+
- Suleimanov et al. (2011a) Suleimanov, V., Poutanen, J., Revnivtsev, M., & Werner, K. 2011a, ApJ, 742, 122
- Suleimanov et al. (2011b) Suleimanov, V., Poutanen, J., & Werner, K. 2011b, A&A, 527, A139+
- Swank et al. (1977) Swank, J. H., Becker, R. H., Boldt, E. A., et al. 1977, ApJ, 212, L73
- Tawara et al. (1984) Tawara, Y., Kii, T., Hayakawa, S., et al. 1984, ApJ, 276, L41
- van Paradijs & Lewin (1986) van Paradijs, J., & Lewin, H. G. 1986, A&A, 157, L10
- van Paradijs et al. (1986) van Paradijs, J., Sztajno, M., Lewin, W. H. G., et al. 1986, MNRAS, 221, 617
- Walker (1992) Walker, M. A. 1992, ApJ, 385, 642
- Weinberg & Bildsten (2007) Weinberg, N. N., & Bildsten, L. 2007, ApJ, 670, 1291
- Wijnands (2001) Wijnands, R. 2001, ApJ, 554, L59
- Wilms et al. (2000) Wilms, J., Allen, A., & McCray, R. 2000, ApJ, 542, 914
- Woosley et al. (2004) Woosley, S. E., Heger, A., Cumming, A., et al. 2004, ApJS, 151, 75
- Worpel et al. (2013) Worpel, H., Galloway, D. K., & Price, D. J. 2013, ArXiv e-prints, arXiv:1303.4824
- Zhang et al. (2009) Zhang, G., Méndez, M., Altamirano, D., Belloni, T. M., & Homan, J. 2009, MNRAS, 398, 368
- Zhang et al. (2013) Zhang, G., Méndez, M., Belloni, T. M., & Homan, J. 2013, MNRAS, 436, 2276