R. Bachev, A. Strigachev, E. Semkov, S. Boeva, S. Peneva, S. Ibryamov, K. Stoyanov, B. Spassov, S. Tsvetkova, B. Mihov, G. Latev, D. Dimitrov 11institutetext: Institute of Astronomy and NAO, Bulgarian Academy of Sciences, BG-1784 Sofia 11email: bachevr@astro.bas.bg \papertypeSubmitted on 10.10.2013; Accepted on 26.10.2013.
Photometric reverberation mapping
of Markarian 279
Abstract
By using standard broad-band VRI photometry we were able to discriminate the variations of the broad hydrogen alpha line from the continuum variations for the active galaxy Mkn 279. Cross-correlating both light curves enabled us to determine the time lag of the broad line variations behind the continuum and thus to determine the BLR size (about 8 light days). Our preliminary results are rather consistent with the spectroscopic reverberation mapping results (about 12/17 days). This study is a part of an ambitious program to perform photometric reverberation mapping and determine BLR sizes (respectively – the central black hole masses) for more that 100 nearby AGN.
keywords:
galaxcies: AGN – photometry1. Introduction
Almost the only way to measure directly the super-massive black hole (SMBH) in the centers of active galactic nuclei (AGN) is through a technique, called reverberation mapping (a review by Peterson & Horne, 2004). This technique is based on the geometrical path difference between the ionizing continuum and the broad line clouds, where the broad emission presumably originates, thus leading to a certain time delay between the continuum and the line variations. Measuring this delay provides an accurate estimate of the linear distance to the broad line region (BLR). Thus, knowing the width of the lines (Keplerian motion of the BLR clouds is assumed) and the distance, one can calculate the mass inside the BLR, which is significantly dominated by the SMBH.
Although very promising, reverberation mapping technique has been applied so far for only about 50 AGN (Bentz et al. 2010). The main obstacle here is that the spectroscopic monitoring (neede to measure the emission line fluxes) requires typically a 2-m class telescope. A number of reasons like restricted telescope time, etc., make projects like this difficult to organize and perform, especially what concerns the need of a dense monitoring. Fortunately, very recently it has been developed a modification to this technique, called photometric reverberation mapping (Haas et al., 2011; Chelouche & Daniel, 2012) which requires much smaller telescopes. The idea behind this novel approach is to use narrow-band filters, cleverly centered on the emission lines and the ambient continuum, instead of performing spectroscopic monitoring. Since the line response time is much longer than the continuum response time, one can successfully use the nearby optical continuum bands for a proxy for the central UV/X-ray changes. For the brightest objects, photometric reverberation mapping can successfully be performed with as small as 15-cm telescope (Haas et al., 2011).
Recently, photometric reverberation mapping has been applied to a number of objects (Edri et al., 2012; Pozo Nuñez et al., 2012; Pozo Nuñez et al., 2013; Carroll ., 2013) with results very close to the spectroscopic ones.
In this work we report preliminary results of the photometric reverberation mapping technique applied to Seyfert 1 AGN Markarian 279.
2. Observations
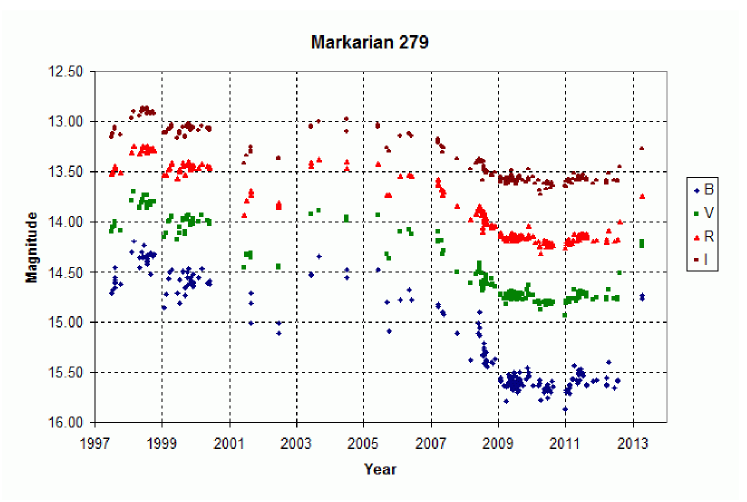
We monitor photometrically on a regular basis Mkn 279 for the last 15 years using the 60-cm telescope of Belogradchik Observatory; 200-cm, 50/70-cm, and 60-cm telescopes of Rozhen National Observatory (Bulgaria); as well as 130-cm Skinakas telescope (Greece). All telescopes are equipped with CCD and filter sets. Initially the object was in a rather bright state (years 1998 – 2007), but later faded significantly and remained in a low state during the years 2008 – 2012. light curves of Mkn 279 are shown in Fig. 1. A total of about 240 photometric points with typical photometric errors between 0.01 (VRI bands) and 0.03 (-band) were collected during the entire observational period. A portion of these data was published in a previous study (Bachev & Strigachev, 2004).
3. Photometric reverberation mapping
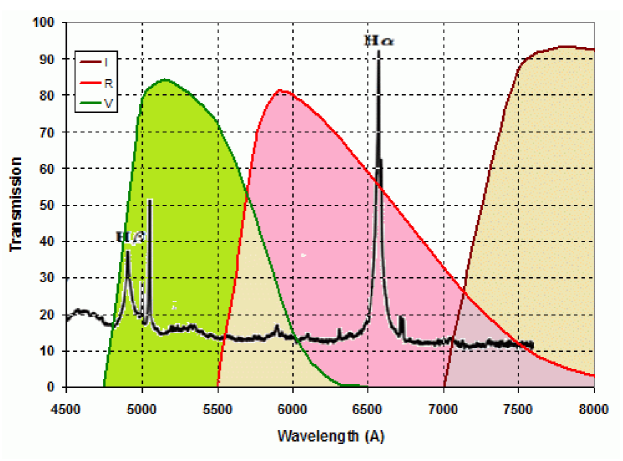
Photometric reverberation mapping proved to be a successful technique for determining BLR linear sizes, especially if narrow-band filters, centered on the lines of interest are used. As we traditionally monitored Mkn 279 with broad-band filters, here we apply this technique using data, collected in these bands (so called broadband photometric mapping; Edri et al., 2012). Thus, the -band flux can be considered as sum of the broad and the continuum contributions, while and fluxes are proxies for the continuum (the constant narrow lines and the host galaxy do not affect this analysis). Fig. 2 shows the filter transmittances superimposed on the Mkn 279 optical spectrum. -band data is not used in this analysis due to generally larger photometric errors.
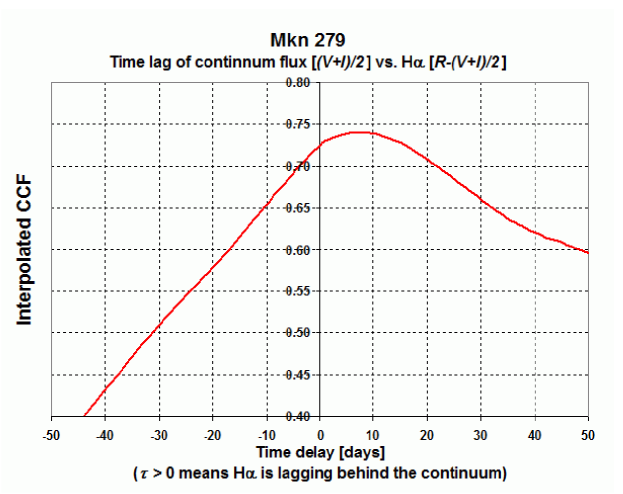
In order to find the time delay of the broad lines ( in this case), we therefore cross-correlate the continuum (represented as an average of and band fluxes in order to minimize the errors) and the -band flux, subtracted by the already calculated continuum (appropriately scaled), which thus represents the pure emission. In other words, we search for the maximum of the following function:
,
where and are fluxes, based on the measured magnitudes.
One can note that the broad slightly enters the -band, which, in principle may compromise the continuum measurement. However, due to the low transmittance of -band filter there, as well as the fact that influence is much weaker compared to our understanding is that the effect is negligible.
4. Results
For this analysis we used only the first 70 observational points (years 1997.5 – 2000.5) since during this period the object was bright (low photometric errors), active (significantly variable on short time scales) and the monitoring cadence was good enough. To find the cross-correlation between unevenly spaced datasets, we used the interpolation cross-correlation method (Gaskel & Sparke, 1986), where the missing parts were linearly interpolated. We found a clear maximum (Fig. 3) for 8 days. These first results are very encouraging as they are close to the spectroscopic reverberation values 123 days (Maoz et al., 1990) and 174 days (Bentz et al., 2009). A detailed analysis, including uncertainty estimates, will be published elsewhere (Bachev et al., to be published).
Thus, knowing the width of the broad lines () as well as the linear distance to the BLR clouds (in this case 8 light days) and assuming virial motion, one can calculate the central black hole mass:
,
which in our case gives (assuming 3050 km/s, our data, to be published elsewhere).
5. Conclusions
Photometric reverberation mapping, even applied to broad-band filters, proved to be an effective, powerful, yet ‘‘cheap’’ technique for estimating the BLR size and the central black hole mass. In this work we applied this technique to the active galaxy nucleus Markarian 279, obtaining encouraging results, rather close to the spectroscopic mapping results. These results indicate that a dense enough photometric monitoring of AGN, even with relatively small instruments can be productive and scientifically significant.
Acknowledgments:This research was partially supported by Bulgarian NSF through grants DO 02-85 and DO 02-137 (2009). The Skinakas Observatory is a collaborative project of the University of Crete, the Foundation for Research and Technology – Hellas, and the Max-Planck-Institut für Extraterrestrische Physik. We thank our referee Prof. Ts. Georgiev for his suggestions to improve this paper.
References
- [1] Bachev R., Strigachev A. 2004, AN 325, 317
- [2] Bentz M. C. et al. 2009, ApJ 705, 199
- [3] Bentz M. C. et al. 2010, ApJ 716, 993
- [4] Carroll C., Joner M. D., Laney D. C. 2013, AAS meeting 221, 339.22
- [5] Chelouche D. & Daniel E. 2012, ApJ 474, 62
- [6] Edri H., Rafter S.E., Chelouche D., Kaspi S., Behar E. 2012, ApJ 756, 73
- [7] Gaskell C. M. & Sparke L. S. 1986, ApJ 305, 175
- [8] Haas M., Chini R., Ramolla M. et al. 2011, A&A 535, 73
- [9] Maoz D., et al. 1990, ApJ 351, 75
- [10] Peterson B. & Horne K. 2004, arXiv:astro-ph/0407538
- [11] Pozo Nuñez et al. 2013, arXiv:1303.3653
- [12] Pozo Nuñez, F., Ramolla M., Westhues C, et al. 2012, A&A 545, 84