Superconductivity and Physical Properties of CaPd2Ge2 Single Crystals
Abstract
We present the superconducting and normal state properties of single crystal investigated by magnetic susceptibility , isothermal magnetization , heat capacity , in-plane electrical resistivity and London penetration depth versus temperature and magnetic field measurements. Bulk superconductivity is inferred from the and data. The data exhibit metallic behavior and undergoes a superconducting transition with K and zero resistivity state at K. The reveal the onset of superconductivity at 2.0 K. For K, the and are weakly anisotropic paramagnetic with . The confirm the bulk superconductivity below K. The superconducting state electronic heat capacity is analyzed within the framework of a single-band -model of BCS superconductivity and various normal and superconducting state parameters are estimated. Within the -model, the data and the plane data consistently indicate a moderately anisotropic -wave gap with , somewhat smaller than the BCS value of 1.764. The relationship of the heat capacity jump at and the penetration depth measurement to the anisotropy in the -wave gap is discussed.
pacs:
74.70.Dd, 74.10.+v, 74.25.Bt, 74.25.-qI Introduction
With the advent of high- superconductivity in FeAs-based compounds, these layered materials attracted much attention within the scientific community. Johnston2010 ; Canfield2010 ; Mandrus2010 ; Stewart2011 Special interest in the doped Fe2As2 ( = Ca, Sr, Ba, Eu) class of materials arose because of their simple -type body-centered tetragonal crystal structure (space group ), the ease of growing large single crystals, and the similarity of their generic phase diagram showing the emergence of superconductivity upon suppression of antiferromagnetic spin density wave (SDW) transition with that of the high- cuprates.Johnston2010 ; Canfield2010 ; Mandrus2010 ; Stewart2011 ; Johnston1997 ; Damascelli2003 ; Lee2006 The 122-type iron arsenide superconductors with the body-centered tetragonal structure consist of superconducting layers of stacked along the axis and FeAs layers appear to be crucial for the emergence of superconductivity. However, the specific relationship of the FeAs layers and the mechanism of superconductivity in iron-arsenide superconductors is not well understood. Therefore the investigations of other 122-type materials without iron should be helpful in addressing such issues. The known iron-free 122-type Ca, Sr, or Ba-based pnictide superconductors include ( K),Ronning2008 ( K),Bauer2008 ( K),Hirai2010 ( K),Kudo2010 ( K),Ronning2009 ( K),Mine2008 ; Tomioka2009 ( K), Berry2009 and ( K),Berry2009 and ( K).Imai2013 The compound ( K) is a non-iron-based 122-type superconductor that is also free of pnictogen.Fujii2009 ; Kim2013 Non-bulk superconductivity was reported in ( K) as arising from a high-temperature metastable -type minority phase.Ku2013
Continuing our investigations of the physical properties of the end-point compounds As2 ( = transition metal),Anand2012a ; Anand2012b ; Anand2013a we recently discovered bulk superconductivity in the PdAs-based compounds and with K and 0.92 K, respectively. They are both found to be conventional type-II -wave superconductors. Despite a very sharp jump in the electronic heat capacity at of , the value of is significantly smaller than the BCS expected value of 1.43, where is the normal-state Sommerfeld electronic heat capacity coefficient.Anand2013a The reduced value of was accounted for by the -model of BCS superconductivity.Padamsee1973 ; Johnston2013 The superconducting state data yielded a reduced compared to the BCS value which may be due to the presence of anisotropy in the -wave superconducting order parameter (gap) and/or to multiple superconducting -wave gaps.Johnston2013
is reported to form in the -type structure. Venturini1989 However the physical properties of this compound have not been reported previously. Here we report crystallographic and normal and superconducting-state properties of this compound. We discovered that single-crystal exhibits a very sharp bulk superconducting transition with a reduced value of , similar to . Single crystals of were grown by the high-temperature solution growth technique using PdGe as flux and were characterized by magnetic susceptibility , isothermal magnetization , heat capacity and in-plane electrical resistivity measurements as a function of temperature and magnetic field . For K the normal-state is paramagnetic and weakly anisotropic with . A sharp jump in at K and zero resistivity below 1.67 K characterize as a bulk superconductor. However is found to be smaller than the BCS expected value of 1.426. In the superconducting state the electronic heat capacity data of are well described by the -modelPadamsee1973 ; Johnston2013 with a reduced suggesting that the -wave gap is anisotropic in momentum spaceJohnston2013 which is manifested as a reduced value of . Our penetration depth measurements indicate -wave superconductivity with , consistent with the value of inferred from the measurements. Our measured and derived normal- and superconducting-state parameters characterize as a conventional -wave type-II superconductor in the dirty limit with a moderately anisotropic -wave gap and/or with multiple -wave gaps.
II EXPERIMENTAL DETAILS
Single crystals of were grown by self-flux high-temperature solution growth using high purity Ca (Ames Lab), Pd (99.998%, Alfa Aesar) and Ge (99.9999%, Alfa Aesar) in a molar ratio of 1:4:4. The starting materials were placed in an alumina crucible and sealed inside an evacuated quartz tube which was placed in a high-temperature furnace. The crystal growth was carried by heating to 1010 ∘C at a rate of 80 ∘C/h, holding for 40 h, then slow cooling over 100 h at a rate of 1.5 ∘C/h down to 860 ∘C, yielding several shiny plate-like crystals that were separated from the molten flux using a centrifuge. Crystals of typical size mm3 were obtained.
A JEOL scanning electron microscope (SEM) equipped with an energy-dispersive x-ray (EDX) analyzer was used to check the quality and chemical composition of the crystals. High-resolution SEM images revealed the crystals to be single phase and the EDX composition analysis showed the average composition of crystals to be consistent with the formula . A Rigaku Geigerflex x-ray diffractometer was used to collect the powder x-ray diffraction (XRD) data using Cu Kα radiation. The crystal structure was determined by Rietveld refinement of the XRD data using the software FullProf.Rodriguez1993
A Quantum Design, Inc. superconducting quantum interference device magnetic properties measurement system (MPMS) was used for magnetic measurements. The anisotropic and data were collected by mounting a single crystal on a thin horizontal rotatable quartz rod using GE 7031 varnish and the contribution from the sample holder was subtracted to obtain the sample contribution. The accuracy of the reported and data is %. A Quantum Design, Inc. physical properties measurement system (PPMS) was used for and in-plane measurements. The was measured by the relaxation method using the heat capacity option of the PPMS and the was measured by the standard four-probe ac technique using the ac transport option of the PPMS. A 3He attachment to the PPMS allowed the and measurements to be carried out down to a temperature of 0.45 K.
The temperature variation of the London penetration depth was measured using a tunnel diode resonator (TDR) operating in a dilution refrigerator at 20.2 MHz. The resonator consists of an tank circuit with a single-layer copper coil with inductance H, a capacitor with capacitance pF, and a tunnel diode that is biased to the region of negative differential resistance, thus compensating the losses in the circuit. This tank circuit develops self-oscillations at a resonant frequency . When a superconducting sample with magnetic susceptibility is inserted into the coil, the total inductance decreases and the (positive) resonant frequency shift is related to the temperature-dependent and hence byProzorov2000 ; Prozorov2006
| (1) |
where is the effective sample dimension and is the sample- and coil-dependent calibration constant, , where is the sample volume, is the coil volume and is the demagnetization factor of the sample. Prozorov2000 To avoid uncertainties related to sample and coil dimensions as well as a poorly-defined demagnetization factor, the calibration constant is determined experimentally by matching the temperature dependence of the skin depth obtained from the resonator response in the normal state to the measured resistivity by using the relation , where is the speed of light in vacuum.Hardy1993
A change in the London penetration depth with respect to its value at the lowest temperature is measured according to . In our experiment in a dilution refrigerator, mK, so K. The coil generates a very small ac magnetic field of about 20 mOe, which was oriented along the tetragonal axis of single crystals of CaPd2Ge2, so the reported London penetration depth corresponds to the penetration depth in the plane.
III Crystallography
| Structure | -type tetragonal |
|---|---|
| Space group | |
| Lattice parameters | |
| (Å) | 4.3216(1) |
| (Å) | 9.9675(3) |
| (Å3) | 186.16(1) |
| Ge axis coordinate | 0.3745(2) |
| Refinement quality | |
| 6.88 | |
| (%) | 7.57 |
| (%) | 9.93 |
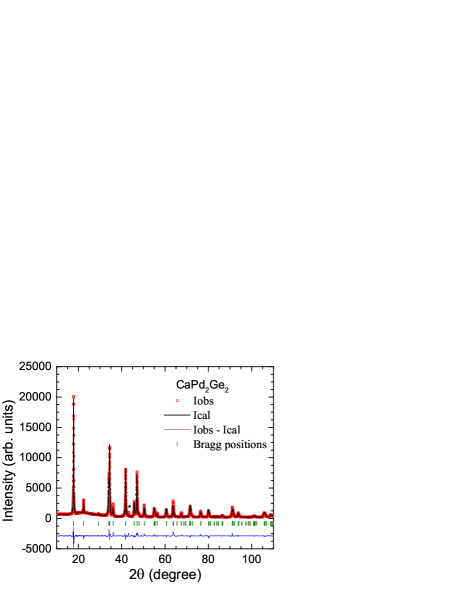
The powder XRD data collected on crushed single crystals of CaPd2Ge2 at room temperature are shown in Fig. 1 together with the Rietveld refinement profile for the -type body-centered tetragonal structure (space group ). The single-phase nature of crystals is evident from the refinement. The weak unindexed peak marked by a star is due to residual flux on the surface of the crystals prior to crushing them. The crystallographic and refinement parameters are listed in Table 1. The lattice parameters , and the -axis position parameter of the Ge atoms are in good agreement with the reported values.Venturini1989 While refining the XRD data we kept the thermal parameters fixed to and the occupancies of the atoms fixed to unity as there was no improvement in the quality of fit and the parameters , and were insensitive to small changes in and atomic site occupancies. The ratio and the interlayer Ge–Ge distance are 2.306(1) and 2.50 Å, respectively.
IV Electrical Resistivity
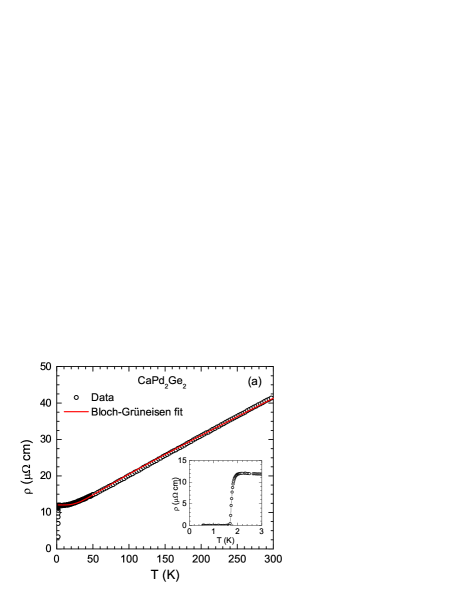
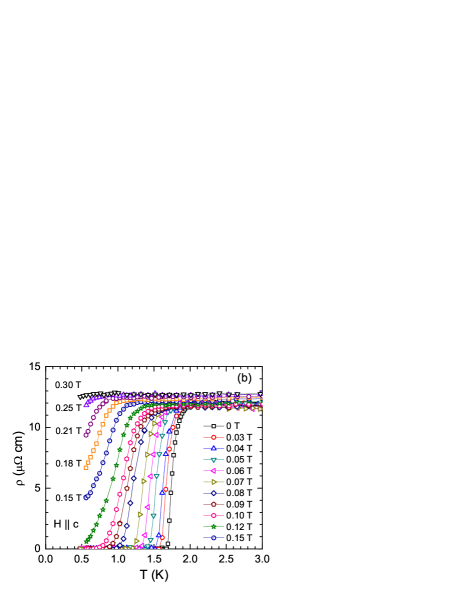
The in-plane data of CaPd2Ge2 measured at various fields in the temperature range 0.45 K 300 K are shown in Fig. 2. The data shown in Fig. 2(a) reveals the metallic character of CaPd2Ge2. The decreases with decreasing and tends to be constant below 20 K until there is a rapid drop in to zero due to the onset of superconductivity. An expanded plot of the zero-field data is shown in the inset of Fig. 2(a), which exhibits a sharp superconducting transition with an onset at K and zero resistance at K. We define K from the temperature of the peak of . The data in Fig. 2(b) at various show that decreases with increasing , where the transition is seen to broaden with increasing . While is suppressed to a temperature below 0.5 K at T, a of 0.6 K is seen even at T. In addition, an increase in the magnitude of the normal-state occurs with increasing .
The normal-state residual resistivity at K and is cm. The residual resistivity ratio RRR . The normal-state data were fitted by the Bloch-Grüneisen (BG) model of resistivity that describes the electrical resistivity due to scattering of conduction electrons by longitudinal acoustic lattice vibrations. Blatt1968 Our fit of data by BG model is shown by the solid red curve in Fig. 2(a). Further details on the fitting procedure can be found in Refs. Anand2012a, and Goetsch2012, . We obtained the resistively-determined Debye temperature K. The fit also yielded cm and cm. The error bars on the two fitted resistivity values are statistical and do not take into account the % uncertainty in the geometric factor that converts the measured resistance values into resistivity values.
V Normal-State Magnetization and Magnetic Susceptibility
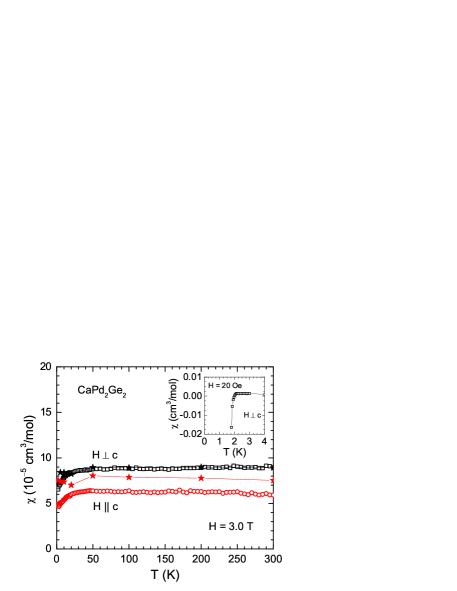
The zero-field-cooled magnetic susceptibilities data of a crystal in the temperature range K for both applied along the axis () and in the plane () are shown in Fig. 3. The measured at low (20 Oe) shown in the inset of Fig. 3 reveals the onset of superconductivity at K, consistent with K obtained from the measurements above. The data measured at T exhibit nearly -independent weak paramagnetism for both directions of . The downturns in below 25 K arise due to an error in measuring the sample holder contribution which was about 85% of the total measured moment due to the small mass of the measured crystal. No such downturns below 25 K are seen in the intrinsic values obtained below from the high-field slopes of isotherms which are shown by filled stars in Fig. 3, indicating that the low- downturns in are extrinsic. The is weakly anisotropic with over the entire temperature range K, which is the same anisotropy as in the parent compounds.Johnston2010
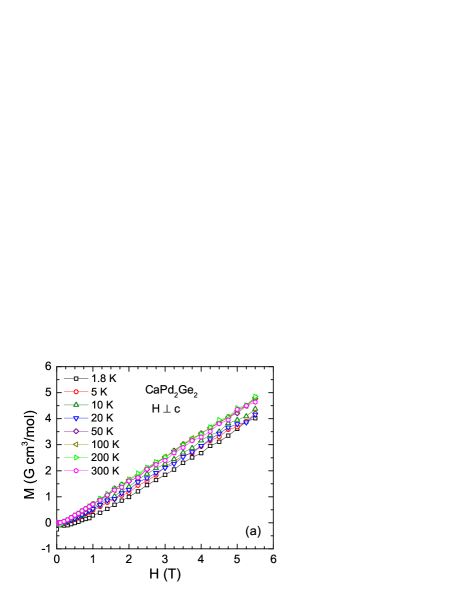
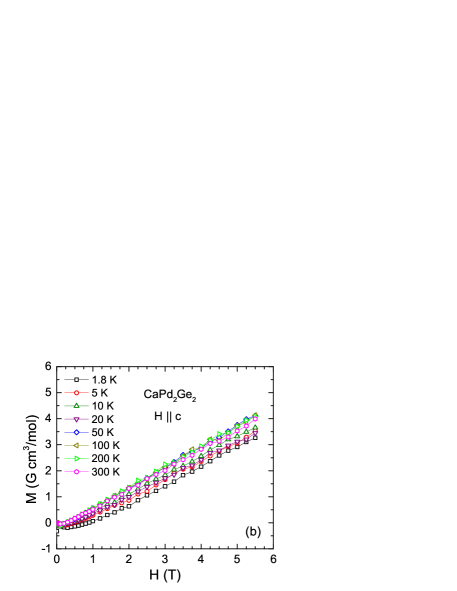
The isotherms of the crystal for both applied along the axis () and in the plane () measured at eight temperatures between 1.8 and 300 K are shown in Fig. 4. The is weakly paramagnetic and anisotropic with . The curves are almost linear in except at low-. In order to obtain the intrinsic we fitted the high-field data by
| (2) |
where is the impurity saturation magnetization. The fitted values obtained from the slope of linear fits of isotherms for T are shown as filled stars in Fig. 3. The values (not shown) are found to be negative which is unphysical and can be attributed to a small error in the calibration of the sample holder contribution to the total magnetization.
The powder- and temperature-average of the intrinsic for K in Fig. 3 is cm3/mol. The intrinsic contains the four contributions
| (3) |
The first three contributions are orbital terms and the last term is the Pauli spin susceptibility of the conduction carriers. is the diamagnetic core susceptibility, is the paramagnetic Van Vleck susceptibility and is the Landau diamagnetic susceptibility of the conduction carriers. Using the constituent atomic diamagnetic susceptibilities,Mendelsohn1970 we obtain cm3/mol. The is estimated using the relation Ashcroft1976 , where is the spectroscopic splitting factor (-factor) of the conduction carriers, is the Bohr magneton, and is the band-structure density of states at the Fermi energy . Using and states/eV f.u. obtained in Eq. (9) below from heat capacity measurements, one obtains cm3/mol. The is estimated from using the relation Ashcroft1976 ; Elliott1998 , which assuming the band structure effective mass gives cm3/mol, where is the free-electron mass. The powder-averaged value is then estimated from Eq. (3) using the above-estimated , , , and values as cm3/mol.
VI Heat Capacity
VI.1 Overview of the Superconducting- and Normal-State Heat Capacities
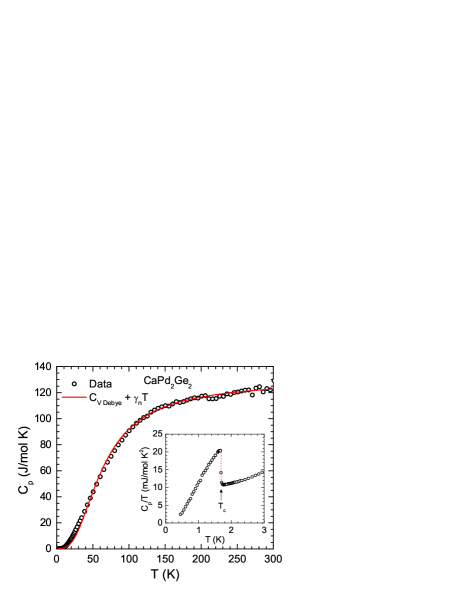
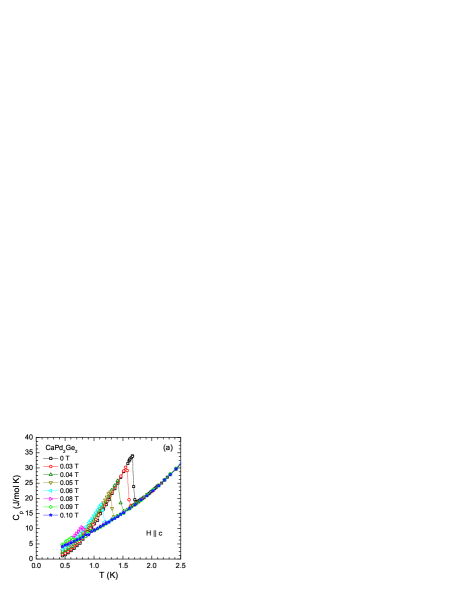
The data of measured at in 0.45 K 300 K are shown in Fig. 5. A sharp jump in due to the occurrence of superconductivity at K is evident from the low- data shown in the inset of Fig. 5. The jump in and are found to decrease with the application of magnetic field as can be seen from the data measured at various shown in Fig. 6(a). The is found to suppress to below 0.45 K by T.
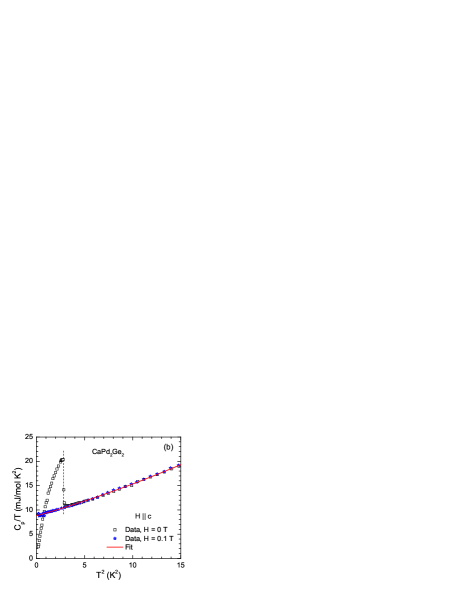
Plots of vs. for and 0.10 T are shown in Fig. 6(b). In order to estimate the normal-state Sommerfeld electronic heat capacity coefficient we fitted the (normal-state) data at T and the normal-state part of the data at simultaneously by
| (4) |
where is the Debye -law low- lattice heat capacity and is an additional lattice heat capacity contribution. The fit of data at T in K and at in K is shown by the red curve in Fig. 6(b). We thus obtained mJ/mol K2, mJ/mol K4 and J/mol K6. The Debye temperature K was estimated from using the relation Kittel2005 , where is the molar gas constant and is the number of atoms per formula unit (f.u.).
The high-temperature data in Fig. 5 yield J/mol K, which is close to the expected classical Dulong-Petit value = 124.7 J/mol K at constant volume.Kittel2005 ; Gopal1966 The normal-state data at over the full temperature range 2.0 K 300 K were fitted by the sum of the electronic term determined above and the Debye model lattice heat capacity ,Goetsch2012 ; Kittel2005 ; Gopal1966 yielding the fitted Debye temperature K. The fit is shown as the solid red curve in Fig. 5. This value of agrees within the statistical error bars with the value K obtained above from the coefficient . This good agreement is very unusual because is temperature-dependent due to the difference between the actual phonon density of states versus frequency of a material and the quadratic behavior assumed in the Debye theory for all materials. On the other hand, this value of is much larger than the K obtained above from the fit of the data by the Bloch-Grüneisen theory. Often these differently-derived values of the Debye temperature are in fairly good agreement. It is not clear why they are so different for since the respective experimental data from both types of measurements are well fitted by the respective theory.
The density of states at the Fermi energy determined from heat capacity measurements was estimated from the value of according to Kittel2005
| (5) |
Using the above value mJ/mol K2 gives
| (6) |
for both spin directions. This value of includes the influence of the electron-phonon interaction. The bare band-structure density of states and are related to according toGrimvall1976
| (7a) | |||||
| (7b) | |||||
where is the electron-phonon coupling constant and is the effective mass of the quasiparticles (charge carriers). An estimate of is made from and using the relation from McMillan’s theoryMcMillan1968
| (8) |
where is the repulsive screened Coulomb parameter. Taking to be the representative value and using the values K and K, Eq. (8) gives . This value of is rather small and indicates weak-coupling superconductivity in . The value
| (9) |
for both spin directions is obtained from the values of and using Eq. (7a).
Next we estimate the mean free path from the values of and the residual resistivity . The Fermi velocity is related to by Kittel2005
| (10) |
where is the volume per formula unit and is Planck’s constant divided by . This gives where we assumed that the band mass is and hence from Eq. (7b). The mean free path is given by , where the mean free scattering time is related to by , Kittel2005 being the conduction carrier density given by Kittel2005
| (11) |
Thus
| (12) |
where . Using the above estimated value of for cm we obtain , where again we used .
The superconducting London penetration depth in the clean limit at , , is a normal-state property since it can be estimated from the Fermi velocity using the relation Tinkham1996
| (13) |
where is the speed of light in vacuum and the plasma angular frequency of the conduction carriers is given by
| (14) |
The above normal-state parameters are summarized in Table 2.
| CaPd2Ge2 property | value |
|---|---|
| (K) | 1.69(3) |
| (mJ/mol K2) | 8.78(4) |
| (states/eV f.u.) | 3.72(2) |
| (K) from low- data | 259(3) |
| (K) from all- data | 259(2) |
| (K) from data | 171(3) |
| 0.51 | |
| (mJ/mol K) | 17.9(3) |
| 1.21(3) | |
| (from ) | 1.62(3) |
| (K) (observed) | 2.62(5) |
| 0.065 | |
| (mT) | 15.0 |
| (T) | 2.89 |
| (mT) | 3.1 |
| (dirty limit) (T) | 0.13(2) |
| (mT) | 134 |
| 6.30 | |
| (nm) | 49.7 |
| (nm) | 1181 |
| (nm) | 2.55 |
| 2.37 | |
| (clean limit) (nm) | 12.6 |
| (dirty limit) (nm) | 272–313 |
| (nm) | 186(16) |
VI.2 Superconducting-State Properties
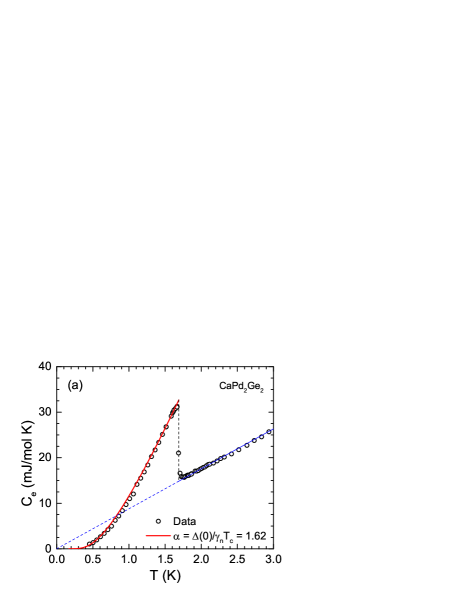
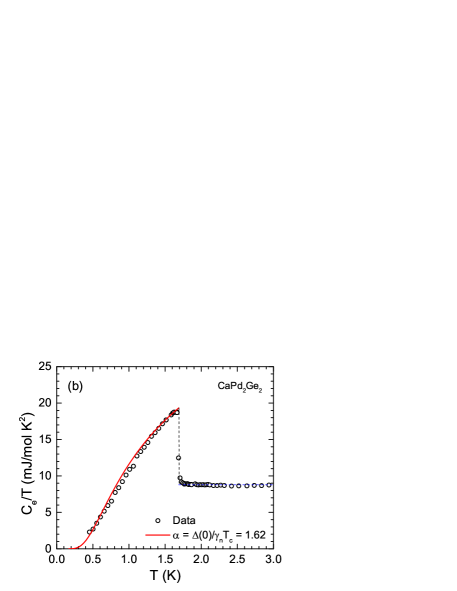
The electronic contribution to the heat capacity for is shown in Fig. 7. The was obtained by subtracting the above-determined phonon contribution from the measured data, i.e., ). A sharp jump in at reveals bulk superconductivity in . From Fig. 7, mJ/mol K or is obtained corresponding to the entropy-conserving construction shown by the vertical dotted line at in Fig. 7(a). The normalized value is obtained using the above estimated mJ/mol K2. This intrinsic value of is significantly smaller than the BCS value .Tinkham1996 We attribute this reduction to the presence of an anisotropic superconducting energy gap in a single -wave gap modelJohnston2013 and use the single-band -model of the BCS theory superconductivity Bardeen1957 ; Padamsee1973 ; Johnston2013 for further analysis of the superconducting state data.
In the -model, the BCS parameter is used to calculate the order parameter and the London penetration depth, but is replaced by a variable and hence a variable in fitting other properties such as the jump in the electronic heat capacity at .Padamsee1973 ; Johnston2013 Using the relation Johnston2013
| (15) |
for we obtain which is significantly smaller than the BCS value of 1.764. The solid red curves in Figs. 7(a) and 7(b) are the theoretical predictions of the -model for using . The predicted superconducting state and behaviors are seen to be in good agreement with the -dependent experimental data. Additional information on fitting data within the framework of the -model is given in Refs. Anand2013a, and Johnston2013, .
Within the -model, the thermodynamic critical field at is given by Johnston2013
| (16) |
where the Sommerfeld coefficient per unit volume is in units of , and for our compound we obtain from the above experimental value of and the molar volume. Then using and K, Eq. (16) gives mT.
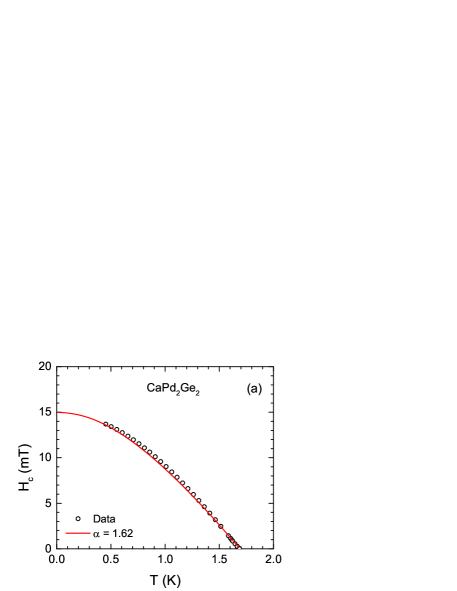
The experimental thermodynamic is determined from the zero-field data according to Tinkham1996 ; DeGennes1966
| (17) |
where the electronic contribution to the entropy is , and and are the electronic entropies of the normal and superconducting states, respectively. The experimental obtained from the zero-field according to Eq. (17) is shown in Fig. 8(a). The -model prediction for is shown by the solid red curve in Fig. 8(a). The data and the theoretical prediction of the -model are seen to be in very good agreement.
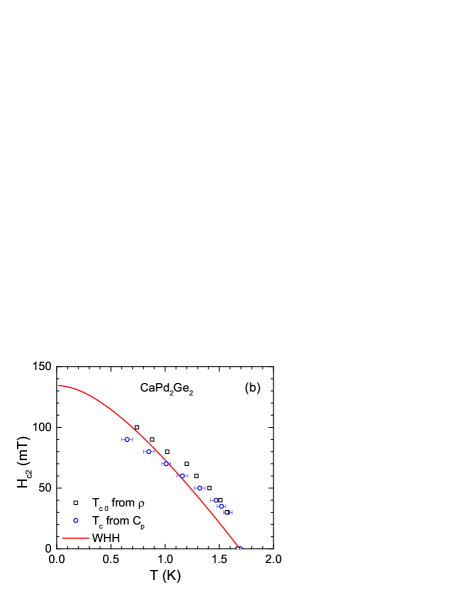
The dependences of the upper critical field of obtained from the data in Fig. 2(b) at which zero resistance is reached on cooling and the data in Fig. 6(a) measured with axis are shown in Fig. 8(b). It is seen that the values are much larger than the thermodynamic critical field mT determined above which shows that is a type-II superconductor.
The orbital critical field at , , is related to the initial slope of according toHefland1966 ; WHH1966
| (18) |
where and 0.69 in the clean and dirty limits, respectively. Within the -model of the BCS theory of superconductivity, the Pauli-limiting upper critical field at , , is given by Johnston2013
| (19) |
which for K, obtained above and gives T. The measured is much smaller than , indicating that the effect of Pauli limiting on is weak.
We further analyze the data using the dirty-limit WHH (Werthamer, Helfand and Hohenberg) theory. WHH1966 We confirm below that is in the dirty limit. The WHH theory includes the influence of both Pauli limiting and spin-orbit scattering of quasiparticles on according to WHH1966
| where the dimensionless , is the spin-orbit scattering parameter and is defined as | |||||
| (20b) | |||||
The Maki parameter is a measure of the relative strengths of the orbital and Pauli-limiting values of and is given by Maki1966
| (21) |
Using Eq. (18) and T obtained above, Eq. (21) yields the Maki parameter as
| (22) |
Taking for the dirty limit appropriate to the WHH theory gives
| (23) |
We fitted the combined experimental data in Fig. 8(b) obtained from the and measurements by Eqs. (20) using , T/K and a corresponding obtained from Eq. (23) as shown by solid red curve in Fig. 8(b). The fit yields mT. The values T in the clean limit and T in the dirty limit are estimated from Eq. (18) using the same value T/K.
The Ginzburg-Landau parameter is obtained from and using the relation Tinkham1996
| (24) |
which for mT and the above-obtained mT gives . This value of is much larger than indicating that is a type-II superconductor. The lower critical field is obtained from and using the relation Tinkham1996
| (25) |
yielding mT.
The characteristic Ginzburg-Landau coherence length at , , is obtained from Tinkham1996 ; DeGennes1966
| (26) |
where G cm2 is the flux quantum. For mT we obtain , which is much larger than the mean free path nm in Table 2, indicating dirty-limit superconductivity in .
The effective magnetic penetration depth is estimated from and using the relation Tinkham1996
| (27) |
which gives nm. Alternatively can be estimated using the dirty limit relation Tinkham1996
| (28) |
where is BCS coherence length which is related to as Tinkham1996
| (29) |
which for leads to
| (30) |
Substituting from Eq. (28) leads to
| (31) |
Solving for we obtain nm and then Eq. (28) gives nm in the dirty limit which is similar to the previous estimate of .
In order to check the consistency of our parameters we estimate the Fermi velocity from the BCS coherence length which for -model are related by Johnston2013
| (32) |
We obtain cm/s for and nm. The value of is in reasonable agreement with cm/s estimated from Eq. (10) above from the density of states at the Fermi energy derived from .
VII London Penetration Depth
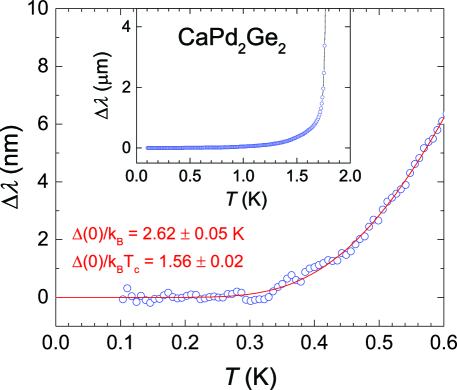
A sample with dimensions of mm3 with the shortest length being along the tetragonal axis was cut from the crystal used for the above heat capacity measurements. Figure 9 shows the temperature variation of the -plane London penetration depth . The absolute value of the penetration depth was obtained using the TDR technique by matching the frequency shift to the skin depth m calculated from the residual resistivity cm and frequency MHz. The superconducting transition temperature was determined as the temperature of the maximum of . The obtained is 1.77 K, which lies between the values of 1.69 K and 1.98 K determined from the above heat capacity and resistivity measurements, respectively.
The temperature dependence of up to is shown in the inset of Fig. 9. At low temperatures below , the in Fig. 9 shows a clear saturation on cooling, which is an indication of a fully-gapped superconducting order parameter in CaPd2Ge2. CaPd2Ge2 is a dirty-limit superconductor, for which the London penetration depth in the single-band model for isAnand2013a
| (33) |
The experimental data are fitted well up to by Eq. (33) as shown by the solid red curve in Fig. 9, where the fitting parameters are nm and K. The error bars are statistical and are obtained from fitting with a fixed temperature domain from to .
Using the bulk K determined by the above heat capacity measurement, we obtain which is in good agreement with determined from the heat capacity jump, both of which are smaller than the value expected for an isotropic weak-coupling BCS superconductor. This reduction is likely due to a moderate anisotropy of a single -wave superconducting order parameterJohnston2013 although the possibility of multigap -wave superconductivity in CaPd2Ge2 cannot be ruled out.Johnston2013
The measured and derived superconducting state parameters of obtained in this and the above sections are summarized in Table 2.
VIII Anisotropy in the Superconducting Gap
The single-band -model of the clean-limit BCS -wave theory of superconductivity22,23 describes deviations in the electronic superconducting thermodynamic properties from the BCS predictions by allowing the parameter to vary when fitting the superconducting-state electronic heat capacity , entropy and thermodynamic critical field, whereas the BCS value is used when calculating . This is an inconsistency in the model, but it does allow the experimental data to be fitted. Values of indicate strong-coupling superconductivity whereas values indicate anisotropy in the -wave gap around the Fermi surface. Johnston2013 ; Kogan2014 For , the for measures an average over the anisotropic gap, whereas for measures the minimum value of the gap.
Our and data yield similar values and 1.56(2), respectively. Thus both measurements indicate the presence of anisotropy in the superconducting -wave order parameter. However, the BCS theory and the -model based on it were formulated for clean-limit superconductors, whereas we have shown that is in the dirty limit, which would be expected to reduce the degree of anisotropy that would be present in the clean limit. Therefore we do not attempt to derive a quantitative estimate of the anisotropy of the superconducting gap in terms of our values.
IX Summary
Single crystals of were synthesized by the self-flux high-temperature growth technique. Our powder x-ray diffraction investigation of crushed crystals confirms that the compound crystallizes in the body-centered tetragonal - type structure as previously reported. The superconducting- and normal-state properties were studied using , , , and measurements which provide conclusive evidence of bulk superconductivity with K. The normal-state data reveal metallic character and were analyzed using the Bloch-Grüneisen model of electrical resistivity. The normal-state data were analyzed using the sum of an electronic term and the Debye model of lattice heat capacity, yielding the Sommerfeld coefficient mJ/mol K2 and Debye temperature K. The normal-state and data exhibit weak anisotropic -independent paramagnetism with .
The superconducting transition is revealed by a very sharp jump in at K with a heat capacity jump at given by that is smaller than the BCS value of 1.426. The superconducting state electronic heat capacity data are analyzed using the -model of the BCS theory of superconductivity. The very good agreement between the -model prediction and the experimental data supports the applicability of the model. The value obtained is smaller than the BCS value , reflecting the corresponding reduction in the heat capacity jump at . Within a single band model, this reduction arises from anisotropy in an -wave gap, but multigap -wave superconductivity is not ruled out. Various normal- and superconducting-state parameters are estimated which indicate that is a dirty-limit weak-coupling type-II -wave electron-phonon driven superconductor.
Acknowledgements.
We thank V. G. Kogan for helpful comments on the gap anisotropy. This research was supported by the U.S. Department of Energy, Office of Basic Energy Sciences, Division of Materials Sciences and Engineering. Ames Laboratory is operated for the U.S. Department of Energy by Iowa State University under Contract No. DE-AC02-07CH11358.References
- (1) D. C. Johnston, Adv. Phys. 59, 803 (2010).
- (2) P. C. Canfield and S. L. Bud’ko, Annu. Rev. Condens. Matter Phys. 1, 27 (2010).
- (3) D. Mandrus, A. S. Sefat, M. A. McGuire, and B. C. Sales, Chem. Mater. 22, 715 (2010).
- (4) G. R. Stewart, Rev. Mod. Phys. 83, 1589 (2011).
- (5) D. C. Johnston, in Handbook of Magnetic Materials, edited by K. H. J. Buschow (Elsevier Science, Amsterdam, 1997), Vol. 10, Chap. 1, pp. 1–237.
- (6) A. Damascelli, Z. Hussain, and Z.-X. Shen, Rev. Mod. Phys. 75, 473 (2003).
- (7) P. A. Lee, N. Nagaosa, and X.-G. Wen, Rev. Mod. Phys. 78, 17 (2006).
- (8) F. Ronning, N. Kurita, E. D. Bauer, B. L. Scott, T. Park, T. Klimczuk, R. Movshovich, and J. D. Thompson, J. Phys.: Condens. Matter 20, 342203 (2008).
- (9) E. D. Bauer, F. Ronning, B. L. Scott, and J. D. Thompson, Phys. Rev. B 78, 172504 (2008).
- (10) D. Hirai, T. Takayama, D. Hashizume, R. Higashinaka, A. Yamamoto, A. K. Hiroko, and H. Takagi, Physica C 470, S296 (2010).
- (11) K. Kudo, Y. Nishikubo, and M. Nohara, J. Phys. Soc. Jpn. 79, 123710 (2010).
- (12) F. Ronning, E. D. Bauer, T. Park, S.-H. Baek, H. Sakai, and J. D. Thompson, Phys. Rev. B 79, 134507 (2009)
- (13) T. Mine, H. Yanagi, T. Kamiya, Y. Kamihara, M. Hirano, and H. Hosono, Solid State Commun. 147, 111 (2008).
- (14) Y. Tomioka, S. Ishida, M. Nakajima, T. Ito, H. Kito, A. Iyo, H. Eisaki, and S. Uchida, Phys. Rev. B 79, 132506 (2009).
- (15) N. Berry, C. Capan, G. Seyfarth, A. D. Bianchi, J. Ziller, and Z. Fisk, Phys. Rev. B 79, 180502(R) (2009).
- (16) M. Imai, S. Emura, M. Nishio, Y. Matsushita, S. Ibuka, N. Eguchi, F. Ishikawa, Y. Yamada, T. Muranaka, and J. Akimitsu, Supercond. Sci. Technol. 26, 075001 (2013).
- (17) H. Fujii and A. Sato, Phys. Rev. B 79, 224522 (2009).
- (18) H. Kim, N. H. Sung, B. K. Cho, M. A. Tanatar, and R. Prozorov, Phys. Rev. B 87, 094515 (2013)
- (19) H. C. Ku, I. A. Chen, C. H. Huang, C. W. Chen, Y. B. You, M. F. Tai, and Y. Y. Hsu, Physica C 493, 93 (2013).
- (20) V. K. Anand, P. K. Perera, A. Pandey, R. J. Goetsch, A. Kreyssig, and D. C. Johnston, Phys. Rev B 85, 214523 (2012).
- (21) V. K. Anand and D. C. Johnston, Phys. Rev B 86, 214501 (2012).
- (22) V. K. Anand, H. Kim, M. A. Tanatar, R. Prozorov, and D. C. Johnston, Phys. Rev. B 87, 224510 (2013).
- (23) H. Padamsee, J. E. Neighbor, and C. A. Shiffman, J. Low Temp. Phys. 12, 387 (1973).
- (24) D. C. Johnston, Supercond. Sci. Technol. 26, 115011 (2013).
- (25) G. Venturini, B. Malaman, B. Roques, J. Solid State Chem. 79, 136 (1989).
- (26) J. Rodríguez-Carvajal, Physica B 192, 55 (1993); see also www.ill.eu/sites/fullprof/.
- (27) R. Prozorov, R. W. Giannetta, A. Carrington, and F. M. Araujo-Moreira, Phys. Rev. B 62, 115 (2000).
- (28) R. Prozorov and R. W. Giannetta, Superconductor Science and Technology 19, R41 (2006).
- (29) W. N. Hardy, D. A. Bonn, D. C. Morgan, R. Liang, and K. Zhang, Phys. Rev. Lett. 70, 3999 (1993).
- (30) F. J. Blatt, Physics of Electronic Conduction in Solids (McGraw-Hill, New York, 1968).
- (31) R. J. Goetsch, V. K. Anand, A. Pandey, and D. C. Johnston, Phys. Rev. B 85, 054517 (2012).
- (32) L. B. Mendelsohn, F. Biggs, and J. B. Mann, Phys. Rev. A 2, 1130 (1970).
- (33) N. W. Ashcroft and N. D. Mermin, Solid State Physics (Brooks Cole, Belmont, CA, 1976).
- (34) S. R. Elliott, The Physics and Chemistry of Solids (Wiley, Chichester, 1998).
- (35) C. Kittel, Introduction to Solid State Physics, 8th ed. (Wiley, New York, 2005).
- (36) E. S. R. Gopal, Specific Heats at Low Temperatures (Plenum, New York, 1966).
- (37) G. Grimvall, Phys. Scr. 14, 63 (1976).
- (38) W. McMillan, Phys. Rev. 167, 331 (1968).
- (39) M. Tinkham, Introduction to Superconductivity, Ed. (Dover, Mineola, NY, 1996).
- (40) J. Bardeen, L. N. Cooper, and J. R. Schrieffer, Phys. Rev. 108, 1175 (1957).
- (41) P. G. de Gennes, Superconductivity of Metals and Alloys (Benjamin, New York, 1966).
- (42) E. Helfand and N. R. Werthamer, Phys. Rev. 147, 288 (1966).
- (43) N. R. Werthamer, E. Helfand, and P. C. Hohenberg, Phys. Rev. 147, 295 (1966).
- (44) K. Maki, Phys. Rev. 148, 362 (1966).
- (45) V. G. Kogan, private communication.