Exploring high temperature magnetic order in CeTi1-xScxGe
Abstract
Most of magnetic transitions related to Ce ordering are found below K. Among the few cases exceeding that temperature, two types of behaviors can be distinguished. One of them is related to the rare cases of Ce binary compounds formed in BCC structures, with a quartet ground state, whose degeneracy (N = 4) is reduced by undergoing different types of transitions mostly connected with structural modifications. The other group shows evidences of itinerant character with the outstanding example of CeRh3B2 showing the highest ordering temperatures K. The second highest ordering temperature has been reported for CeScGe with K, but the nature of this magnetic state has not been investigated very deeply. In order to shed more light into this unusual high temperature ordering we studied the structural, magnetic, transport and thermal properties of CeTi1-xScxGe alloys in the stability range of the CeScSi-type structure This system presents a rich variety of magnetic behaviors along this concentration range, with the magnetic ordering growing from ferromagnetic (FM) K up to an antiferromagnetic (AFM) transition at K. The different regions show the following characteristics:
i) on the Ti rich side () it exhibits a FM ground state (GS) with large saturation magnetization values up to . ii) Around , the first crystal electric field excited doublet starts to contribute to the GS magnetic properties. Furthermore an AFM component with a connected metamagnetic transition appears. iii) At a clear change in the GS nature is associated to a critical point above which the GS properties can be described like for an itinerant system (with decreasing ) and an effective GS degeneracy . iv) For , the magnetic phase boundary splits into two transitions, with an intermediate phase presenting incommensurate spin density waves features.
I Introduction
Magnetic transitions related to Ce ordering can be found along four decades of temperature, from 1.6mK in CMN CMN and 115K in CeRh3B2 Malik , though most of transitions occur between 1K and 50K Bauer91 ; Hand91 . Different magnetic behaviors characterize different temperature ranges of magnetic order. In a simple description three groups can be recognized: i) the one dominated by quantum fluctuations at K PhilMag , ii) the classical behavior related to localized Ce-4f moments mostly observed between K Bauer91 , and iii) the few cases whose ordering temperatures exceed K. Among these compounds, two types of behaviors can also be distinguished. One of them is related to the rare cases of Ce binary compounds formed in BCC structures, with a quartet ground state (GS), whose degeneracy (N = 4) is reduced by undergoing different types of transitions mostly connected with structural modifications Hand91 . The other group shows evidences of itinerant character DeLong91 with the outstanding example of CeRh2Si2 showing one of the highest ordering temperatures K Godart83 . Within the large number of studies performed on this compound CeRh2Si2 , evidences for both local and itinerant magnetic character are equally claimed by different authors 8kawa ; 5settai97 . Such ambiguity is discussed since a long time and recognized as the local-itinerant dilemma of Ce- electrons Mackin , not completely elucidated yet. This is partially due to the lack of exemplary systems clearly running between those limits driven by external control parameters like alloying or pressure.
With the aim to contribute with further experimental information to this unsolved problem, we have studied CeTi1-xScxGe alloys whose magnetic transition temperatures cover an unusually extended range of temperature from K in CeTi0.75Sc0.25Ge, up to the second highest ordering temperature among Ce compounds at K of the stoichiometric limit CeScGe Canfield91 . Within a large range of thermal energy, the excited crystal-electric-field (CEF) levels progressively contribute to the formation of the ordered phase with the consequent change of the GS magnetic properties. A crystalline modification from CeScSi- to CeFeSi-type structure limits the range of study to .
II Experimental details and results
Polycrystalline samples of CeTi1-xScxGe with were synthesized by arc melting under argon atmosphere the nominal amounts of the constituents (purity above 99.99%) weighted inside an Ar atmosphere glove-box. The samples were turned over and remelted several times to ensure homogeneity. Then, the samples were placed in a tungsten boat wrapped with zirconium foil and annealed at 1200 oC for one week. The quality of the samples was verified by means of X-ray powder-diffraction measurements using Cu-K radiation () in a Stoe-Stadip-MP diffractometer. The pattern was indexed on the basis of the tetragonal CeScSi-type structure. Eleven samples were studied all along the concentration range.
Specific heat was measured between 0.5 and 50K using a standard heat pulse technique in a semi-adiabatic He3 calorimeter, at zero and applied magnetic field of kOe in some selected samples. The magnetic contribution is obtained by subtracting the phonon contribution extracted from LaTi0.5Sc0.5Ge. DC-magnetization measurements were carried out using a Quantum Design MPMS magnetometer operating between 2 and 300K, and as a function of field up to 50kOe. Electrical resistivity was measured between 2 K and room temperature using a standard four probe technique with an LR700 resistive bridge.
II.1 Crystal structure
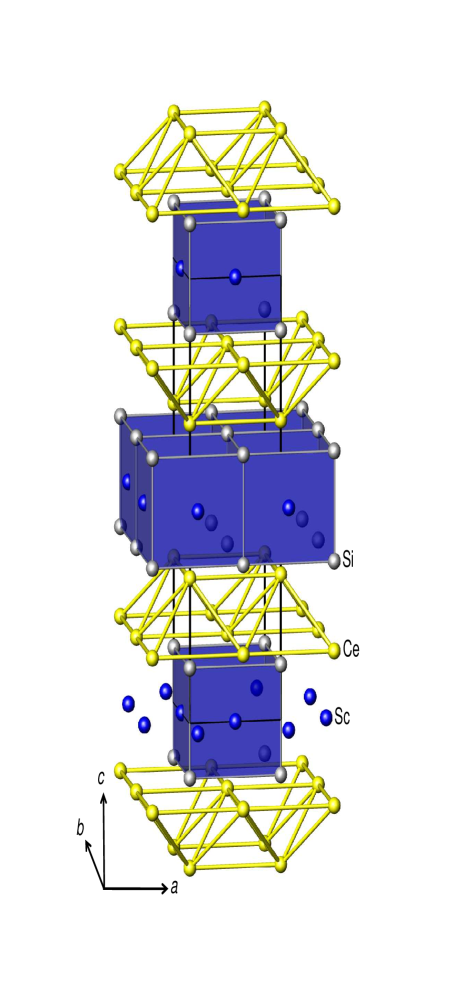
The CeTi1-xScxGe system forms in two related crystal structure: CeFeSi-type for low Sc content (up to ) and CeScSi-type beyond Gruner . In the latter, each second Ce-double layer is shifted by (1/2, 1/2) with a rearrangement of Si atoms, becoming a body centered tetragonal instead of primitive tetragonal of CeFeSi, see Fig. 1, with the consequent doubling of the ’c’ lattice parameter though the first coordination spheres of Ce are identical.
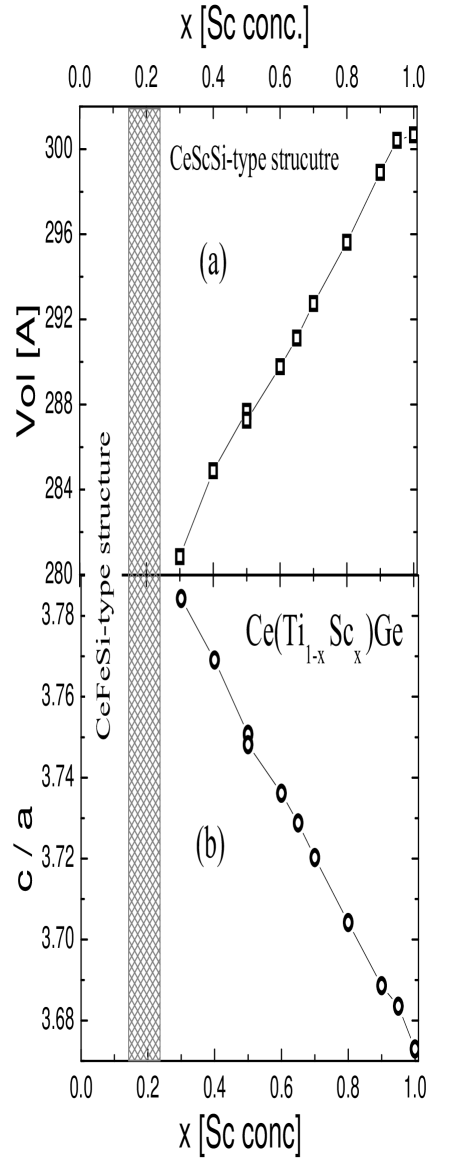
The unit cell volume dependence on Sc concentration and the ’c/a’ lattice parameters ratio are shown in Fig. 2a and b respectively. The increase of the unit cell volume can be explained by the larger atomic volume of Sc with respect to Ti, whereas the reduction of the ’c/a’ ratio is due to the increase of the ’a’ parameter because the ’c’ one remains practically unchanged. This indicates that an expansion in the basal plain of the tetragonal structure occurs whereas the atomic distances in the ’c’ axis direction are not affected.
II.2 Magnetic susceptibility
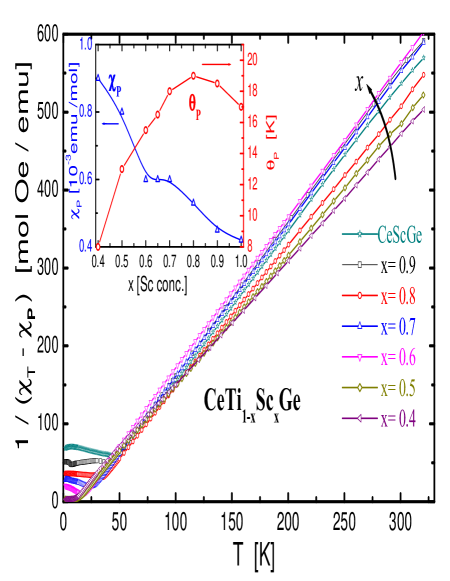
In Fig. 3, the inverse of the high temperature magnetic susceptibility is presented after subtracting a Pauli type paramagnetic contribution. At high temperature, is characterized by a decrease of the effective magnetic moment from at to at and remains nearly unchanged for higher Sc content.
The paramagnetic temperature is always positive and increases with Sc concentration from at up to 19K at , where it starts a slight decrease as seen in the inset of Fig. 3. A significant Pauli-type contribution is observed along the concentration range, decreasing from at down to emu/Oe mol at . This type of contribution was already reported for CeScGe Uwatoko .
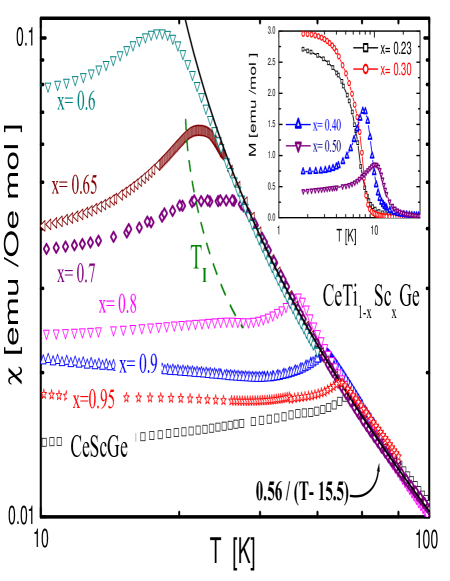
The magnetic susceptibility results in the range (K) are shown in Fig. 4 in a double logarithmic representation. In the inset, the samples with are included using a more extended scale. Except for the alloys with , all samples show a maximum in at the ordering temperature. The thermal dependence on the paramagnetic phase is compared in the figure with a general Curie-Weiss function emu/Oe mol, including a positive K value, indicating a similar behavior for all concentrations above the transition.
On the contrary, the ordered phase shows a quasi continuous variation of the magnetic characteristics with Sc concentration increase. The typical susceptibility dependence of a FM is observed in the and 0.3 alloys, whereas those samples with show an incipient AFM component, see the inset in Fig. 4. Except for the former two FM alloys (i.e. and 0.3), the magnetic structure seems to be complex and therefore we will label those magnetic transitions as , discussing the respective magnetic characteristics in the different concentration regions.
Those regions can be sorted into three ranges: i) for the dependence indicate an increasing mixture of FM and AFM components in the GS. In this region, the ordering temperature ranges between K for and 19K for . At the maximum displays two very close shoulders which can be distinguished after a detailed analysis of the curvature, i.e. its second derivative . This feature reveals the concentration located very close to a critical point, above which two branches of the phase boundary are observed. ii) Between , a slight kink is observed at below the ordering temperature (see Fig. 4). In this range of concentration, increases from 19K at up to 35K at , whereas increases from 18K up to 26K. iii) Above , increases from 38K at up to 47K at , whereas increases moderately from 35K up to 45K, but the associated anomaly smears out.
II.3 Electrical resistivity
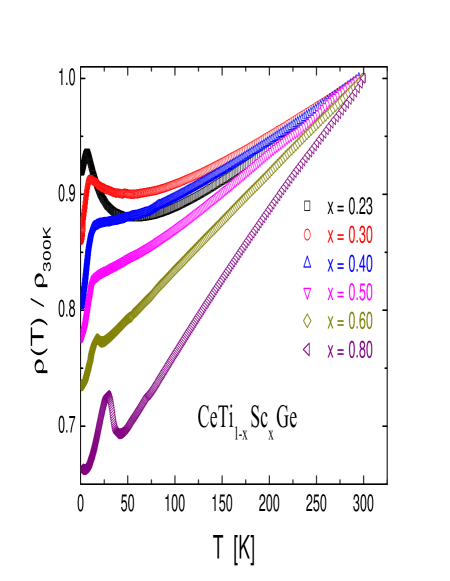
The electrical resistivity measurements normalized at 300K of some representative concentrations between are presented in Fig. 5. The increase of approaching the ordering temperature in progressively transforms into a kink at showing the coherence effect in the ordered phase. For higher Sc concentrations an anomaly related to an antiferromagnetic AFM transition the characteristic gap is observed.
II.4 Specific heat
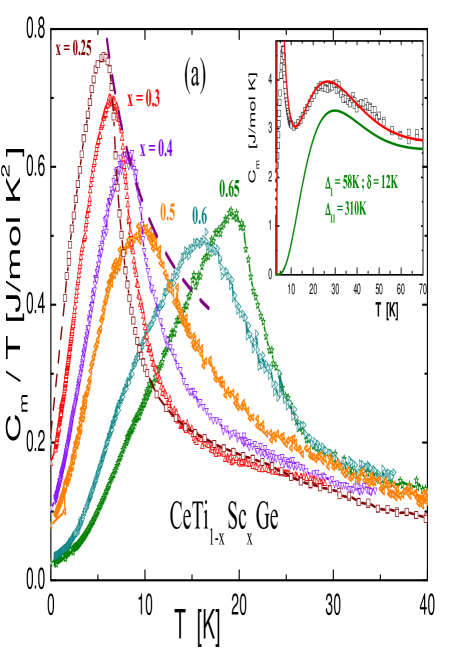
Several peculiar features are observed in the specific heat results along the concentration variation in coincidence with the different regimes detected with measurements. The results obtained from the measurements performed on the alloys are presented in Fig. 6 as , where indicates the magnetic contribution to the specific heat after phonon subtraction. Within the experimental dispersion the maxima of coincide with the respective transition temperatures extracted from magnetic measurements. A common feature along this concentration range is the lack of a jump at . Instead, a tail in is observed, indicating the presence of magnetic fluctuations above the transition temperature.
Notably, in the low Sc concentration samples () the maximum of decreases as . This fact implies that the maximum of does not extrapolate to zero with in contradiction with the thermodynamic principles. Such a sort of entropy bottleneck would have impede even if the CeScSi-type structure would have extended to . Similar behavior was observed in the Ce2(Ni1-xPdx)2Sn system on the Ni-rich side PhilMag that also shows a structural transition limiting the divergence. Between and 0.65, a different regime sets on because the maximum of remains practically unchanged. Another characteristic of this range of concentration is the decrease of extrapolation from J mol-1K-2 to J mol-1K-2 between and 0.65. Coincidentally, the increase of the low temperature curvature in indicates a progressive opening of a gap of anisotropy () in the magnon spectrum that for reaches K as shown by the fitting curve included in Fig. 7. For such a fit we have used the function: . The tail of become more extended with increasing Sc concentration. However, sample recovers a significant slope above indicating a change in the nature of the transition associated to a reduction of magnetic fluctuations in the paramagnetic phase.
Between and 0.80 the temperature dependence of in the ordered phase can be described with the dependence, as shown in Fig. 7 for samples and 0.80. For the latter composition the computed gap is K.
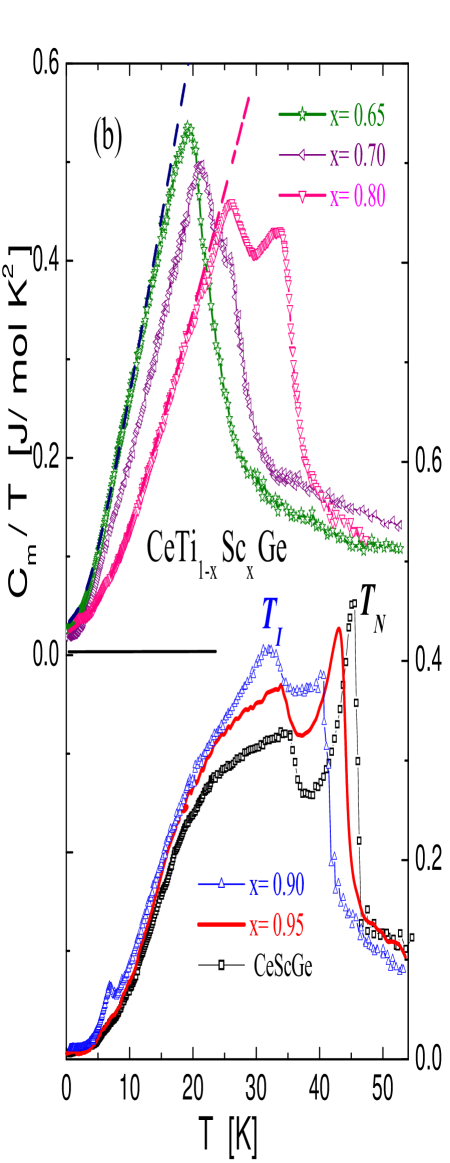
The main difference with the alloys with lower Sc concentration is the split of into two maxima, in agreement with the results. While the lower transition (at ) shows a cusp-like anomaly between and 0.9, the upper one identified as from measurements is associated to a jump in within this range of concentration. The cusp at can be related to the vicinity of the critical point accounting that in these policrystalline samples any eventual first order transition would be broadened in temperature because of the random direction distribution of crystals and some broadness in concentration. Within this range of concentration, the shape of the upper transition at is typical for a second order transition.
For , a further change in is observed as depicted in the lower part of Fig. 7. The broad shoulder of in samples can be attributed to the increase of the GS degeneracy from to 4 as the contribution of the first exited CEF doublet set on. Also the transitions change their characteristics because while the one at transforms into a step like anomaly, that at becomes sharper and grows significantly. Notice that the jump in is J mol-1K-1 is between the values expected for a doublet () and a quartet () predicted in the mean field approximation Morphol . The small anomaly observed in at K can be attributed to an extrinsic contribution of a small amount of Ce-oxide.
III Discussion
III.1 Magnetization
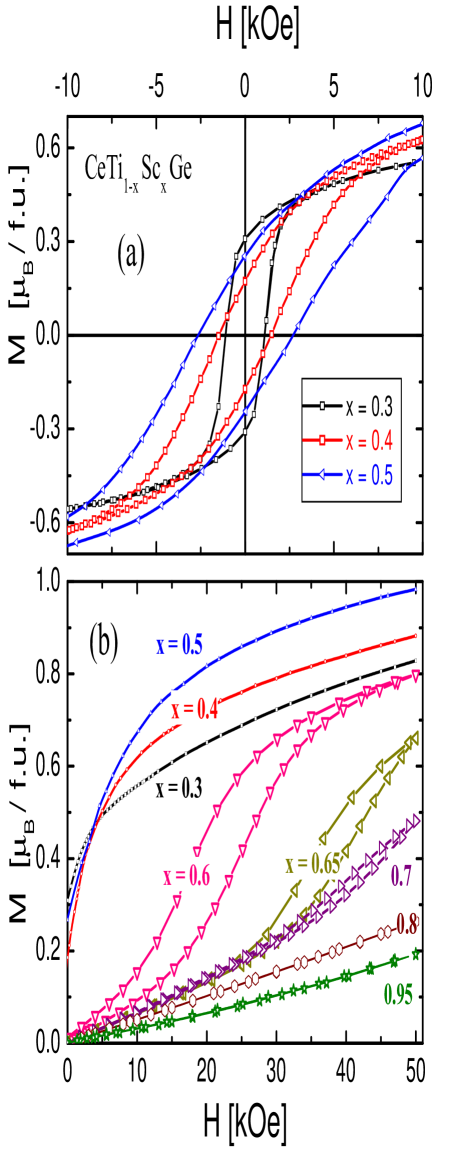
The hysteresis loops measured at K on the alloys with reveal the FM character of the ordered phase (see Fig. 8a) concomitant with the increasing value of measured at kOe presented in Fig. 8b. The saturation magnetization, extracted from Fig. 8b as , increases from for up to 1.15 for and then decreases to 1 for . Similarly, the coercive field increases from kOe for up to 2.6kOe for , whereas for a metamagnetic transition occurs. The critical field increases with concentration up to our experimental limit of kOe with an initial ratio of kOe/Sc. However measurements, performed on stoichiometric CeScGe Uwatoko ; Singh , report the metamagnetic transformation around kOe with a weak associated hysteresis. Measurements at higher magnetic field (up to 30 T Uwatoko ) reveals anothe magnetic rearrangement at kOe. Notably, the area of the hysteresis loop decreases as tends to its upper value, see Fig. 8b, and becomes quasi irrelevant at the CeScGe limit Singh .
III.2 Evaluation of the Crystal Electrical Field splitting
In order to evaluate the energy of the excited CEF levels, we have analyzed the dependence of the sample which shows the lowest ordering temperature. For that purpose we have fit the experimental data accounting that the CEF splits the six fold Hund’s rule multiplet originated in the orbital momentum of Ce into three doublets. Due to the hybridization (Kondo effect) acting on the first excited level, the standard Schottky anomaly () cannot describe the dependence properly. Since a proper fit including usual hybridization effects () between conduction and states acting on each excited level requires complex calculation protocols Aligia13 , a simple criterion to mimic the broadening of the levels was applied in this case. In this procedure the first CEF exited doublet at is described using three single Dirac levels equally distributed in energy around the nominal value of the non hybridized level. This procedure requires the strength of the hybridization to be smaller than the CEF splitting (), i.e. . For simplicity, the second excited CEF level (at ) was included without accounting for hybridization effects because largely exceeds our temperature range of analysis. The applied formula is:
| (1) |
The GS contribution was included after fitting the tail of at with an arbitrary f(a/T) function, being the total contribution to the specific heat: . In the inset of Fig. 6 the result of this fit to the experimental data is shown, including the detail of the function. The obtained parameters are K and K, with a broadening of the first CEF level K. This procedure was checked with the evaluation of the magnetic entropy (), which for the two excited doublets reaches .
This procedure cannot be applied for higher Sc concentrations because of the increase of . Although no significant changes are expected in the CEF levels splittings, the reduction of the electrical charges in the transition metal crystal sites from rich Ti [Ar4s23d2] to Sc [Ar4s23d1] may reduce the strength of the CEF and reduce the . This variation may be at the origin of the increasing contribution of the first excited CEF level to the magnetic ordering.
III.3 Entropy
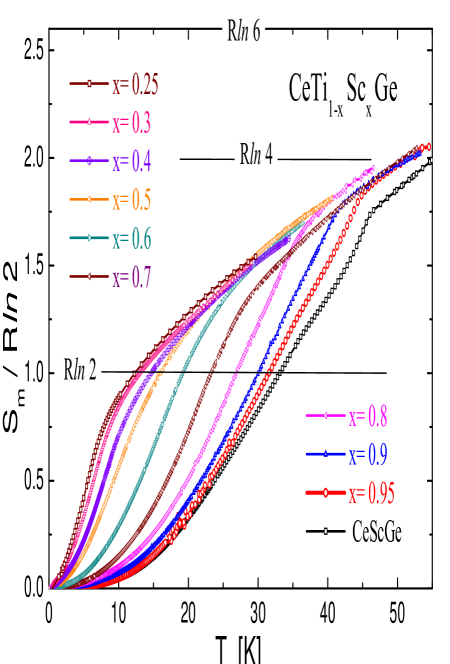
The analysis of the thermal evolution of the magnetic contribution to the entropy is shown in Fig. 9 normalized by the value of a Kramer’s doublet level: . This parameter provides relevant information to understand this magnetically complex system better.
The alloy with the lowest ordering temperature at K reaches slightly above , at K, suggesting that only the GS doublet contributes to the magnetic order. However, since in the paramagnetic phase increases continuously (i.e. without showing any plateau around ) one may infer that the tail of the first excited CEF level also contributes to the entropy at low temperature. This fact confirms the CEF level spectrum extracted from the fit of performed on this, presented in the inset of Fig. 6.
Although the contribution of that level may be marginal in the alloys with low Sc content, it becomes significant for higher concentrations as increases with . This feature becomes evident for alloys, where clearly exceeds and, for practically reaches the value for two doublets, i.e. , in agreement with the corresponding value observed in .
The comparison of the thermal distribution of the entropy above and below also provides a hint for the effective dimensionality of the magnetic system. According the theoretic predictions ProgPhys , in two dimensional (2D) systems, the entropy accumulated between and is similar to that contained in the tail of . In this case, samples with Sc concentration fulfil that property once the contribution is subtracted. Such is not the case for the samples beyond the critical point for which the transition shows the characteristic jump of a 3D second order transition.
III.4 Magnetic phase diagram
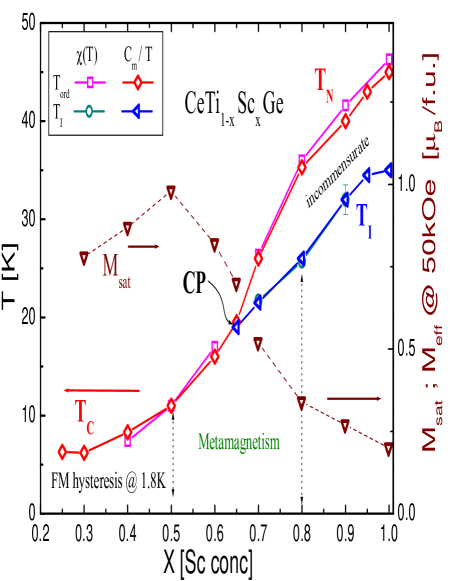
The main parameters of this system are collected in the magnetic phase diagram presented in Fig. 10. The most relevant feature is the critical point CP determined at , where an intermediate phase sets in between the and phase boundaries. On both sides of that CP two different regions were identified. Below , a change in the GS magnetic properties is observed around between a FM GS (determined by hysteresis loops of Fig. 8a) and the region where a metamagnetic transition arises in the field dependence of the magnetization. In this region () a critical field () of the spin flip increases proportionally to Sc content up to the limit of our applicable magnetic field of kOe.
The saturation magnetization extrapolated from Fig. 8b reaches a maximum value at . These values are compared in Fig. 10 with those obtained from (kOe) at K of samples with , that keep decreasing. Despite of the weakening of the magnetic moments with Sc concentration, rises continuously up to . According to the literature DeLong91 , this behavior is observed in itinerant systems where SDW develops, in agreement with the anomaly detected at in alloys.
IV Conclusions
The main characteristic of this system is the rapid variation of the magnetic nature of its ordered phase with Sc concentration, likely due to an increasing role of the first excited CEF doublet into the GS properties. An encompassing description for this peculiar system can be proposed as follows:
i) between and 0.5, the local moments order FM with intra-planes interaction involving two consecutive Ce planes that maximizes the value. Within this range of concentration, the comparison of the entropy distribution above and below suggests a 2D magnetic character ProgPhys .
ii) Around , the first excited CEF level becomes more relevant in the definition of the magnetic GS properties, being responsible for the change from FM to a AFM character of the magnetic structure. Nevertheless, such a nearly continuous variation indicates that both configurations are quite close in energy as confirmed by the metamagnetic transitions. Coincidentally, as the AFM character arises, starts to decrease.
iii) The most significant modification of the GS properties occurs at the critical point at . Beyond this concentration, the phase transition at looks more likely one of second order type in a 3D context induced by the onset of an AF interaction inter-planes. An intermediate phase arises below with evidences for an incommensurate spin density wave character. The evolution of the specific heat anomaly at the transition suggests a small discontinuity in the magnetic wave vector. These observation coincide with the fact that the transition at is hardly seen in measurements because of the small change produced in the AFM structure.
iv) For the anomaly at becomes even weaker transforming into a second order type whereas the upper one increases up to rich a jump expected for a four fold degenerate state . The itinerant character of this magnetic GS is suggested by the anomaly in the dependence at and the reduced value of the magnetic moment compared with the extremely high ordering temperature as it occurs in many U compounds DeLong91 .
In conclusion, this work provides experimental evidences for this peculiar system that undergoes a complex transformation in its GS magnetic properties associated to an increasing contribution of the first excited CEF level. Beyond a critical point, the formation of a quasiquartet enhances the exchange interaction between Ce-planes with the consequent growth of the ordering temperature. Similar behavior was recently observed in CeCoSi under pressure showing a high temperature magnetic order also attributed to a quasiquartet level formation CeCoSi . This facts are ascribed into a scenario of a change in the magnetic dimensionality from 2D type to 3D and the appearance of spin density waves with incommensurate wave vector.
References
- (1) CMN unit formula = Ce2Mg2(NO3)12.24H2O; see for example R.A. Fisher, E.W. Hornung, G.E. Brodale, W.F. Giauque; J. Che,m.Phys. 58 (1973) 5584.
- (2) S.K. Malik, R. Vijayaraghavan, W.E. Wallace; J. Magn. Magn. Mat. 37 (1983) 303.
- (3) see for example E. Bauer; Adv. Phys. 40 (1991) 417.
- (4) J.G. Sereni, in Handbook Phys Chem of Rare Earths, Vol 15, Eds. K. Gschneidner and L. Eyring, Elsevier Science Pub., Ch. 98, 1991 and J. Phys. Soc. Jpn, 67 (1998) 1767.
- (5) J.G. Sereni, Phil. Mag. 93 (2013) 409-433.
- (6) L.E. De Long, J.F. Huber, K.S. Bedell, J. Magn. Magn. Mat. 99 (1991) 171.
- (7) C Godard, L C Gupta, M F Ravet-Krill, J. Less Comm. Met. 94 (1983) 187.
- (8) see for example S. Kawarazaki, M. Sato, Y. Miyako, N. Chigusa, K. Watanabe K, Metoki N, Y. Koike, M. Nishi, Phys. Rev. B 61 (2000) 4167.
- (9) S. Kawarazaki, Y. Kobashi, J.A. Fernandez-Baca, S. Murayama, Y. Önuki and Y. Miyako, Physica B 206-207 (1995) 298.
- (10) R. Settai, A. Misawa, S. Araki, M.Koski, K. Sigiyama, T. Takeuchi, K. Kindo, Y. Haga, E. Yamamamoto and Y Önuki , J Phys. Soc. Japan 66 (1997) 2260.
- (11) A.R. Mackintosh, Physica B 130 (1985) 112.
- (12) P.C. Canfield,J.D. thompson and Z. Fisk; J. Appl. Phys. 70 (1991) 5992.
- (13) T. Gruner, N. Caroca-Canales, O. Stocker, M.M. Koza, J. Sereni, U. Burkhard, C. Geibel; to be published.
- (14) Y. Uwatoko, T. Ishii, G. Oomi, H. Takahashi, N. Môri, S. Nimori, G. Kido, J.L. Serrao, D. Mandrus, Z. Fisk, J.D. Thompson; Physica B 237-238 (1997) 207.
- (15) S. Singh, S.K. Dhar, C. Mitra, P. Paulose, P. Mainfrinetti, A. Palenzona; J. Phys.: Condens. Matter 13 (2001) 3753.
- (16) M.A. Romero, A.A. Aligia, G.L. Nieva and J.G. Sereni; J. Phys. Condens Matter, 26 (2014) 025602.
- (17) See for example: C.Domb and A.R. Miedema, Prog. Low Temp. Phys., Ed. CJ. Gorter (North Holland) 1964 Ch. VI, p.300.
- (18) See for example: P.H. Meijer, J.H. Colwell, B.P. Shah, Am. Jour. Phys., 41 (1973) 332.
- (19) E. Lengyel, M. Nicklas, N. Caroca-Canales, C. Geibel; Phys. Rev. B 88 (2013) 155137.