Surface charge and hydrodynamic coefficient measurements of Bacillus subtilis spore by Optical Tweezers
Abstract
In this work we report on the simultaneous measurement of the hydrodynamic coefficient and the electric charge of single Bacillus subtilis spores. The latter has great importance in protein binding to spores and in the adhesion of spores onto surfaces. The charge and the hydrodynamic coefficient were measured by an accurate procedure based on the analysis of the motion of single spores confined by an optical trap. The technique has been validated using charged spherical polystyrene beads. The excellent agreement of our results with the expected values demonstrates the quality of our procedure. We measured the charge of spores of B. subtilis purified from a wild type strain and from two isogenic mutants characterized by an altered spore surface. Our technique is able to discriminate the three spore types used, by their charge and by their hydrodynamic coefficient which is related to the hydrophobic properties of the spore surface.
keywords:
B.Subtilis , spore , electric charge , hydrodynamic coefficient , optical tweezers1 INTRODUCTION
The electrostatic interaction among charged colloids or among colloids and surfaces is one of fundamental issues in condensed matter physics. For instance, the electrostatic interactions between charged microparticles determine the stability of colloidal dispersions and particle aggregation. In biology, these electrostatic forces are crucial for the interpretation of ion adsorption and ion permeation processes as well as in adhesion processes of bacteria and bacterial spores onto surfaces. These processes are the base of a variety of phenomena ranging from the development of new biomaterials for biomedical application to the prevention of food contamination by bacterial biofilms and to the delivery of drugs and antigens to human mucosal surfaces [1]. In this context the adhesion of bacterial spores to surfaces is of particular interest for at least two reasons: (i) decontamination of spores during the industrial food chain (from food preparation to packaging) and (ii) use of spores as a platform to deliver drugs and antigens to the human mucosal surfaces.
Spores are metabolically quiescent cells, extremely resistant to harsh environmental conditions. Spore resistance to extreme con- ditions is due to their structure characterized by a dehydrated cytoplasm surrounded by several protective layers: the thick cortex formed of peptidoglycan, a multilayered coat mostly formed by proteins and the recently identified crust, formed of proteins and glycoproteins [2]. Because of their resistance to thermal and chemical treatments treatments spores cannot be efficiently removed by standard procedures. In the presence of water and organic molecules spores germinate originating cells able to grow and compromise the quality and safety of food products. Understanding the physicochemical nature of the interaction between spores and surface could probably lead to the use of more appropriate decontamination procedures. The resistance properties of spores, together with the safety record of several spore-formers species, is also the base for considering them as a mucosal delivery system [1]. Also in this case, a detailed knowledge of the surface properties of spores would help to rationalize the display of drugs and antigens on the spore surface [3, 4, 5].
The interaction potential between colloids and between colloids and surfaces is intensively discussed in literature and remains a challenge for both experiment and theory. Despite its limitations, the Derjaguin-Landau- Verwey-Overbeek (DLVO) theory [6] describes very well the interaction between charged colloids in aqueous salt solutions.
Therefore the charge carried by a single colloid or biological object is a very relevant parameter to be measured. Usually this can be done by measuring the electrophoretic mobility , that is defined as the ratio of the velocity of a charged particle over the applied electric field strength i.e. . The zeta potential () is the electrokinetic potential measured at the slipping plane in the double layer and is related to the electrophoretic mobility by the relation: , being the viscosity of the fluid and and the dielectric constant and the absolute permittivity of vacuum, respectively. Therefore the knowledge of these associated parameters is of fundamental importance to characterise a colloidal system. Commercial instruments, Zetasizers, are today available to measure the electrophoretic mobility of microscopic particles and, consequently, the zeta potential. These instruments are based on Laser Doppler Velocimetry (LDV) and Phase Analysis Light Scattering (PALS) techniques. Nevertheless these instruments give ensemble averaged results which have been reported to be dependent on the particle concentration [7] and are not adequate when the shape of particles differs significantly from that of a sphere as in the case of the bacterial spores investigated in this work.
In the last three decades, optical tweezers [8, 9] (OT), have revealed as a formidable tool in many areas of science. In particular, they have been used to shed light in colloidal physics for their ability to manipulate single particles. They are based on a strongly focussed laser beam that exerts a restoring force on a microscopic dielectric particle close to the focal point. In such a way the trapped particle results to be confined in an optical potential that can be considered with a good approximation harmonic. So far, the restoring force is elastic: , being the stiffness of the optical trap and the displacement from the laser focus. Optical Tweezers in combination with a nanometre resolution position detection technique [10] represent a very sensitive force transducer allowing the measurement of forces from hundredths of pN down to few fN [11, 12] . In particular, recent experiments have demonstrated the possibility to measure electrophoretic mobility of single colloids in polar and non polar fluids [13, 14, 15] .
Here we show how to extend these techniques to the case of single bacterial spore dispersed in water. In particular we demonstrate that our technique is able to measure, simultaneously, the hydrodynamic coefficient and the electric charge of single particles with arbitrary shape. In this experiment we used bacterial spores that, at first approximation, can be considered of ellipsoidal shape and with a complex surface. The only requirement of our technique is that the confined thermal motion of the trapped object is purely translational. When this condition is fulfilled the hydrodynamic coefficient and the electric charge can be measured in a fast, reliable and precise way.
In addition we demonstrate the possibility to discriminate genetically modified bacillus spores from their surface charge. Our method is also able to estimate the hydrodynamic factor of wild type and mutants spores. This could open the possibility to measure the degree of hydrophobicity of spores in different environmental conditions.
2 Theory
The motion of a charged particle of diameter and mass subjected to a restoring force with stiffness and to an external electric field is described by the Langevin equation (here for one coordinate only):
| (1) |
where s the hydrodynamic coefficient which, for a spherical particle, is related to the medium viscosity by the relation: . is the random thermal force that drives the Brownian motion, it has the statistical properties of white noise and is defined as:
| (2) |
where is the Boltzmann constant, the absolute temperature and is the zero-mean, -correlated Gaussian white noise.
In a fluid with low Reynolds number, like water, the inertial term can be neglected since the decay time due to viscous losses is of the order of , i.e. which is much smaller than the time resolution used in this experiment (of the order of , see below).
The electric force is where is the effective charge of the particle, resulting from the screening of free ions, and the electric field strength. In this experiment we used a sinusoidal electric field , being the modulation frequency, thus Eq. (1) becomes:
| (3) |
Since this equation is linear, its solution is simply the sum of two terms : the first represents the motion of the particle in presence of the thermal motion only, while the second is due to the electric field only [14]. In particular the latter is the well known deterministic motion of a driven oscillator:
| (4) |
where is the corner frequency of the optical trap and is a constant phase lag between the particle motion and the driving field: .
It is very convenient to study this dynamics using the AutoCorrelation Function (ACF) defined as . Since the periodic electric field and the thermal motion are uncorrelated, the total autocorrelation function is, again, the sum of two autocorrelation functions: one for the thermal and another for the periodic motion induced by the electric field:
| (5) |
where is the characteristic time of the optical trap which is related to the corner frequency . Equation (5) can be written as the normalized function :
| (6) |
The particle motion can be also described in the frequency domain through its Power Spectral Density (PSD). The Wiener-Khinchin theorem states that the spectral decomposition of the autocorrelation function is given by the power spectrum of that process, therefore the PSD is given by:
| (7) |
which is the superposition of a lorentzian function related to the thermal motion and a peak at the driving frequency of the forcing electric field.
The parameter that appears in Eqs.6 and 7 is the ratio of the periodic force and the thermal force scaled by the ratio of the frequency modulation of the external field and the corner frequency of the optical trap:
| (8) |
For weak electric fields and the particle motion is dominated by the thermal fluctuation, while for strong fields and the motion is essentially periodic and the thermal fluctuations can be regarded as small perturbation. is readily obtained from the analysis of the normalized autocorrelation function and it can directly give the value of the charge carried by the trapped particle. In fact the mean square thermal force is , while that of the periodic field is . Therefore, once is determined from Eq.6 the effective charge can be deduced from the following equation:
| (9) |
The effective charge of the trapped particle is determined by experimental parameters (, ) obtained from the analysis of its motion in the optical potential well and also on the knowledge of the hydrodynamic coefficient . We remember that depends on the geometric form factor of the particle and on the viscosity of the fluid. The form factor is well known for spherical particles and it is equal to . For ellipsoidal particles that move along one of their principal axes the geometric form factors are equal to those of a sphere multiplied by a correction coefficient [16, 17]. In the specific case of an ellipsoid with equal short axes the coefficients are:
| (10) |
being the aspect ratio of the ellipsoid ( with and the long and short diameters). Unfortunately for biological particles, like bacterial spores, the hydrodynamic coefficient is unknown and, as we will show below, the approximation to particles with similar shape (mostly ellipsoidal) fails. Therefore to overcome this issue, it is necessary to measure the hydrodynamic factor directly.
In OT the position of the trapped particle is measured with a quadrant photodiode using the forward light scattering detection technique [10, 18, 19]. The output signal of the QPD should be converted in meter units (conversion factor ). Usually from the analysis the thermal contribution of the auto correlation function or, equivalently, of the PSD (see Eq. (6) and 7) the conversion factor is easily obtained provided is a known quantity, i.e. the viscosity of the medium and the form factor are known [10, 18, 19] .
However it is possible to measure the conversion factor and the hydrodynamic coefficient of a trapped particle simultaneously. The method is based on the measurement of the dynamics of a trapped particle when the fluid surrounding the particle is moved in a periodic way [20]. This problem is formally identical to the case, discussed above, of a particle driven by an external periodic electric field. The motion of the particle is, again, the linear superposition of the Brownian thermal diffusion with the deterministic motion due to the dragging of the oscillating fluid.
Again, this oscillation results in a cosinusoidal component in the ACF or, equivalently, in a sharp peak in the PSD. The signal power under this peak can be evaluated theoretically and results equal to:
| (11) |
where is the amplitude of the fluid periodic motion, measured in meter and the modulation frequency of the fluid. Since can be measured () the conversion factor is, therefore, determined by the square root of their ratio:
| (12) |
Once has been determined, the hydrodynamic coefficient is straightforwardly calculated from the amplitude of the experimental power spectral density , by the following equation:
| (13) |
and the corner frequency are easily obtained from a fitting of the PSD itself. Therefore it is possible to measure the hydrodynamic coefficient directly without any information on the size and geometrical form of the trapped particle. The only assumption required is that the motion of particle should be only translational, i.e. the particle should not rotate. This condition is fulfilled for the case of the bacterial spores used in this experiment as shown below.
3 Materials and Methods
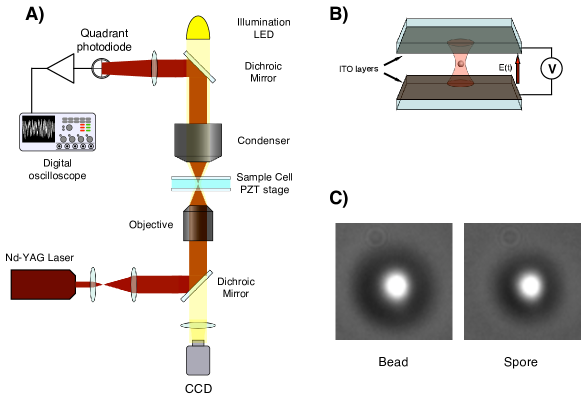
The experimental setup (schematically shown in Fig.1) consists of an optical tweezers build on a high-stability home-made optical microscope equipped with a high-numerical-aperture water-immersion objective lens (Olympus, UPLAPO60XW3, NA=1.2). The optical trap is generated by a frequency and amplitude stabilized Nd-YAG laser (, maximum output power, Innolight Mephisto) [21] . The laser beam was expanded to a final diameter of 10 mm to have a proper overfilling of the back aperture of the objective lens. The laser power was precisely regulated rotating a half-wave-plate before a polarizer. To minimize external noise, the experimental setup was mounted on a passive vibration isolation optical table. Moreover, the laser paths were kept as short as possible to avoid pointing fluctuations and the laser beam was enclosed in plastic pipes wherever possible. Finally, the whole setup was enclosed in a thermal and acoustic insulated box to prevent air circulation and temperature drifts and to avoid heating, a white cold LED was used to illuminate the sample. The temperature inside the box was continuously monitored, during each set of measurements the temperature fluctuations were within 0.2 .
The 3D position of the trapped particle was monitored through the forward scattered light [10] imaged onto an InGaAs Quadrant Photodiode (QPD, Hamamatsu G6849) at the back focal plane of the condenser lens.
For movements in the plane (x,y) perpendicular to the beam propagation axis (z) the QPD-response was linear for displacements up to with resolution. The z position is measured following the variations of the total laser intensity measured at the back focal plane of the condenser. For small displacements the laser intensity is a monotonic function of the axial particle position. Since the laser intensity was very stable ( 0.1 % rms) it was not necessary to normalize the three output signals by the intensity at the back focal plane. Output signals from the quadrant photodiode were acquired for 20 s at 50 kHz using a digital oscilloscope (Tektronix TDS5034B), then data were sent to a computer for further analysis.
We used negatively charged sulfate coated polystyrene micro-spheres (Postnova, density, 1.65 refractive index) with a diameter of . Particles were diluted in distilled deionized water to a final concentration of a few particles/. The surface charge density, provided by the manufacturer, was 5.7 that corresponds to a total charge of -1.79 C.
The spores used in this experiment were purified from a standard laboratory strain of B. subtilis (PY79) and from isogenic mutants carrying null mutations in the cotE (cotE::cm) [22] or in the cotH (cotH::spc) [23] gene.
After 30 h of growth in Difco Sporulation medium (DSM) at with vigorous shaking, spores were harvested, washed three times with distilled water and purified by gastrografin gradient as described in ref.s [24, 25, 4] . Spore counts were determined by serial dilution and plate-counting. Spores were diluted to a final concentration of about 50100 spores/ immediately before use to prevent adhesion to vial surface and loaded into the sample cell.
Before starting every measurement, sulfate polystyrene beads or spores were dispersed in fresh milli-Q water at pH=6.5. After dilution we found about 1-5 spores/beads in the field of view of our microscope. A droplet of such solution () was placed inside a sample chamber made of a -thick coverslip and a microscope slide, both coated with ITO (Indium-Tin-Oxide) that act as planar electrodes. The sample cell was mounted on a closed-loop piezoelectric stage (Physik Instrumente PI-517.3CL), which allows movements with nanometer resolution.
Since the experiment was performed in water which is a polar fluid it was necessary to evaluate the effects of the free ions. The first and the most relevant effect is the polarization of the electrodes due to the screening of the counterions. When a voltage difference is applied to the electrodes, the free ions present in the fluid are attracted toward them. The result is that ions screen the charge accumulated on the electrodes by the external voltage supply and the electric field between them vanishes. A simple way to avoid this effect is to use alternating electric field. However due to the finite drift velocity of free ions, there is a dependence on the frequency of the alternating field: increasing the frequency the screening effect reduces since the free ions cannot reach the electrodes within half the time period, i.e. before inverting their motion, so the response of the charged particle increases accordingly. Nevertheless after a certain value of the frequency the response starts to decrease because the particle cannot follow the oscillating driving field due to the viscosity of medium (the viscous medium acts like a low pass filter for the particle motion).
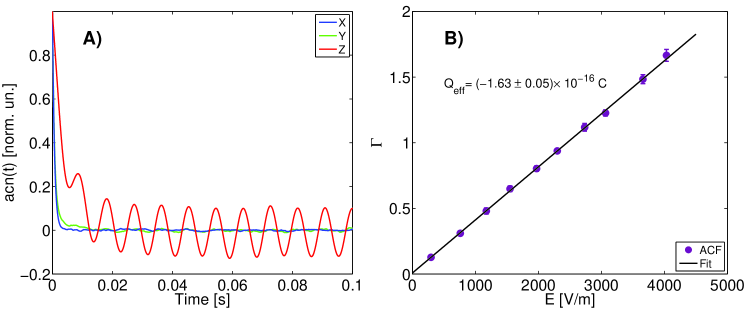
In this experiment, we chose a modulation frequency which optimize the response of the trapped particle to the external field (for more details see [26]). A typical autocorrelation function for the three axis is shown in Fig.2A, it is clearly visible the high signal to noise ratio achievable and that the oscillation of the particle occurs only along the z-axis where the uniform electric field was applied. From a fit of the cosinusoidal part of the autocorrelation function we measured the force ratio . The behavior of the force ratio with the amplitude of the applied electric field is shown in Fig.2B. The data were fitted with a straight line whose slope is the ratio , then using Eq. (9) we can evaluate the value of the effective charge of the polystyrene bead. The effective charge found was , that compared to the value declared by the manufacturer () denotes that the condensation of free ions on the bead surface reduces the total charge of about one thousand times. The linear behavior of as function of the applied strength confirms that the charge is constant, i.e. the applied electric field doesn’t affect it even if becomes greater than one where the electrophoretic force begins to dominate over the thermal force.
4 Results and Discussion
4.1 Measurement of the hydrodynamic coefficient of bacterial spores
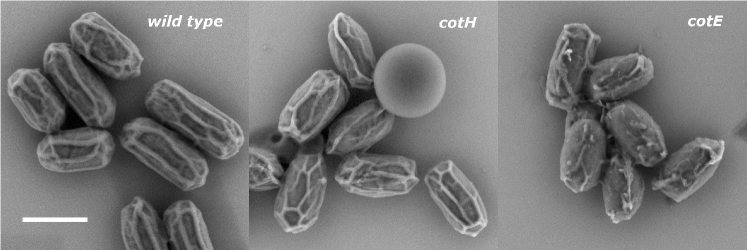
Figure 3 shows a SEM image of the three spore types, used in this experiment, dried on a silicon substrate. The spores are similar in shape and their size is quite heterogeneous. They have a quasi-elliptical shapes but the surface is not smooth. The three spore types used in this study are all isogenic to the wild type strain PY79 but lack either the cotE (BZ213) or the cotH (ER220) gene because of gene replacements [22, 23]. As a consequence, spores of strain BZ213 totally lack the outer coat layer [22] while those of strain ER220 have a strongly defective coat, with several deviations with respect to the wild type at both the outer and inner coat levels [27]. Based on these differences it is not surprising that length and width, measured from SEM images for a large number of spores (N100) of each strain, varies between the three spore types with the PY79 (wild type) being the largest and the BZ213 (cotE) the smallest (Table 1). The values obtained for wild type spores are in good agreement with those reported by Huang et al. [3].
| wild type | cotH | cotE | |
|---|---|---|---|
| 1.420.09 | 1.260.08 | 1.160.09 | |
| 0.690.03 | 0.610.03 | 0.600.04 | |
| 2.10.2 | 2.10.2 | 1.90.2 |
Spores are stably trapped by the optical tweezers and, from an optical bright light image, it seems that their major axis is aligned along the beam propagation axis (z axis) as it can be seen in Fig.1C where, for comparison, the image of a trapped microsphere is shown too. All the measurements (charge and hydrodynamic coefficient) were performed along this axis. Due to the quite large distribution of the spore sizes it was necessary to measure the hydrodynamic coefficient for each spore before evaluating its charge.
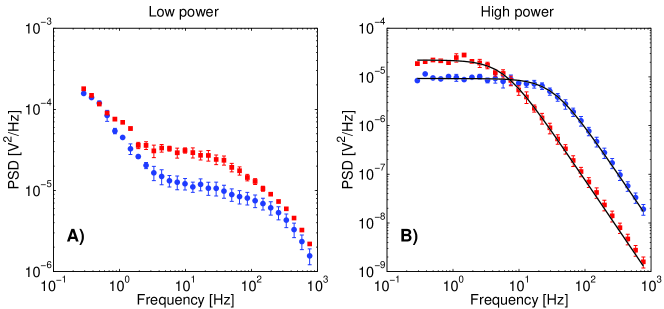
To study the spore motion inside the optical potential well we recorded the motion of a trapped wild type spore at different trapping powers. We observed that at low power the spore displaces and rotates, as can be easily seen from the shape of the PSDs in Fig.4A. In fact, the PSDs along the three axes show different relaxation frequencies due to translational, angular and cross-correlated motions [28]. Increasing the trapping laser power, we observed a reduction of the angular motion until a certain value of the power (6mW at the sample). Beyond that value, the motion was purely translational and the shape of the PSDs was a single lorentzian profile (see Fig.4B).
In this condition we have also checked for a possible presence of residual rotational effects due to the non-conservative forces always present in an optical trap. However, following the analysis described in a previous paper [29], we did not observe any evidence of these effects.
To validate the measurement procedure, we first trapped a polystyrene bead in the middle of the sample cell at a height of to avoid any influence from the walls, then we applied along the z-axis a sinusoidal oscillation to the PZT stage with amplitude nm and frequency Hz that is low enough to be sure that the fluid moves together with the stage. We recorded several trajectories of the particle position to measure and . This allowed us to check the goodness of the procedure since these two parameters can be also evaluated giving the viscosity of the water as known and extracting them from the result of a fitting of the PSD.
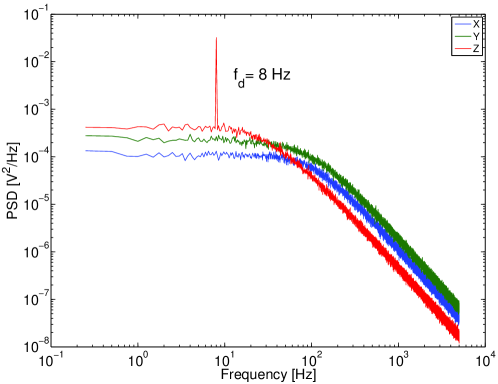
Typical PSD functions obtained from this procedure are reported in Fig.5. It is evident that the oscillation occurs only along the z-axis and is completely absent in the other directions. The very flat plateau at low frequencies shows that the system is very stable. The sharp peak, in the PSD relative to z axis, at Hz is due to the fluid oscillation and is composed by one datum. This is achieved choosing a measurement time equal to an integer multiple of the oscillation period that is . In our case s so far we recorded exactly 160 oscillation periods. The signal power is simply the area of the peak at in the PSD and since it consists of a single point it follows that where is the height of the peak datum with respect to the thermal noise plateau and is the frequency resolution of the PSD.
From the data reported above, we obtained a value of (error is the standard deviation over 20 independent recordings). The well known Stokes’ law [30] for a sphere of diameter dispersed in a fluid of viscosity gives a value of the hydrodynamic coefficient equal to , where the viscosity value of water at was [31]. The measured value is in excellent agreement with the expected value.
As further test to evaluate the precision of the procedure, we measured the hydrodynamic coefficient of 100 different beads. The ensemble average resulted: . The value is, again, in good agreement with the expected value. Nevertheless it is worth to note that the uncertainty of 15% is larger than that obtained for the single bead measurement, because of the poly-dispersion of the beads solution (8% as reported from the manufacturer), but also to other sources of noise (slow vibrations, electronics, temperature drifts). These results confirm the accuracy and the goodness of the technique.
Once the technique has been validated with spherical particles, we were allowed to measure the hydrodynamic coefficient of spores. To do that we recorded the trajectory of 100 spores and calculated the hydrodynamic coefficients. The average results for the different kinds of spores here used, are reported in Table2 (together with the value obtained for the charged PS beads for comparison). The expected values for the spores were computed considering each spore as an ellipsoidal particle with cylindrical symmetry. As discussed above, in this case, the hydrodynamic coefficient is essentially the same of a sphere with a radius equal to the minor radius of the ellipsoid multiplied by a correction factor (see Eq. (10)). For aspect ratios around 2 like those used in this experiment (see Table 1), the correction is of about 20%.
The comparison between expected and experimental values of , for the three spore types, shows very relevant discrepancies. The first result is that coefficients are all close but quite larger than the expected values. This could be ascribed to different reasons: (i) the spore surface is not smooth but rugged and very irregular as clearly visible in Fig.3, (ii) the spores shape can be only approximately considered ellipsoidal, and (iii) even if the motion is purely translational, the spore could not be perfectly aligned and the velocity field of the fluid, during the oscillatory motion, can increase the alignment further leading to an higher effective drag coefficient. More interesting results come from the comparison among investigated spores types. A first result is that the values for wild type and cotH spores (see Table 2) are similar although their minor diameters are different. In fact, despite the differences observed by TEM between PY79 and ER220 spores [27], the final shape and surface appearance of spores of these two isogenic strains seem to be very similar. This conclusion is also supported by a functional analysis of spores of the ER220 strain, phenotypically indistinguishable from the isogenic wild type for the resistance to lysozyme treatment and the induction of germination [23].
Another result is that the coefficient for cotE spores is significantly larger than the other two types of spores. This is an unexpected and very interesting result because since cotE spores have the short axis diameter smaller than wild type spores, should have a drag coefficient smaller. On the other hand, although cotE size is very close to that of cotH spores, again, their coefficient is rather larger. This suggests that other surface properties could influence the hydrodynamic behavior of spores. In fact, looking at the SEM image of Fig.3, it is clear that the surface of cotE spores is drastically different with respect to the others. In addition, the almost total removal of the outer coat in cotE spores changes the spore size, but could also change the hydrophobicity of the surface as well. A decrease of the hydrophobicity could imply an increase of the friction between the spore surface and the surrounding fluid.
| beads | wild type | cotH | cotE | |
|---|---|---|---|---|
| 9.10.5 | 9.20.9 | 9.41.6 | 123 | |
| 8.90.6 | 7.40.3 | 6.50.4 | 6.40.4 |
4.2 Charge measurement of bacterial spores
Each type of spores, used in this work, presents a certain degree of heterogeneity in shape and charge. So far, to measure their surface charge it was necessary to measure simultaneously, the force ratio and the hydrodynamic coefficient of a large number of different spores. Therefore we analysed 100 different spores for each type and polystyrene beads for comparison. For each of them we measured the hydrodynamic coefficient and the effective charge as described in the previous sections. Every particle was trapped in the middle of the sample cell height, then, while the stage was oscillating along the z axis at and we measured the hydrodynamic coefficient . Once this measurement was completed, with the stage at rest, we applied a periodic electric field at and strength to measure the force ratio and then we calculated the value of the charge. The averaged results for all the spore type are reported in Table 3 along with the values obtained for the PS bead.
| beads | wild type | cotH | cotE | |
|---|---|---|---|---|
| -1.60.4 | -0.90.1 | -1.20.1 | -1.60.4 | |
| [mV] | -24.20.8 | -30.70.9 | -28.40.7 | -34.70.8 |
The charge measured for the PS beads differs a little from that reported in the previous section. This is due to a small difference in the purity of water used in the two measurements. Moreover, these values are affected by an uncertainty larger than that obtained for a single particle measurement. This is due to the heterogeneity of the sample. Nevertheless it is interesting to note that for PS beads the uncertainty on the average measurement of is in reasonable agreement with the poly-dispersion in size reported by the manufacturer. This suggests that PS beads have a very narrow distribution in size and shape but a quite wide distribution in charge.
Looking at the charge values of spores it is clear that the two mutants, cotH and cotE have a charge larger than the wild type. This suggest that removing the protein layers the surface charge increases. In literature it is reported that the surface of B.subtilis spores consists essentially of hexosamine-peptide organised in a manner that both saccharide and peptide components are exposed [32, 33]. The hexosamine-peptide can also contain both free carboxyl and free amino groups. Therefore the total charge is determined by the balance of these oppositely charged groups. The removal of outer coat proteins could modify this balance and then the total charge of the spore, but also the hydrophobicity properties of the surface.
As further comparison we measured the zeta potential of spores and bead with a commercial instruments (Zetasizer Nano ZS, Malvern) obtaining the values reported in Table 3 at pH=6.5. For a spherical particle of radius the potential is related to the total effective charge by the following relation:
| (14) |
where is the inverse of Debye length that for pure distilled water is equal to , this relation is valid in the limit of large particles (Helmoltz-Smoluchowski limit ). Using Eq. (14) for PS beads we found which is, as expected, very close to the value obtained with our technique. It is difficult to compare the zeta potential values of spores because due to their irregular shape. An attempt can be done assuming an effective radius equal to: i) the average of the short and long radii of the spore, or ii) the long radius only. The results, in the case of wild type spore for example, are and , respectively. These values are of the same order of magnitude of that measured in this work, but not consistent with it and systematically larger. It worth to be noted that the value of zeta potential presented in this experiment are comparable to those reported in literature for the wild type spores [3, 34].
5 Conclusions
The effective charge of sulfate PS beads and of bacterial spores has been measured using optical tweezers. We have demonstrated that with this technique it is possible to discriminate between different mutants of bacterial spore by their effective charge. It is also possible to measure the hydrodynamic coefficient for particle with irregular shape, like spores, with high precision. The technique allows the study of the heterogeneities in large samples in spite of the averaged results provided by most commercial instruments like zetasizers operating with conventional electrokinetic techniques. Moreover the presented method is rapid and reliable and can be easily extended to microfluidic devices.
Acknowledgment
The authors are very grateful to Dr. Giovanni Romeo for measurements of the zeta potential.
References
References
- Cutting et al. [2009] S. F. Cutting, H. A. Hong, L. Baccigalupi, E. Ricca, Oral vaccine delivery by recombinant spore probiotics, Int. Rev. of Immunol. 28 (2009) 487–505.
- McKenney et al. [2013] P. T. McKenney, A. Driks, P. Eichenberger, The bacillus subtilis endospore: assembly and functions of the multilayered coat, Nat. Rev. Microbiol. 11 (2013) 33–44.
- Huang et al. [2010] J.-M. Huang, H. A. Hong, H. V. Tong, T. H. Hoang, A. Brisson, S. M. Cutting, Mucosal delivery of antigens using adsorption to bacterial spores, Vaccine 28 (2010) 1021–1030.
- Sirec et al. [2012] T. Sirec, A. Strazzulli, R. Isticato, M. D. Felice, M. Moracci, E. Ricca, Adsorption of beta-galactosidase of alicyclobacillus acidocaldarius on wild type and mutants spores of bacillus subtilis, Microb. Cell Fact. 11 (2012).
- Isticato et al. [2013] R. Isticato, T. Sirec, L. Treppiccione, F. Murano, M. D. Felice, M. Rossi, E. Ricca, Non-recombinant display of the b subunit of the heat labile toxin of Escherichia coli on wild type and mutant spores of Bacillus subtilis, Microb. Cell Fact. 12 (2013) 98.
- Israelachvili [2011] J. Israelachvili, Intermolecular and Surface Forces: Revised Third Edition, Elsevier Science, 2011.
- Reiber et al. [2007] H. Reiber, T. Köller, T. Palberg, F. Carrique, E. R. Reina, R. Piazza, Salt concentration and particle density dependence of electrophoretic mobilities of spherical colloids in aqueous suspension, J. Coll. Interf. Sci. 309 (2007) 315–322.
- Ashkin et al. [1986] A. Ashkin, J. Dziedzic, J. E. Bjorkholm, S. Chu, Observation of a single-beam gradient force optical trap for dielectric particles, Opt. Lett. 11 (1986) 288–290.
- Ashkin [1997] A. Ashkin, Optical trapping and manipulation of neutral particles using lasers, Proc. Natl. Acad. Sci. USA 94 (1997) 4853–60.
- Gittes and Schmidt [1998] F. Gittes, C. Schmidt, Interference model for back-focal-plane displacement detection in optical tweezers, Opt. Lett. 23 (1998) 7.
- Rohrbach [2005] A. Rohrbach, Stiffness of optical traps: quantitative agreement between experiment and electromagnetic theory, Phys. Rev. Lett. 95 (2005) 168102.
- Imparato et al. [2007] A. Imparato, L. Peliti, G. Pesce, G. Rusciano, A. Sasso, Work and heat probability distribution of an optically driven brownian particle: Theory and experiments, Phys. Rev. E 76 (2007) 050101.
- Strubbe et al. [2008] F. Strubbe, F. Beunis, K. Neyts, Detection of elementary charges on colloidal particles, Phys. Rev. Lett. 100 (2008) 218301.
- Roberts et al. [2007] G. S. Roberts, T. A. Wood, W. J. Frith, P. Bartlett, Direct measurement of the effective charge in nonpolar suspensions by optical tracking of single particles, J. Chem. Phys. 126 (2007) 194503.
- Semenov et al. [2009] I. Semenov, O. Otto, G. Stober, P. Papadopoulos, U. F. Keyser, F. Kremer, Single colloid electrophoresis, J. Colloid. Interf. Sci. 337 (2009) 260–4.
- Han et al. [2006] Y. Han, A. M. Alsayed, M. Nobili, J. Zhang, T. C. Lubensky, A. G. Yodh, Brownian motion of an ellipsoid, Science 314 (2006) 626–30.
- Han et al. [2009] Y. Han, A. Alsayed, M. Nobili, A. Yodh, Quasi-two-dimensional diffusion of single ellipsoids: Aspect ratio and confinement effects, Phys. Rev. E (2009).
- Buosciolo et al. [2004] A. Buosciolo, G. Pesce, A. Sasso, New calibration method for position detector for simultaneous measurements of force constants and local viscosity in optical tweezers, Opt. Commun. 230 (2004) 357–368.
- Berg-Sorensen and Flyvbjerg [2004] K. Berg-Sorensen, H. Flyvbjerg, Power spectrum analysis for optical tweezers, Rev. Sci. Inst. 75 (2004) 594–612.
- Tolic-Norrelykke et al. [2006] S. F. Tolic-Norrelykke, E. Schaeffer, J. Howard, F. S. Pavone, F. Juelicher, H. Flyvbjerg, Calibration of optical tweezers with positional detection in the back focal plane, Rev. Sci. Inst. 77 (2006).
- Pesce et al. [2005] G. Pesce, A. Sasso, S. Fusco, Viscosity measurements on micron-size scale using optical tweezers, Rev. Sci. Inst. 76 (2005) 115105.
- Zheng et al. [1988] L. B. Zheng, W. P. Donovan, P. C. Fitz-James, R. Losick, Gene encoding a morphogenic protein required in the assembly of the outer coat of the bacillus subtilis endospore., Gene Develop. 2 (1988) 1047–1054.
- Naclerio et al. [1996] G. Naclerio, L. Baccigalupi, R. Zilhão, M. De Felice, E. Ricca, Bacillus subtilis spore coat assembly requires coth gene expression., J. Bacteriol. 178 (1996) 4375–80.
- Nicholson and Setlow [1990] W. Nicholson, P. Setlow, Sporulation, germination and out-growth, in: C. Hardwood, S. Cutting (Eds.), Molecular biological methods for Bacillus, John Wiley and Sons, Chichester, United Kingdom, 1990, p. 391 450.
- Isticato et al. [2008] R. Isticato, A. Pelosi, R. Zilhão, L. Baccigalupi, A. O.Henriques, M. D. Felice, E. Ricca, Cotc-cotu heterodimerization during assembly of the bacillus subtilis spore coat, J. Bacteriol. 190 (2008) 1267–1275.
- Pesce et al. [2013] G. Pesce, V. Lisbino, G. Rusciano, A. Sasso, Optical manipulation of charged microparticles in polar fluids., Electrophoresis 34 (2013) 3141–3149.
- Zilhão et al. [1999] R. Zilhão, G. Naclerio, A. O. Henriques, L. Baccigalupi, C. P. Moran, E. Ricca, Assembly requirements and role of coth during spore coat formation in bacillus subtilis, J. Bacteriol. 181 (1999) 2631–2633.
- Maragò et al. [2008] O. M. Maragò, P. H. Jones, F. Bonaccorso, V. Scardaci, P. G. Gucciardi, A. G. Rozhin, A. C. Ferrari, Femtonewton force sensing with optically trapped nanotubes, Nano Letters (2008).
- Pesce et al. [2009] G. Pesce, G. Volpe, A. C. De Luca, G. Rusciano, G. Volpe, Quantitative assessment of non-conservative radiation forces in an optical trap, EPL (Europhysics Letters) (2009).
- Batchelor [1967] G. K. Batchelor, An Introduction to Fluid Dynamics, Cambridge Mathematical Library, 1967.
- Cho et al. [1999] C. Cho, J. Urquidi, S. Singh, G. Robinson, Thermal offset viscosities of liquid H2O, D2O, and T2O, J. Phys. Chem. B 103 (1999) 1991–1994.
- Douglas [1959] H. W. Douglas, Electrophoretic studies on bacteria. part 5.-interpretation of the effects of ph and ionic strength on the surface charge borne by b. subtilis spores, with some observations on other organisms, Trans. Faraday Soc. 55 (1959) 850–856.
- Kazakov et al. [2008] S. Kazakov, E. Bonvouloir, I. Gazaryan, Physicochemical characterization of natural ionic microreservoirs: Bacillus subtilis dormant spores, J. Phys. Chem. B 112 (2008) 2233–2244.
- Ahimou et al. [2001] F. Ahimou, M. Paquot, P. Jacques, P. Thonart, P. G. Rouxhet, Influence of electrical properties on the evaluation of the surface hydrophobicity of bacillus subtilis, J. Microbiol. Meth. 45 (2001) 119–26.