Deep Broadband Observations of the Distant Gamma-ray Blazar PKS 1424+240
Abstract
We present deep VERITAS observations of the blazar PKS 1424+240, along with contemporaneous Fermi Large Area Telescope, Swift X-ray Telescope and Swift UV Optical Telescope data between 2009 February 19 and 2013 June 8. This blazar resides at a redshift of , displaying a significantly attenuated gamma-ray flux above 100 GeV due to photon absorption via pair-production with the extragalactic background light. We present more than 100 hours of VERITAS observations from three years, a multiwavelength light curve and the contemporaneous spectral energy distributions. The source shows a higher flux of (2.1) ph m-2s-1 above 120 GeV in 2009 and 2011 as compared to the flux measured in 2013, corresponding to (1.02) ph m-2s-1 above 120 GeV. The measured differential very high energy (VHE; GeV) spectral indices are 3.80.3, 4.30.6 and 4.50.2 in 2009, 2011 and 2013, respectively. No significant spectral change across the observation epochs is detected. We find no evidence for variability at gamma-ray opacities of greater than , where it is postulated that any variability would be small and occur on longer than year timescales if hadronic cosmic-ray interactions with extragalactic photon fields provide a secondary VHE photon flux. The data cannot rule out such variability due to low statistics.
1 Introduction
PKS 1424+240 (VER J1427+237) is a distant very high energy (VHE; GeV) blazar at (Furniss et al., 2013). At this minimum distance, the intrinsic VHE emission is expected to be significantly absorbed by the extragalactic background light (EBL) via pair-production, (Nikishov, 1962). The absorption of VHE gamma rays by the EBL can be estimated using the model-dependent gamma-ray opacity, . The source flux, , can be estimated from the observed flux, , using the relation .
The EBL cannot be directly measured due to foreground sources. The modification of distant VHE blazar spectra has been used to estimate the spectral properties of the EBL (Aharonian et al., 2006; Albert et al., 2008), providing photon density upper limits consistent with the observational lower limits set by galaxy counts (Werner et al., 2004). Recent work has indicated that the EBL density is closer to the lower limits than the upper limits (Abramowski et al., 2013; Horns & Meyer, 2012; Ackermann et al., 2012). The distance to PKS 1424+240 makes the source ideal for studying extragalactic VHE photon propagation.
The high-energy spectral energy distribution (SED) measured in initial observations by VERITAS and the Fermi Large Area Telescope (LAT) (Acciari et al., 2010) is investigated in Furniss et al. (2013), showing an absorption-corrected spectrum suggestive of VHE spectral hardening, though not beyond the conservative spectral limitation (where ) described in, e.g., Aharonian et al. (2006).
In an effort to understand the gamma-ray emission from PKS 1424+240, we analyze deeper observations by VERITAS and LAT, including more than four times the exposure in Acciari et al. (2010) and Furniss et al. (2013). In order to minimize hardening introduced from EBL absorption corrections, we explore the gamma-ray observations using the low-density “fixed” model from Gilmore et al. (2012). This model, also providing compatible fits to LAT data in Ackermann et al. (2012), is comparable with that of Franceschini et al. (2008) used in Abramowski et al. (2013), and provides similar absorption-corrections as compared to other EBL models, e.g. Kneiske & Dole (2010); Domínguez et al. (2011); Finke et al. (2010). Luminosities calculated in this work use a H0 = 100 km s-1Mpc-1 where = 0.7.
2 Observations and Results
2.1 VERITAS
VERITAS comprises four imaging atmospheric Cherenkov telescopes and is sensitive to gamma rays between 100 GeV and 30 TeV (Holder et al., 2006). The VERITAS observations of PKS 1424+240 were performed during three years. The first season (MJD 54881-55003) provides 28 hours of quality-selected livetime and is reanalyzed here, showing results consistent with those reported in Acciari et al. (2010). The second season encompasses 14 quality-selected hours of observation between MJD 55598 and 55711, while the third season includes data spanning MJD 56334 to 56447, and provide 67 hours of quality-selected livetime with a low threshold of 100 GeV, enabled by a camera upgrade in 2012.
The observations were taken at 0.5∘ offset in each of the four cardinal directions to enable simultaneous background estimation using the reflected-region method (Fomin et al., 1994). The recorded shower images are parameterized by their principal moments. Selection criteria are applied to the values of mean scaled width (MSW), and mean scaled length (MSL), apparent altitude of the maximum Cherenkov emission (shower maximum), and , the angular distance between the position of PKS 1424+240 and the reconstructed origin of the event, giving an efficient suppression of the far more abundant cosmic-ray background. The cuts applied to all data are MSW1.1, MSL1.3, shower maximum 7 km, and . These cuts were optimized a priori to yield the highest sensitivity for a soft () source with 5% of the Crab Nebula gamma-ray flux.111Flux calculated according to Albert et al. (2008). These cuts are different from those in Acciari et al. (2010) because of improvements in the analysis software and detector simulation. The results are independently reproduced with two analysis packages (Cogan, 2008; Prokoph, 2013) and are summarized in Table 1. The same analysis was applied to data from the Crab Nebula for each season, providing compatible flux and spectral results with no evidence of an energy bias shift after the camera upgrade. In particular, the integrated fluxes measured above 200 GeV agree to 11% or better (1 confidence). The systematic uncertainty on the flux for a soft source like PKS 1424+240 is estimated at and is regarded as constant for each of the observing periods.
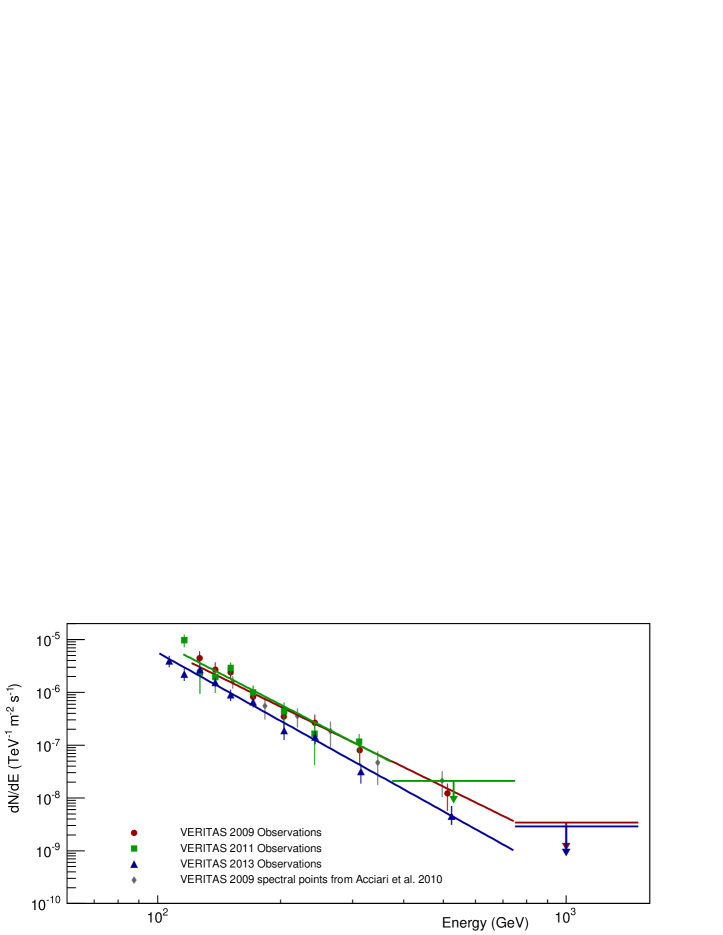
The 2009 and 2011 observations show the source to have a flux of 4.6% of the Crab flux above 120 GeV, with indices of =3.80.3 and 4.30.3, respectively. The longer exposures obtained in 2009 and 2013 allow for the the reconstruction of a significant spectral point in a higher energy bin than is possible with the 2011 data (see Figure 1). In an attempt to minimize a bias in the final spectral bin width, the energy binning is systematically determined, starting at 100 GeV with bins of equal logarithmic width, initially corresponding to 15 GeV. The first bin that does not provide sufficient statistics for a spectral point ( standard deviations; ), is doubled in width compared to the preceding bin size. This wider bin is then utilized in the analysis to derive higher energy spectral points. The first instance where the doubling procedure does not provide a significant detection is reported with a 99% confidence level upper limit (Rolke et al., 2005), assuming the same spectral index that fit to the preceding bins. The spectral points are given at the energy corresponding to the event-weighted average in the bin. For the last bin, with bin edges 375 GeV and 750 GeV, the weighted average corresponds to 510 GeV.
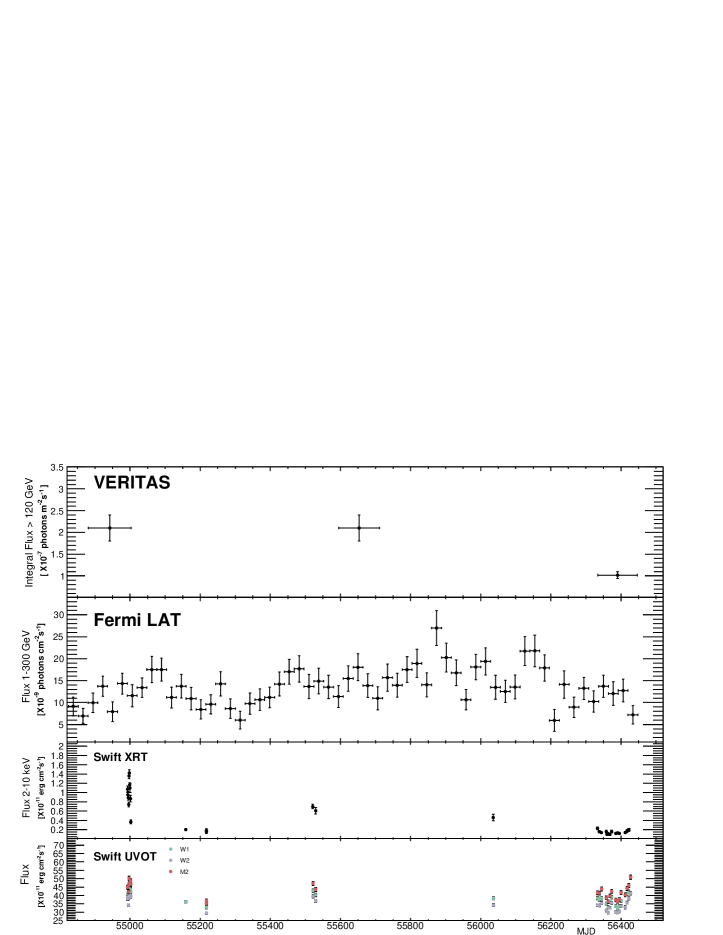
During the 2013 observations the source was in a dimmer VHE state of 2.2% Crab above 120 GeV (see Figure 1). The VHE spectral index does not appear to change during this low state, displaying an index of . The observations over each season are shown in the top panel of the light curve (Figure 2). The 2009 and 2013 observations show different states, with integral flux values above 120 GeV of (2.10.3)ph m-2 s-1 and (1.020.08)ph m-2 s-1, respectively. Additionally, a constant fit to the VHE light curve shows less than probability of a steady flux ( with 2 degrees of freedom; DOF). A search for variability above an opacity of (corresponding to 310 GeV according to the Gilmore et al. 2012 EBL model) does not provide significant evidence of variability given the very limited statistics at high energies, with integral flux values above 310 GeV of m-2 s-1 for 2009/2011 combined data and m-2 s-1 for 2013 data.
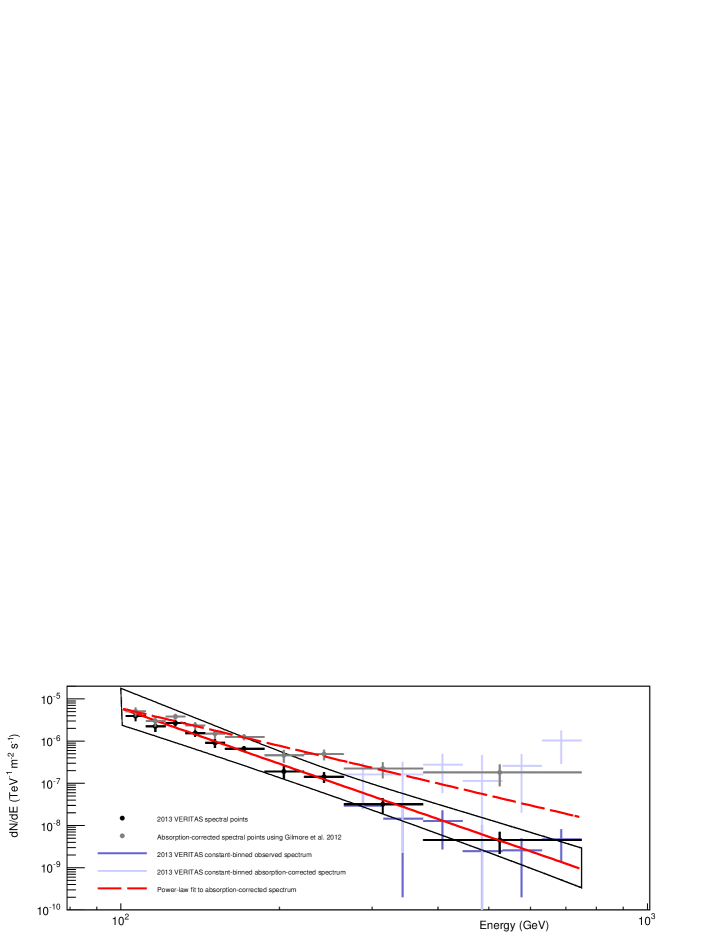
The power-law fit to the 2013 data is shown in Figure 3 with an envelope representing a 40% systematic error on the flux convolved with a systematic error on the index of 0.3. The data are corrected for absorption by the EBL assuming the model from Gilmore et al. (2012) at the minimum redshift of , resulting in a power-law fit (/DOF=9.1/9, probability of 0.428) with index =3.00.4. The 2009 absorption-corrected data provide a power-law fit with =2.80.7 (/DOF=4.7/6, probability of 0.583). As a consistency check, the data are also shown in Figure 3 with constant binning above 250 GeV. None of the individual points above 400 GeV are statistically significant in this representation.
2.2 Fermi LAT
The Fermi LAT is a pair-conversion telescope sensitive to photons between 20 MeV and several hundred GeV (Atwood et al., 2009). PKS 1424+240 is a bright gamma-ray source first reported in Abdo et al. (2009). Multiple epochs of LAT data are analyzed, including the complete Fermi LAT dataset up to the time of analysis (MJD 54682 to 56452) and time intervals selected to be contemporaneous with the VERITAS observations, summarized in Table 1. The spectral parameters for the contemporaneous data are calculated using the unbinned maximum-likelihood method implemented in the LAT ScienceTools software package version v9r31p1, available from the Fermi Science Support Center. The spectral parameters for the full dataset are calculated using the binned maximum-likelihood method. Only events from the “source” class with energy above 100 MeV within a 12∘ radius of PKS 1424+240 with a zenith angle of and detected when the spacecraft rocking angle was are used. All sources within 12∘ of the central source in the second LAT catalog (2FGL, Nolan et al. 2012) are included in the model. The normalizations of the components were allowed to vary freely during the spectral point fitting, which was performed using the instrument response function P7SOURCE_V6. The Galactic diffuse emission and an isotropic component, which is the sum of the extragalactic diffuse gamma-ray emission and the residual charged particle background, are modeled using the recommended files.222The files used were gal_2yearp7v6_v0.fits for the Galactic diffuse and iso_p7v6source.txt for the isotropic diffuse component available at http://fermi.gsfc.nasa.gov/ssc/data/access/lat/BackgroundModels.html. The flux systematic uncertainty is estimated as approximately at MeV and under at GeV and above.
The data are fit with power-law models for each of three contemporaneous epochs in 2009, 2011 and 2013, showing no significant variations (see Table 1). The three epochs were also combined (referred to as “Contemp.” in Table 1) and fit with a power law. Additionally, an extended LAT data set (MJD 54682 to 56452) is analyzed using the binned-likelihood method. The larger dataset is fit with a curved log-parabolic model including EBL absorption with the Gilmore et al. (2012) EBL model, since there is a significant (TS; Mattox et al. 1996) detection up to 300 GeV. The contemporaneous 2009 and 2013 data are shown in Figure 4.
The data above 1 GeV are also analyzed in 28-day bins (see Figure 2). This light curve displays variability, with a probability of of being steady (=159.7 with 57 DOF). However, a search for variability above 10 GeV using the Bayesian Block method from Scargle et al. (2013) with 1% specified as the acceptable fraction of false positives shows no evidence of variability, in agreement with the lack of significant variability found above 10 GeV in the Fermi LAT hard sources catalog (1FHL; Ackermann et al. 2013).
2.3 Swift XRT
The X-ray Telescope (XRT) onboard the Swift satellite (Gehrels et al., 2004) is a focusing X-ray telescope sensitive to photons with energy between 0.2 and 10 keV. Thirty observations of PKS 1424+240 summing to 51 ks have been collected between 2009 June 11 and 2013 May 10 (MJD 54993 and 56422), inclusive. Observations were taken in photon counting mode with the count rate ranging from 0.1 to 1.1 counts per second. Pile-up effects are accounted for when the count rate exceeds 0.5 counts per second using an annular source region, with a 1-2 pixel inner radius and a 20 pixel outer radius. The data are analyzed as described in Burrows et al. (2005) with HEASOFT 6.9 and XSPEC version 12.6.0.
For spectral fitting, the photons are grouped by energy to require a minimum of 20 counts per bin, and fit with an absorbed power law (tbabs(po)) between 0.3 and 10 keV, fixing the neutral hydrogen column density to cm-2, as quoted in Kalberla et al. (2005). The data are also fit with an absorbed log-parabolic model (tbabs(logpar)), finding curvature parameters consistent with zero. Due to the lack of curvature, we only discuss the power-law fitted parameters here.
The 210 keV integral flux values are derived for each observation and shown in Figure 2. The X-ray light curve is clearly variable, with a constant fit giving a of 2200 for 30 DOF. X-ray energy spectra are extracted for the highest and lowest states (from MJD 54997 and 56368, respectively). The high and low flux states differ by a factor of and have photon indices of and , respectively. These X-ray states correspond to 210 keV rest frame luminosities of at least erg s-1 and erg s-1, respectively, assuming . In order to represent the intrinsically emitted SED, the spectra corrected for the column density absorption are shown in Figure 4.
2.4 Swift UVOT
Swift-UVOT exposures were taken with UVW1, UVM2, and UVW2 filters (Poole et al., 2008). The UVOT photometry is performed using HEASoft uvotsource. The circular source region has a radius and the background region consists of several 15 radii circles of nearby empty sky. The results are reddening-corrected using the E(B-V) coefficients in Schlegel et al. (1998). The Galactic extinction coefficients are applied according to Fitzpatrick (1999). The uncertainty in the reddening E(B-V) is the largest source of error. The UV light curve is shown in Figure 2, with the UV flux values corresponding to the high and low X-ray states plotted in Figure 4. UV variability is apparent, with a pattern similar to the X-ray band.
3 Absorption-corrected Broadband SED
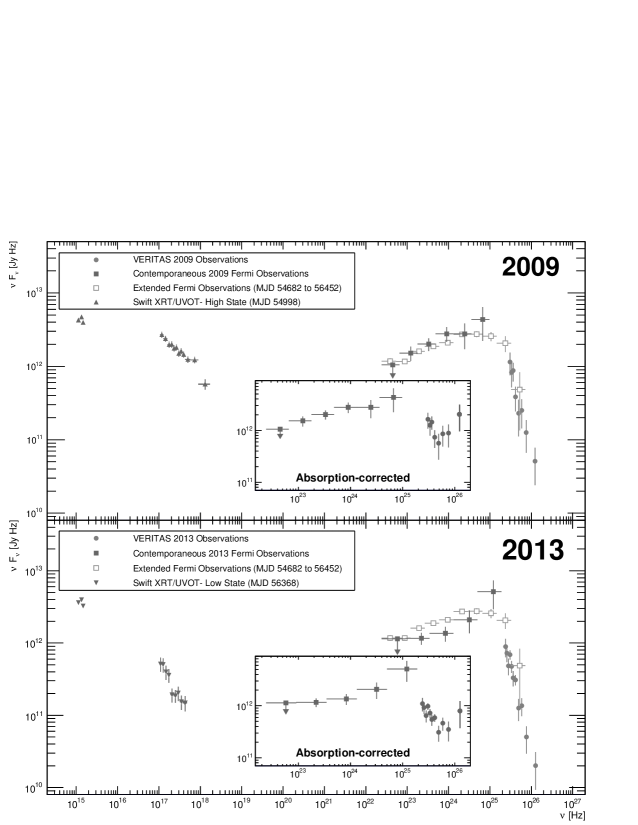
Two broadband SEDs of PKS 1424+240 are shown in Figure 4, corresponding to relatively high and low states. Two inset plots show the absorption-corrected VHE data according to the EBL model in Gilmore et al. (2012). There is an indication of spectral hardening at the highest energies in the absorption-corrected VHE spectrum. Similar results are seen when absorption correction is done according to a variety of EBL models, such as Domínguez et al. (2011); Finke et al. (2010); Franceschini et al. (2008).
The contemporaneous LAT data are also shown in the insets of Figure 4, but the correction for EBL absorption is at the highest energy LAT spectral points. Spectral results derived from the full LAT observations are also shown, and are consistent with the VERITAS observations. The synchrotron peaks are shown with Swift XRT and UVOT observations from relatively high and low states. Since the synchrotron peak is known to be above UV energies (e.g. Acciari et al. 2010), these observations constrain the location of the synchrotron peak (1015-1016 Hz) during relatively low and high synchrotron flux states. The source is not detected between 14 and 195 keV by the Burst Alert Telescope onboard Swift in 70 months of data (Baumgartner et al., 2013).
4 Discussion
The blazar PKS 1424+240 resides at , with a VHE flux that is significantly attenuated by the EBL. Discovery observations of this source by VERITAS have shown a marginal indication of spectral hardening at the highest energies, after correction by the EBL (Furniss et al., 2013). While a similar effect is seen in the deep observations obtained in 2013, the significance of the effect remains marginal because of the lower overall flux level during this epoch. In both epochs the data are consistent with a simple power law, even after correction for absorption by the EBL. If the indication of spectral hardening could be confirmed, one possible explanation would be an over-estimation of the EBL density, although the results shown use one of the lowest density EBL models currently available, which approaches the galaxy count lower limits of the EBL density at .
The possible spectral hardening is of great interest, because if it is not from over-estimation of the EBL, there are a number of physical mechanisms which can produce hardening with increasing energy. Second-order synchrotron self Compton emission, pair-cascades initiated by pion decay in hadronic emission scenarios (Böttcher et al., 2013) or internal photon-photon absorption (Aharonian et al., 2008) can produce hard components at high energy. There are also scenarios that describe spectral hardening as arising from hadronic cosmic-ray line-of-sight interactions with the cosmic microwave background and EBL. These processes can produce secondary gamma rays close to the observer, hardening the observed VHE spectrum (Essey & Kusenko, 2010a, b; Essey et al., 2011; Essey & Kusenko, 2012; Murase et al., 2012; Razzaque et al., 2012; Prosekin et al., 2012; Aharonian et al., 2013; Zheng & Kang, 2013; Kalashev et al., 2013; Inoue et al., 2013). This component is expected to become dominant at high energies where the EBL opacity is greater than 2 and is not expected to vary on timescales shorter than about a year. The VERITAS observations above 310 GeV (where according to Gilmore et al. 2012 and Kneiske & Dole 2010) do not show significant variability between 2009 and 2013, nor can they strongly exclude it. More exotic theories, involving Lorentz invariance violation (Urry & Piran, 2008) or axion-like particles (ALPs), might also produce spectral hardening at high energies, e.g. Sánchez-Conde (2009).
The blazar can be categorized as an high-synchrotron-peaked (HSP) BL Lac, with a synchrotron peak above 1015 Hz (Abdo et al., 2010) and an isotropic luminosity above 400 GeV of 1.03 erg s-1. At , it is apparent that PKS 1424+240 represents a powerful tool for studying intrinsic emission mechanism(s) within blazar jets, extragalactic cosmic-ray propagation and the propagation of VHE photons across extragalactic space. Future studies will benefit from additional VHE observations as well as from any additional information that will be obtained about the redshift, e.g. from HST/STIS UV observations.
References
- Abdo et al. (2009) Abdo, A. A., Ackermann, M., Aqudo, I. et al. 2009, ApJS, 183, 46
- Abdo et al. (2010) Abdo, A. A., Ackermann, M., Agudo, I. et al. 2010, ApJ, 716, 30
- Abdo et al. (2011) Abdo, A. A., Ackermann, M. Agudo, I. et al. 2011, ApJ, 727, 129
- Abramowski et al. (2013) Abramowski, A., Acero, F. Aharonian, F. et al., 2013, A&A, 550, 4
- Acciari et al. (2010) Acciari, V. A., Aliu, E., Arlen, T. et al. 2010, ApJL, 708, 100
- Ackermann et al. (2012) Ackermann, M., Ajello, M., Allafort, A. et al. 2012, Science, 338, 1190
- Ackermann et al. (2013) Ackermann, M. , Ajello, M. Allafort, A. et al. 2013, ApJS, 209, 34
- Aharonian et al. (2006) Aharonian, F., Akhperjanian, A. G., Bazer-Bachi, A. R. et al. 2006, Nature, 440, 1018
- Aharonian et al. (2008) Aharonian, F., Khangulyan, D. & Costamante, L. 2008, MNRAS, 387, 1206
- Aharonian et al. (2013) Aharonian, F., Essey, W., Kusenko, A. & Prosekin, A. 2013, Phys. Rev. D. 87, 063002
- Albert et al. (2008) Albert, J., Aliu, E., Anderhub, H. et al. 2008, Science, 320, 1752
- Atwood et al. (2009) Atwood, W., Abdo, A., Ackermann, M. et al. 2009, ApJ, 697, 1071
- Baumgartner et al. (2013) Baumgartner, W. H., Tueller, J., Markwardt, C. B. et al., 2013, ApJS, 207,19
- Böttcher et al. (2013) Böttcher, M., Reimer, A., Sweeney, K. & Prakash, A. 2013, ApJ, 768, 54
- Burrows et al. (2005) Burrows, D.N., Hill, J.E., Nousek, J.A., et al. 2005, Space Sci. Rev., 120, 165
- Cogan (2008) Cogan, P. 2008, Proc. 30th Int. Cosmic Ray Conf., Vol 3, The VERITAS Gamma-ray Analysis Suite, ed. R. Caballero, J. C. D’Olivo, G.Medina-Tanco, L. Nellen, F. A. Sánchez & J. F. Valdeé-Galicia (Mexico City, Mexico: Universidad Nacional Autónoma de México), 1385
- Domínguez et al. (2011) Domínguez, A., Primack, J., Rosario, D. J. et al. 2011, MNRAS, 410, 2556
- Essey & Kusenko (2010a) Essey, W. & Kusenko, A. 2010, Astropart. Phys. 33, 81
- Essey & Kusenko (2010b) Essey, W. & Kusenko, A. 2010, Phys. Rev. Lett. 104, 141102
- Essey et al. (2011) Essey, W., Kalashev, O., Kusenko, A. & Beacom, J. 2011, APJ, 731, 51
- Essey & Kusenko (2012) Essey, W. & Kusenko, A. 2012, ApJL, 751, 11
- Finke et al. (2010) Finke, J., Razzaque, S. & Dermer, C. 2010, ApJ, 712, 238
- Fitzpatrick (1999) Fitzpatrick, E. 1999, PASP, 111, 63
- Fomin et al. (1994) Fomin, V. P., Sepanian, A. A., Lamb, R. et al. 1994, Astropart. Phys., 2, 137
- Franceschini et al. (2008) Franceschini, A., Rodighiero, G. & Vaccari, M. 2008, A&A, 487, 837
- Furniss et al. (2013) Furniss, A., Williams, D. A., Danforth, C. et al. 2013, ApJL, 768, 31
- Gilmore et al. (2012) Gilmore, R., Somerville, R., Primack, J. & Dominguez, A. 2012, MNRAS, 422, 3189
- Gehrels et al. (2004) Gehrels, N., Chincarini, G., Giommi, P et al. 2004, ApJ, 611, 1005
- Holder et al. (2006) Holder, J., Atkins, R. W., Badran, H. M. et al. 2006, Astropart. Phys., 25, 391
- Horns & Meyer (2012) Horns, D. & Meyer, M. 2012, JCAP, 2, 33
- Inoue et al. (2013) Inoue, Y., Kalashev, O. E. & Kusenko, A. arXiv:1308.5710
- Kalashev et al. (2013) Kalashev, O. E., Kusenko, A. & Essey, W. 2013 Phys. Rev. Lett. 111, 041103
- Kalberla et al. (2005) Kalberla, P., Burton, W., Hartmann, D. et al. 2005, A&A, 440, 775
- Kneiske & Dole (2010) Kneiske, T. M. & Dole, H., 2010, A&A, 515, 19
- Li & Ma (1983) Li, T. & Ma, Y. 1983, ApJ, 272, 317
- Murase et al. (2012) Murase, K., Dermer, C., Takami, H. & Migliori, G. 2012, ApJ, 749, 63
- Mattox et al. (1996) Mattox, J., Bertsch, D., Chiang, J. et al. 1996, ApJ, 461, 396
- Nikishov (1962) Nikishov, A. I. 1962, JETP, 14, 393
- Nolan et al. (2012) Nolan, P. L., Abdo, A. A., Ackermann, M. et al. 2012, ApJS, 199, 31
- Poole et al. (2008) Poole, T., Breeveld, A., Page, M. J et al. 2008, MNRAS, 383, 627
- Prokoph (2013) Prokoph, H. 2013, PhD Thesis, Humboldt University Berlin
- Prosekin et al. (2012) Prosekin, A., Essey, W., Kusenko, A., & Aharonian, F. 2012, ApJ, 757, 183
- Razzaque et al. (2012) Razzaque, S., Dermer, C. & Finke, J. D. 2012, ApJ, 745, 196
- Rolke et al. (2005) Rolke, A., Wolfgang, A., López & A. Conrad, J. 2005, Nucl. Instrum. Meth, A551, 493
- Sánchez-Conde (2009) Sánchez-Conde, M., Paneque, D., Bloom, E., Prada, F. & Domínguez, A. 2009, Phys. Rev. D 79, 123511
- Scargle et al. (2013) Scargle, J., Norris, J., Jackson, B. & Chiang, J. 2013, ApJ, 764, 167
- Schlegel et al. (1998) Shlegel, D., Finkbeiner, D. & Davis, M. 1998, ApJS, 500, 525
- Urry & Piran (2008) Urry, J. & Piran, T. 2008, Phys. Rev. D 78, 124010
- Werner et al. (2004) Werner, M., Roellig, T. L., Low, F. J., et al. 2004, ApJS, 154, 1
- Zheng & Kang (2013) Zheng, Y. G. & Kang, T. 2013, ApJ, 764, 113
| VERITAS Results | Fermi LAT Results | ||||||||||||
|---|---|---|---|---|---|---|---|---|---|---|---|---|---|
| Epoch | Exposure | ON/OFF Region00footnotemark: | Excess | Signal | Spectral Reconstruction | Index | Flux 120 GeV | Percent | /DOF | Index | Curvature | Flux [0.1-300 GeV] | |
| [hr] | Events | Events | [] | Range [GeV] | [ m-2s-1] | Crab [%] | [] | [ cm-2s-1] | |||||
| 200911MJD 54881-54888, 54937-54943, 54968-54982, 54994-55003. | 28.5 | 3264/19635 | 423 | 8.5 | 120-750 | 3.80.3 | 2.10.3 | 4.6 | 3.2/6 | 1.730.07 | 8.31.3 | ||
| 201122MJD 55595-55604, 55620-55629, 55647-55662, 55677-55689, 55706-55711. | 14.6 | 4189/24792 | 540 | 8.1 | 115-375 | 4.30.6 | 2.10.3 | 4.6 | 7.3/6 | 1.790.08 | 7.81.2 | ||
| 201333MJD 56334-56341, 56358-56374, 56384-56400, 56413-56428, 56441-56447. | 66.8 | 12869/76307 | 1675 | 14.4 | 100-750 | 4.50.2 | 1.020.08 | 2.2 | 7.5/9 | 1.770.09 | 6.31.2 | ||
| Contemp.44Contemporaneous: includes all 2009, 2011 and 2013 epochs summarized above. | 109.9 | 20322/120734 | 2638 | 18.1 | 100-750 | 4.20.3 | 1.300.08 | 2.8 | 21.2/9 | 1.770.05 | 7.70.7 | ||
| Full55Fermi LAT data between MJD 54682 to 56452. Data fit with a log-parabolic model which includes absorption by the Gilmore et al. (2012) EBL model. | 1.640.06 | (2.70.8) | 7.370.04 | ||||||||||