Energy- and momentum-conserving AGN feedback outflows
Abstract
It is usually assumed that outflows from luminous AGN are either in the energy-conserving (non-radiative) or in the momentum-conserving (radiative) regime. We show that in a non-spherical geometry the effects of both regimes may manifest at the same time, and that it is the momentum of the outflow that sets the relation. Considering an initially elliptical distribution of gas in the host galaxy, we show that a non-radiative outflow opens up a wide “escape route” over the paths of least resistance. Most of the outflow energy escapes in that direction. At the same time, in the directions of higher resistance, the ambient gas is affected mainly by the incident momentum from the outflow. Quenching SMBH growth requires quenching gas delivery along the paths of highest resistance, and therefore, it is the momentum of the outflow that limits the black hole growth. We present an analytical argument showing that such energy-conserving feedback bubbles driving leaky ambient shells will terminate SMBH growth once its mass reaches roughly the mass derived earlier by King (2003) for momentum-conserving AGN outflows. Our simulations also have potentially important implications for observations of AGN jet feedback and starburst galaxy feedback. The collimation of the wide angle AGN outflow away from the symmetry plane, as found in our simulations, indicates that credit for work done by such outflows may sometimes be mistakenly given to AGN jets or star formation feedback since wide angle outflows are harder to observe and the phase when they are present may be short.
keywords:
quasars:general — galaxies:evolution — accretion, accretion discs — black hole physics1 Introduction
Over the past decade, there has been growing interest in and understanding of the role of feedback from active galactic nuclei (AGN) in the evolution of galaxies. Astronomers now generally agree that outflows caused by AGN feedback can drive gas out of galaxies and quench star formation in the host (Silk & Rees, 1998; Page et al., 2012), thus establishing the observed correlations between the supermassive black hole (SMBH) mass and host galaxy spheroid velocity dispersion (Magorrian et al., 1998; Ferrarese & Merritt, 2000; Tremaine et al., 2002; Gültekin et al., 2009), dynamical mass (Häring & Rix, 2004; McConnell et al., 2011) and other parameters (Aller & Richstone, 2007; Feoli & Mancini, 2009).
A considerable effort was extended to explain these findings from a theoretical standpoint, but the problem remains far from being solved. Both semi-analytical (Croton et al., 2006; Bower et al., 2006) and numerical simulations (e.g., Di Matteo et al., 2005) showed that AGN feedback must be a key ingredient in galaxy formation and evolution, especially at the high mass end. However, the precise mechanism of the feedback communication from the AGN to galaxy’s gas remains elusive to this day. The situation is complicated since there is no agreement on which process – wide angle gas outflow, jet, or radiation – is the main mechanism of feedback, and also whether this delivers energy (heating), physical push (momentum), or both, to the ambient gas. For example, Di Matteo et al. (2005, 2008); Booth & Schaye (2009) show that depositing of the AGN luminosity into the ambient gas during the rapid Eddington-limited SMBH growth establishes the observed correlations. Sijacki et al. (2007) adds to the picture jets in form of hot bubbles emitted by AGN at lower accretion rates, while jets in Dubois et al. (2012b) also transfer momentum to the ambient gas. Sazonov et al. (2005) and Ciotti & Ostriker (2007) propose that Compton radiative heating of ambient gas by AGN radiation field plays a significant role in limiting SMBH growth. Fabian (1999); Thompson et al. (2005); Debuhr et al. (2011) suggest that radiation pressure on dust is the main culprit of AGN feedback. Wide angle outflows from AGN that deliver momentum to the ambient gas are investigated by Debuhr et al. (2010). King (2003, 2005) considers effects of a wide angle outflow on the ambient gas; both momentum and energy of the outflow are important.
In this paper we focus on the effects of fast wide angle outflows from AGN on the host galaxy gas in the context of the King (2003) model. Our main results are however more general, and add to a growing body of work showing that the efficiency of energy deposition into the ambient gas is actually quite low if the gas is clumpy or inhomogeneously distributed. Wagner et al. (2012) studied numerically (using a grid-based code) the interaction of a powerful jet with two-phase medium in the host galaxy, and found that the efficiency of energy transfer to the cold medium is only % (undoubtedly this particular number depends on the parameters of the cold phase and, perhaps, numerical resolution). Wagner et al. (2013) extended this work to the case of wide angle outflows, and found similar results. These authors found that “the outflow floods through the intercloud channels, sweeps up the hot ISM, and ablates and disperses the dense clouds. The momentum of the UFO is primarily transferred to the dense clouds via the ram pressure in the channel flow, and the wind-blown bubble evolves in the energy-driven regime.”
Bourne, Nayakshin & Hobbs (2013; submitted, BNH13 hereafter) used a completely different numerical technique – smoothed particle hydrodynamics (SPH; see, e.g., Springel, 2010), employing the “SPHS” algorithm of Hobbs et al. (2013a) that is designed to reduce artifical numerical effects of the classical SPH in a clumpy medium. BNH13 obtained results very similar to that of Wagner et al. (2013), and proposed that this inefficiency of AGN feedback energy deposition into the ambient medium explains how SMBH can grow to the substantial masses observed despite producing huge amounts of energy in the fast outflows that could destroy bulges of host galaxies multiple times over. Nayakshin (2013) included these effects into an analytical study of AGN feedback and showed that the observed relation can be reproduced by such energy-conserving flows if star formation in clumpy medium is also taken into account.
In this paper we perform numerical simulations with a “classical” SPH code that has a different implementation of AGN feedback compared to either Wagner et al. (2013) or BNH13, and different initial conditions for the ambient gas in the galaxy. We consider initially homogeneous, rather than clumpy, medium but distribute it in a non-spherical geometry. As an example, we consider AGN feedback on an elliptically distributed ambient gas in a galaxy, so that gas density along the galactic plane is highest and drops gradually to the lowest value perpendicular to the plane. This geometry should be considered as a simplest rudimentary step closer to realistic galaxies, which are mostly non-spherical except perhaps in the case of “red-and-dead” elliptical galaxies.
Despite these numerical and set-up differences with previous studies, we recover the main conclusions of Wagner et al. (2013) and BNH13. We find that the AGN feedback quickly inflates two outflow bubbles perpendicularly to the galactic plane, where the gas density is lowest. Most of the feedback energy escapes through these funnels, leaving the denser gas exposed mainly to the momentum of the AGN wind. Therefore, the dense gas behaves as if it were affected by momentum feedback only. The energy-momentum separation found in our simulations is large-scale rather than local, small scale, as in Wagner et al. (2013) and BNH13, but the final conclusions are similar.
We also provide a simple analytical argument (related to an earlier study of “leaky feedback bubbles” in the content of stellar feedback by Harper-Clark & Murray, 2009) that confirms the main result of Nayakshin (2013): since the cold gas is momentum-driven, the SMBH mass required to expel the cold shell in this energy-conserving regime is similar to the momentum-driven result of King (2003), which in itself is pleasingly close to the observed relation (Ferrarese & Merritt, 2000; Tremaine et al., 2002; Gültekin et al., 2009).
The paper is structured as follows. We begin with a brief review of the state-of-the-art of our understanding of the physics of ultra-fast outflows in spherically symmetric models in §2.1 - 2.3. We then present in §2.4 a toy model spherically symmetric “leaky shell” calculation that takes into account energy escape from the bubble via low density channels in the ambient shell. In Section 3 we describe the setup of numerical simulations and in Section 4 we present their results. We follow with a discussion in Section 5 and summarize and conclude in Section 6.
2 Theoretical Preliminaries
2.1 Radiation from AGN
Direct AGN radiation impact on gas in the host galaxy is unlikely to be the main driver of SMBH-galaxy coevolution. Radiation pressure effect on dust even in initially homogeneous ambient medium is likely to be limited to momentum push of due to development of radiation Rayleigh-Taylor instability (Krumholz & Thompson, 2013). This then falls short by a factor of at least of what is required to drive the gas out of the host completely (Silk & Nusser, 2010). Furthermore, it is fairly obvious that effective radiation pressure on cold clumps in a clumpy multi-phase medium would be even less significant than in the initially uniform ambient gas shell, since most of the AGN radiation field may never impact the cold clouds if their covering angle as seen from the AGN is small. In contrast to Murray et al. (2005), we therefore doubt that radiation pressure is ever enough to put SMBH on their relations.
Even for homogeneous gas distributions, radiation heating by Compton effect is likely to be efficient only at low gas densities, that is, for galaxies at low redshift (see Sazonov et al., 2005), whereas most of SMBH growth occurs at high redshift. For inhomogeneous, i.e., clumpy multi-phase medium, the rate of radiative heating of cold gas becomes too low to heat it to high temperatures (Sazonov et al., 2005). Furthermore, the column density of denser cold clumps can be much greater than 1 g cm-2 (cf. BNH13), so that soft and medium energy X-rays do not penetrate the clouds. This further reduces the significance of AGN radiative input into the gas.
2.2 Relativistic jets from AGN
Relativistic jets emanating from AGN are implicated as important feedback sources, especially in galaxy cluster environment (see Fabian, 2012, for a recent review). Here we concentrate on the early gas-rich epoch of isolated galaxies, where AGN are likely to be in the “quasar mode” when jets are not expected to be crucially important (e.g., Churazov et al., 2005; Sijacki et al., 2007). In addition, as Wagner et al. (2013) demonstrate, the effects of wide-angle and collimated outflows in the energy-conserving regime (negligible radiative cooling) are actually very similar after the outflow shocks against the ambient medium, which always inflates a wide angle hot gas bubble. Therefore we only study wide-angle outflows below, but expect the main results to be similar for jets in the energy-conserving regime.
2.3 Ultra-fast wide angle outflows
The AGN wind feedback model of King (2003, 2005, 2010b) is very attractive for a number of reasons. First of all, it is based on observations (e.g., Pounds et al., 2003b, a; Tombesi et al., 2010; Pounds & Vaughan, 2011b, a) that show that luminous AGN (, King et al., 2013) drive powerful and fast () winds. These observational results are deeply natural on theoretical grounds (King & Pounds, 2003), first pointed out in the classical “Standard Accretion Disc Theory” of Shakura & Sunyaev (1973): AGN radiation escaping to infinity is likely to accelerate gas to velocity of order the local escape velocity (e.g., Proga et al., 2000; Everett & Ballantyne, 2004), which is as high as in the innermost region of accretion discs, where most AGN radiation is produced. For SMBH accreting at near Eddington accretion rates the momentum flux is expected to be .
An important element of the physics of the model is the presence of two modes of feedback. One, called the momentum-driven outflow, is appropriate for the case when the relativistic wind emanating from the vicinity of the SMBH shocks against the ambient medium and cools efficiently, transferring only its ram pressure (and, hence, momentum flux) to the ISM. This mode of feedback is essential in explaining the M-sigma relation (King, 2010b). Similar arguments based on energy-conserving outflows predict SMBH masses that are several orders of magnitude lower than observed111unless an arbitrary and significant reduction in feedback efficiency is introduced. (Silk & Rees, 1998; King, 2010a). The second type of AGN wind feedback, termed the energy-driven or the energy-conserving outflow, occurs when the cooling of the shocked primary outflow from the SMBH is inefficient and leads to a hot wind bubble expanding from the centre of the galaxy, transferring most of its kinetic luminosity to the ISM. This type of outflow can drive all of the ambient gas of the host galaxy out at velocities exceeding km/s and drive mass outflows of several thousand yr-1 (King et al., 2011; Zubovas & King, 2012a), in accordance with the recently-observed molecular outflows in several active galaxies (Feruglio et al., 2010; Rupke & Veilleux, 2011; Sturm et al., 2011). The model may also account for the “Fermi bubbles” in the Milky Way (Zubovas & Nayakshin, 2012).
At a fixed SMBH mass and luminosity, the regime in which the UFO impacts the gas in the host depends mainly on the location of the contact discontinuity between the wind driving the shock and the outflowing ISM. If the contact discontinuity is closer than some critical distance (called the cooling radius) from the AGN, the shocked wind cools efficiently via inverse-Compton scattering (Ciotti & Ostriker, 1997; King, 2003), resulting in a momentum-driven flow (King, 2010b). When the contact discontinuity moves beyond , the shocked wind no longer cools, leading to an energy-driven outflow (King et al., 2011). The velocity of this outflow propagating in an isothermal potential with velocity dispersion km/s is (cf. King, 2005; King et al., 2011)
| (1) |
where is the radiative efficiency of accretion, is the speed of light, is the gas fraction (assumed constant with radius) and is its cosmological value. In the second equality, we scaled the result to and . Zubovas & King (2012b) calculate the cooling radius to be pc for typical AGN parameters; this large value suggests that momentum-driven outflows are important in the central parts of galactic bulges and are the relevant mode of feedback for establishing the relation.
However, the derivation of this cooling radius depends on the assumption that the shocked wind contains ions and electrons with the same temperature K (hence we call this the “One temperature”, or 1T, model). Faucher-Giguère & Quataert (2012) showed that when the energy equilibration timescale is accounted for, the electrons in the shocked wind only reach temperatures of K. The lower than expected may be the reason why the Inverse Compton (IC) radiation from the cooling reverse shock of the fast outflows from AGN has not yet been observationally identified (Bourne & Nayakshin, 2013, BN13 hereafter). Potential implications of an inefficient electron-ion coupling are very significant for this AGN feedback model. At K, the cooling rate via IC scattering on the AGN radiation field - the primary cooling mechanism acting on the wind - is much smaller than in the 1T model, leading to a situation where the outflow is energy-driven at every distance from the AGN. Even within the 1T model, properly accounting for the accumulation of energy in the shocked wind leads to a much lower value of the derived cooling radius (McQuillin & McLaughlin, 2013), so that AGN outflows should generally be in the energy-driven regime.
2.4 A toy model: a leaky shell
At first glance, the results of Faucher-Giguère & Quataert (2012) and BNH13 are very troubling for the wind feedback model. If the outflows are energy-driven even at the very centre of the galaxy, then the SMBH needs a much lower mass in order to expel the surrounding gas, quench its own fuel supply and thus establish the M-sigma relation. However, Nayakshin (2013; N13 hereafter) noted that the feedback model of King (2003) also assumes that the ISM in the galaxy is spherically symmetric and smooth. As a result, the AGN expels gas evenly in all directions and the fuel supply is cut once the outflow bubble begins expanding. Arguing instead that the ISM of the host galaxy’s bulge is clumpy, and that the clumps are over-taken by the outflow easily, N13 showed that it is only the momentum of the AGN outflow that matters in expelling the high density clumps out. Further, the densest clumps are self-gravitating and will form stars sooner than they could feed the SMBH. Using these two constraints together, N13 showed that the SMBH stops growing when it reaches the mass of order the mass derived by King (2003), despite the outflow being in the energy-driven regime.
We now use a toy quasi-spherical model to argue that energy-conserving AGN outflows acting on broken up “leaky shells” would push them mainly by the ram pressure of the outflow, and that this fact actually leads to an relation that is quite similar to that derived by King (2003). Our conclusions here are similar to those reached by N13.
Following King (2003), we write down the momentum equation for a swept-up shell of ambient gas at radius . In the singular isothermal potential (SIS) with 1D velocity dispersion , the shell’s mass is . The momentum equation for the shell moving outward with velocity is (King, 2005)
| (2) |
where is the total (dark matter, stars and gas) enclosed mass inside radius . Note that the term for the SIS potential, so this can be simplified to
| (3) |
In the momentum-driven limit, King (2003) derived a theoretical relation,
| (4) |
where is the electron scattering opacity. Equation (4) has no free parameter except for . In young gas-dominated galaxies, this parameter is close to one. Later, star formation depletes the gas, while larger scale processes, such as cooling flows from cluster environments, replenish its content. Zubovas & King (2012b) showed that these processes can produce a spread in the final SMBH masses of a factor . If one assumes that , eq. (4) gives a result within a factor of of the observed correlation (Gültekin et al., 2009; Ferrarese & Merritt, 2000). In reality, this assumption is not quite correct, because the gas fraction in galaxies varies with mass and star formation rate (Daddi et al., 2010; Santini et al., 2014) and large gas fractions are expected in galaxies in the early Universe (Dubois et al., 2012a). In fact, a systematically varying gas fraction might explain why the observed relation has steeper slope than predicted by eq. (4) (Zubovas & King, 2012b).
We now consider the energy driven limit. Since the bubble expands very slowly compared with the sound speed of the hot gas filling it, , one may expect that the pressure, density and temperature within the bubble will be approximately uniform. Let be the bubble’s thermal energy; here we assumed that adiabatic index is . The energy equation for the bubble is therefore (King, 2005)
| (5) |
On the right hand side of this equation, the first term is the energy deposition rate into the bubble due to the wind launched by an AGN with luminosity ( being the Eddington luminosity), the second term is the adiabatic expansion losses for the bubble, with being the bubble’s volume, the third one is the work done against gravity when lifting the shell out of the potential. Finally, the last term is new compared to King (2005) and is a parameterisation of the energy escape from the bubble. Expressed as , it is a generic loss term, applicable to all losses where the loss timescale does not depend strongly on bubble size, shape or energy content. In this case, we consider adiabatic energy escape with gas leaking out of the bubble. We reason that if there are escape channels for the hot gas, the gas escapes moving at about the sound speed of the hot gas, . The rate of the mass flow through the opening is approximately , where is the solid angle of the escape route. The rate of energy loss rate from the bubble through the channel is . The last equation defines as
| (6) |
The escape time is therefore roughly the sound crossing time of the bubble divided by the fraction of the angle open for direct escape.
As in King et al. (2011), we seek a constant velocity solution for the expanding bubble. Equation (3) is then
| (7) |
Substituting this into equation (5), and using equation (6), we obtain a cubic equation for outflow velocity,
| (8) |
This equation is identical to that obtained by King et al. (2011) except for the third term on the left side of the equation. This term is responsible for energy escape from the bubble. In the limit of negligible energy escape from the bubble, , we recover the approximate solution of King et al. (2011), , as given by equation (1).
In this section we are especially interested in the opposite limit, when the reverse shock energy leaks out of the shell rapidly, that is a few. In this case the third term on the left of equation (8) is the dominant one. Omitting all the other terms on the left, and setting , we obtain
| (9) |
We see that in this case, provided , , i.e., the expansion of the bubble is much slower. This makes perfect physical sense: since the energy of the hot bubble can make its way out of the bubble through empty channels, the bubble pressure and energy are much smaller than they are in the opposite case, and so the expansion is slower.
Further, if we set (that is, ), we see that to drive the shell outward at all,
| (10) |
which shows that the SMBH mass should be near the mass (King, 2003) for an energy-conserving outflow to drive the shell outward if the bubble is strongly leaky, e.g., a few.
Finally, substituting the approximate solution (9) into equation (7), we find that the force applied by the bubble onto the ambient shell is
| (11) |
This equation shows clearly that when energy leaking is significant, i.e. , the force acting on the shell is only a little larger than that due to the ram pressure of the UFO in the momentum-conserving limit, .
Our derivation shows that an energy-conserving (i.e. non-radiative) bubble that has wide escape channels for hot gas drives the ambient shell outwards with a much smaller efficiency, consistent within a factor of order unity with the momentum-driven regime. The physical origin of this result is transparent. Mechanical loss of bubble energy through cavities is a form of cooling (adiabatic expansion rather than radiative). The bubble is therefore less energetic than in 1D solution without energy escape channels (King, 2005). The limiting case of a large fraction of the outflow energy escaping through the open channels should produce outward pressure comparable with just the ram pressure of the wind; hence the result.
This derivation may alleviate a certain tension between the AGN wind feedback model of King (2003) and numerical simulations of galaxy formation which include AGN feedback (e.g., Di Matteo et al., 2005; Sijacki et al., 2007; Booth & Schaye, 2009; Dubois et al., 2012a). These simulations typically adopt a coupling factor between the AGN luminosity and kinetic outflow energy; the parameter is calibrated in order for the simulations to produce SMBH masses in accordance with observations. This is consistent with the amount of energy injected by the fast outflow into the host galaxy in the King (2003) model. However, in the latter model most of this energy is lost to IC radiation within the cooling radius, so that the outflow is momentum-driven, whereas the simulations cited above do not include the semi-relativistic IC energy losses and should thus be energy-conserving instead.
It is then somewhat puzzling why the simulations recover the correct M-sigma relation despite assuming a different physical mechanism. A possible solution to this issue is that the cosmological simulations cited above may well contain the ”leaky shell” effects considered in this section. If this is the case, then, although the feedback energy injected into the gas is much higher than necessary for gas expulsion, most of this energy escapes through low-density gaps in the gas distribution. The momentum given to cold dense gas is then much lower than in spherically symmetric analytical models, explaining the discrepancy.
Our toy analytical model makes several simplifying assumptions regarding the structure of the galaxy. One such assumption is the isothermal density profile of the background potential. This assumption is roughly correct for early-type galaxies (Koopmans et al., 2009), but in general, galaxies have somewhat triaxial dark matter distributions (Bailin & Steinmetz, 2005; Diemand & Moore, 2011). In the cases where the background potential density is higher in the plane of the galaxy, the effect we describe becomes even more pronounced, as the gas has an easier time escaping in the polar direction. In the opposite case, where the dark matter halo density is higher in the polar direction, the effect is somewhat mitigated, but not negated completely, since in the central parts of the galaxy, baryonic matter dominates the potential and its distribution is more important that the variations in dark matter density.
3 Numerical model
We now design a numerical experiment to see if energy can indeed “leak” in non-spherical geometries. Unlike BNH13, we run SPH simulations of energy-driven AGN feedback on homogeneous surrounding gas distributions. We use the hybrid N-body/SPH code Gadget-3 (an updated version of the code by Springel, 2005). The code employs adaptive smoothing lengths for both hydrodynamics and gravity (see Springel, 2010, for a review of SPH methods in astrophysics) in order to keep the same number of neighbours within a particle’s smoothing kernel. We utilize a standard cubic spline kernel with 40 neighbours.
Our simulations contain gas and the SMBH embedded in a static isothermal background potential with km/s. The gas is distributed in a spherical shell with kpc and pc, and the total mass of the gas is set at . Each simulation uses particles, giving a particle mass of and mass resolution . We take the SMBH mass to be the formal critical mass that allows driving the gas out by pure momentum feedback: .
The gas is distributed in a way to give higher density in the equatorial plane and lower density at the poles. Numerically, we do this by a transformation tantan, where tan and is a free parameter. We investigate three cases: (spherically symmetric), and . For , the effective gas fraction in the initial distribution varies from in the polar direction and in the equator; for , the values are and , respectively. In addition to this “squeezing”, for each case we investigate the effect of rotation by running a model with and a model with around the Z axis; given the background potential and the gas distribution, the circular rotation velocity in the midplane is . We label the six models by their values and the presence of rotation: Z0R0, Z0R1 and so on (see Table 1).
| (spherical) | |||
|---|---|---|---|
| Z1R0 | Z2R0 | Z5R0 | |
| Z1R1 | Z2R1 | Z5R1 |
BNH13 studied the response of the ambient inhomogeneous medium to a single hot bubble inserted by hand in the initial condition of the simulation. Here we implement continuous AGN feedback by using the “virtual particle” method (Nayakshin et al., 2009). With this approach, the AGN emits feedback particles that carry momentum and energy. The momentum carried by a single virtual particle is chosen to be , which is sufficiently small to preserve simulation accuracy (see Nayakshin et al., 2009).
The number of particles emitted is then determined from the condition that the total momentum emitted by the SMBH is , where is the current black hole timestep. Typically, there are virtual particles in the simulation at any given time, although this number grows as the volume swept up by the black hole outflow increases. While the above number of virtual particles may seem small, one need to remember that virtual particles are continuously created and destroyed (see below). Since they move through the simulation volume at speeds much exceeding the mean gas velocities, this implies that the total number of virtual particles created and discarded during a simulation usually significantly exceeds the total number of SPH particles.
Operationally, virtual particles propagate in straight lines radially away from the SMBH with velocities and interact with SPH particles only when they are within a smoothing kernel of one or more SPH particles. In this paper, both momentum and energy of virtual particles is transferred to the SPH neighbour particles. The rate at which different neighbour particles receive their energy and momentum kicks is proportional to their contribution to the local gas density (that is, the local value of their SPH kernel). This feature of the code is important in properly distributing AGN feedback in a multi-phase environment.
The virtual particle energy and momentum are reduced with each interaction over a length of about one SPH smoothing lengh, to prevent numerical artefacts, and the particles are removed from the simulation when their momentum drops to negligible values. The timesteps of virtual particles are carefully monitored so that they do not skip interactions with dense (and hence compact) gas regions. With this method, our results are thus complimentary to those obtained by BNH13 not only in terms of initial conditions but also in terms of numerical methods.
The mass of the SMBH is assumed to stay constant (we track particle accretion, but do not add their mass to the SMBH mass, because the gas accretes on a viscous timescale , the duration of our simulations) and the AGN radiates at its Eddington luminosity and emits virtual particles moving radially with a constant velocity , carrying a total momentum and energy . When the virtual particle enters an SPH particle’s smoothing kernel, momentum and energy is transferred to the SPH particle. The transfer happens over several timesteps and several SPH particles can be affected by a single virtual particle. In order to minimize the noise from stochastic variations in virtual particle positions, we calculate their number so that a single virtual particle has . Virtual particles that lose of their initial momentum (and energy, because the two are transferred in exactly the same way) are removed from the simulation.
In addition to SMBH wind feedback, ambient gas is also affected by radiative heating from AGN radiation. The gas is allowed to cool by bremsstrahlung, IC and metal recombination line emission. We model these processes and the radiative heating from the AGN by using the heating-cooling prescription from Sazonov et al. (2005). These authors calibrated their heating-cooling curve to a typical AGN spectrum, which typically has of the bolometric power in X-rays. Their ionization parameter is defined with respect to the total bolometric luminosity, and this is what we do as well. The prescription assumes that all of the gas is optically thin to the photoionizing radiation; given that the inner edge of our gas distribution is at pc, the column depth is of order cm-2, i.e. the gas is marginally Compton-thin. In denser regions, where the gas would be self-shielding, a more proper treatment of gas optical depth would only enhance the results seen in our simulations, i.e. cooling and fragmentation of gas into numerous dense clumps. We modify the cooling function by suppressing gas cooling at temperatures above K with an extra factor exp, in order to prevent numerical overcooling of gas on the inner boundary of the shocked wind bubble. This is invoked since the thickness of the layer in which the virtual particles deposit their energy may be somewhat over-estimated, hence under-predicitng the temperature of the shocked gas. Our main results are very insensitive to this code detail, however.
In order to speed up the simulations, we convert gas particles into star particles according to a Jeans’ condition. Whenever a gas particle density increases above the critical value
| (12) |
where K, it is converted into a star particle of the same mass, which subsequently interacts with the other particles only via gravity. The critical density assumes that the Jeans mass is resolved in the gas. For the warm ISM with K, the temperature floor of our model, the typical densities are , so we are confident that we do not overpredict the formation rate of gravitationally bound clumps. We choose a Jeans’ criterion, instead of a simple temperature-independent density threshold, for the formation of sink particles in order to ensure that there is no spurious sink particle formation at shock fronts.
4 Results
The simulation results are presented below. We focus on three main aspects of model evolution: the morphology of outflowing gas, the distribution of gas velocities in polar and equatorial directions and the distribution of energies for particles of different density. Together, these indicators reveal that dense gas is pushed away almost exclusively by the momentum input from the AGN, while the diffuse gas carries away most of the wind energy.
4.1 Gas morphology
The high-energy wind from the AGN begins heating and pushing the surrounding medium as soon as the AGN switches on. In the spherically symmetric case, the hot bubble expands and a shell forms around it. The shell initially expands with a velocity km/s, consistent with the analytical prediction km/s (eq. 1; see also Figure 1). Very quickly, however, the shell cools and starts fragmenting into filaments and clumps. This effect has already been described in Nayakshin & Zubovas (2012). A side effect of fragmentation is that the radial expansion slows down to km/s. This occurs partly due to leaking of wind energy through gaps of lower density and partly due to the outflowing shell encountering ambient gas with progressively larger inward velocities. Gas rotation changes some details of the clump positions, but the overall dynamics of the outflow are hardly affected.
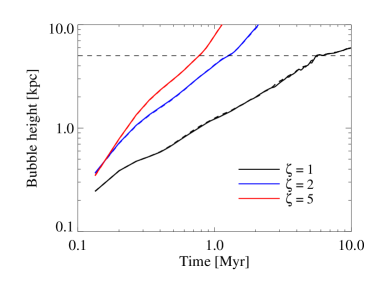
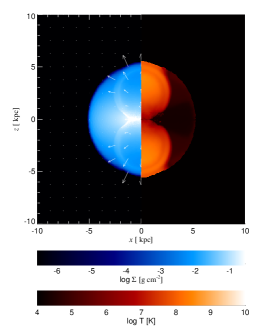
In non-spherical models, the outflow quickly develops a bipolar morphology (Figure 2, left panel). By Myr, the bubble has already reached the edge of the initial gas distribution ( kpc; see also Figure 1), while in the equatorial direction, gas is only pushed out to kpc. The mean velocities in polar and equatorial directions are, therefore, km/s and km/s, respectively. The analytical calculation, based on initial density contrast, gives a much smaller difference between the two: km/s and km/s. This result suggests that there is significant re-direction of shocked wind energy from the equator toward the direction of least resistance, i.e. toward the poles (also see Section 4.2, below).
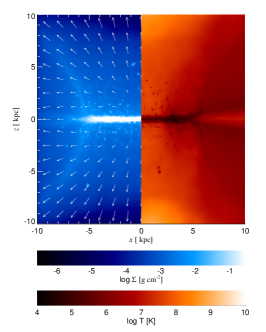
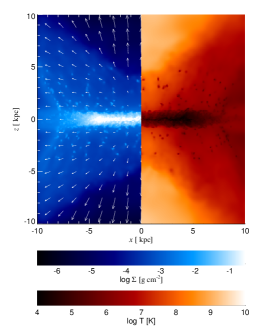
Later, the bubble expands laterally as well as vertically, further compressing the gas in the midplane. Several cold dense clumps form and move outward, embedded in the hot gas (see Figure 2, middle panel; also see Section 5.3), but most of the dense gas stays in the equatorial plane. By 10 Myr (Figure 2, right panel), the cold gas is squeezed into a thin disc with vertical extent kpc. The disc is pushed outwards at a mean velocity of km/s. Its density reaches cm-3 and sink particles start to form. By the end of the simulations, of the SPH particles are converted into sink particles.
One interesting feature developing at late times is an outflowing “atmosphere” on either side of the disc. This region of intermediate density ( cm-3) extends above the disc plane to a height of kpc in the central regions, flaring to reach more than kpc at cylindrical radii of kpc. Gas in this region rises with vertical velocity km/s and has a similar velocity component in the XY plane. Such an outflow might be erroneously interpreted as a supernova-driven wind coming from the disc, especially if observed coming from a face-on galaxy where the planar velocity component is difficult to determine.
4.2 Gas dynamics
In Figure 3, we plot the mean radial velocity of outflowing gas as function of time. Solid lines show vertical expansion velocity (i.e. velocity of gas with ), while dashed lines show the radial velocity in the horizontal direction (). We only plot the velocities of the non-rotating models; rotating models show very similar behaviour.
As expected, the two velocities in the spherically symmetric case are approximately the same. The velocity rises to a maximum of km/s with a broad peak around Myr, before slowly decreasing; by Myr, velocity has dropped to km/s. The decrease happens for three reasons. First of all, some of the wind energy leaks out through gaps in the bubble, so the force driving the outflow decreases. Secondly, the ambient gas shell accelerates inwards before joining the outflow, so the mass in the outflowing shell increases slightly faster than linearly (as assumed in the analytical calculation). The third reason is numerical, as some of the wind energy is lost due to overcooling of the highest temperature gas.
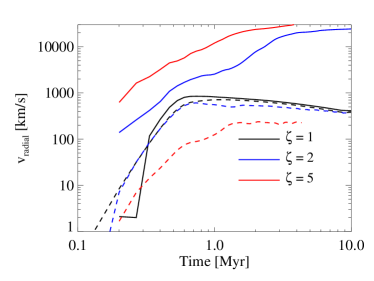
In the non-spherical models, the difference in velocities in the two directions is significant from the very beginning. In the model Z2R0, the equatorial plane velocity ( km/s) is slightly lower than for the spherically symmetric model and the analytical prediction ( km/s). In the vertical direction, the velocity rapidly increases to km/s (higher than the analytical prediction of km/s). The velocity then stays approximately constant until the bubble breaks out of the initial shell. The situation is qualitatively similar in the Z5 model, except the difference between the analytical prediction and numerical result is even more pronounced ( km/s and km/s).
Part of the reason for the difference between analytically calculated outflow velocities and numerical results is the evolving density contrast between gas in the polar and equatorial directions. The initial differences gradually grow as gas is evacuated from the bubbles in the polar direction, while at the same time the high-pressure bubbles squeeze the gas vertically toward the midplane. The net result is that the gas fraction of dense gas is increasing, and its velocity decreasing, while the opposite is true for the diffuse gas in the polar direction.


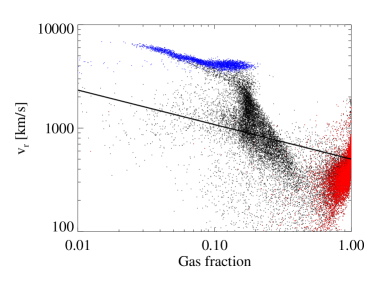
However, the leaking of wind energy in the direction of lower resistance is also an important, if not dominant, contributor to the velocity difference. To see this, we plot the velocities and effective gas fractions for a selection of the SPH particles ( of the total number, chosen randomly) in simulation Z2R0 at Myr (Figure 4). The thick line shows the analytically predicted velocity (eq. 1); we colour particles close to the Z axis (; we plot all of these particles, since there are very few of them) in blue and those close to the midplane () in red; these are the same particles as the one used to calculate the mean vertical and horizontal velocities for Figure 3. The diagram shows only a very weak correlation between the analytical prediction and the actual gas velocities. Most gas with has velocities lower than predicted (the mean velocity of this gas is half of the predicted value), while gas with tends to move faster than predicted (the mean velocity is higher than given by eq. 1, with some gas reaching velocities more than three times higher than predicted). Some gas particles (blue points) move in the vertical direction with velocities of several thousand km/s; at later times, they accelerate to a significant fraction of the wind velocity . There are some outliers - gas particles with very high , which nevertheless have velocities higher than predicted analytically. These particles are the clumps seen in Figure 2 embedded in the diffuse outflow. They were accelerated to higher velocities very early in the simulation, when energy leaking in the vertical direction was less significant, and now continue to coast with those higher velocities through the lower density surrounding outflow. Overall, this diagram shows that diffuse gas carries away a significantly larger fraction of the shocked wind energy than would be predicted based on the analytical calculation applicable to the spherically symmetric case. We now show that this energy leaking results in cold dense gas being pushed mainly by the momentum of the AGN wind.
4.3 Energy partition in the flow
In this section, we show that the distribution of SPH particle energies reveals that low-density particles carry away most of the energy, while dense gas is only pushed away by the momentum of the AGN wind.
First of all, in Figure 5, we plot the change in the SPH particle specific energy for dense (, left panel) and diffuse (, right panel) gas in simulation Z2R0. The particle specific energy is defined as the sum of internal, kinetic and gravitational potential energy:
| (13) |
Here, the kpc scaling is chosen as an outer edge of the background gravitational potential. Self-gravity of the gas is not included in the definition above, but its contribution is small since the potential is dominated by the dark matter potential. The quantity plotted in the graphs is and is expressed in units of km2s-2. Thick solid lines show the mean energy, while the dashed lines represent deviations.
We see that the particle energies stay approximately constant from Myr onward, and that the diffuse gas has times higher specific energy than dense gas. Moreover, the typical energy input into dense particles is , of the same order as expected for a momentum-driven flow (). The energy input into diffuse particles is , slightly higher than expected for a spherically symmetric energy-driven flow. This energy discrepancy lends support to the claim that low-density particles are accelerated preferentially.
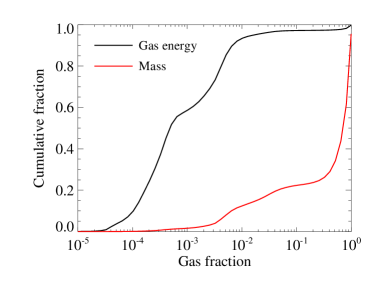
In Figure 6, we plot the cumulative distribution of the total gas mass (red line) and specific energy gain (, black line) as function of effective gas fraction at Myr for the model Z2R0. Most of the gas mass is contained in particles with . On the other hand, most of the energy is carried away by particles with very low densities (). Once again, this shows that energy is removed by the low density gas, while dense gas is exposed predominantly to the momentum of the AGN outflow.
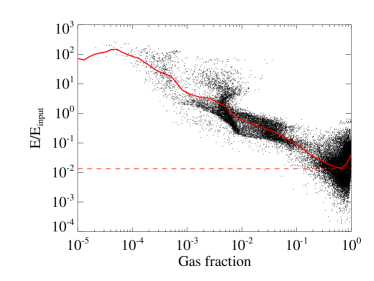
In Figure 7 we plot the ratio of SPH particle energy gain to the AGN wind energy input per particle as function of effective gas fraction for simulation Z2R0 at Myr. The AGN wind energy input is simply . The thick red line is the mean of the logarithm of this energy ratio (a small number, particles with negative energy gain are not included when calculating the mean), while the thin dashed line shows the fraction of input energy retained in a purely momentum-driven flow ().
Once again, we see that the low-density gas has much more energy than its share of the input. More revealing, the dense gas () has a typical specific energy retention fraction of , close to the momentum-driven outflow prediction. The fact that the typical energy ratio in dense gas varies by only a factor of lends support to the conclusion that dense gas is driven away by AGN wind momentum rather than its energy. The densest gas with slightly higher energies is generally gravitationally bound, and therefore its energy is slightly overestimated in our analysis.
5 Discussion
5.1 Summary of main results
Our simulations of AGN outflows in non-spherical geometries reveal three important effects. First of all, the outflow expands in two elongated bubbles in the direction of least resistance, compressing the denser midplane gas into a disc. Secondly, the AGN fast wind outflow predominantly works on the least dense gas, increasing its velocity significantly above that calculated analytically assuming that outflows of ambient gas along different directions are decoupled. Conversely, the dense gas is mostly affected by the ram pressure of the outflow (again contrary to the simplest analytical spherically symmetric model with no energy leakage). Finally, at late times the outflowing bubble rises up from the disc, allowing the disc to evaporate and create an outflowing atmosphere of intermediate density between the disc and the bubble.
These results have implications for the establishment of relation via self-regulation of SMBH feeding. In addition, gas compression implies that star formation can be triggered by the outflow. Finally, the morphology of the outflows suggests that certain observed galaxy properties - namely the presence of bubbles or winds rising from discs - can be driven by wide-angle AGN outflows rather than other processes. We discuss each of these implications in turn.
5.2 relation
The relation derived analytically assumes that the AGN outflow is momentum-driven, at least out to distances several times larger than the sphere of influence of the SMBH (King, 2010b, also see Introduction). More detailed calculations showing that cooling of the wind shock is very inefficient call for significant modifications to this spherically symmetric derivation. Our simulation results show that the energy-driven outflow produces “momentum-like” feedback upon dense gas. Dense gas is pushed away with velocities not much greater than those expected from analytical calculations of momentum-driven winds. Note that since radiative cooling in the ambient gas is efficient in conditions considered here, a large fraction of the gas is dense and hence moves with low velocity; at Myr in simulation Z2R0, half of the outflowing gas has velocities km/s.
We also presented an analytical toy model that allows for the bubble energy escape through low density regions of the shell. This model shows that the critical SMBH mass for such “leaky shells” may in fact be close to the result obtained by King (2003) for spherically symmetric momentum-driven shells. Further numerical work with initial conditions less idealised than used here is needed to test this conclusion numerically.
5.3 Induced star formation
The bipolar outflow is significantly over-pressurized with respect to its surroundings, and therefore expands laterally. This causes the dense gas to be compacted further in the midplane. In simulation Z2R0, diffuse gas filling the bubble has pressure K cm-3, significantly higher than the typical ISM pressure K cm-3 (Wolfire et al., 2003). This has a strong effect on the gas in the disc. In our simulations, the disc and its atmosphere have even higher pressures K cm-3, but this is most likely overestimated by several orders of magnitude due to the adopted temperature floor. Such environments are likely to form stars much more rapidly than typical star-forming regions (Zubovas et al., 2013; Krumholz et al., 2009). Our simulations do not include the relevant physics of star formation feedback, and hence may over-estimate the corresponding star formation rates. Therefore we do not provide quantitative predictions of the effect the outflow has upon the SFR in the galactic disc. We note that Gaibler et al. (2012) found a similar over-pressurizing effect caused by a jet-inflated bubble.
Dense gas also appears in the form of clumps throughout the outflow (see Figure 2, middle and right panels). Morphologically, these clumps are similar to the high-velocity clouds commonly seen in galaxy formation simulations, which have been recently identified as numerical artifacts of standard SPH formulations (Hobbs et al., 2013b). However, we are confident that the presence of clumps in our simulations is a robust conclusion, even if the longevity of individual clumps is overestimated. We think so because of an earlier paper (Nayakshin & Zubovas, 2012), where we showed that these clumps form due to a combination of efficient gas cooling and gravitational instability in the outflow. In addition, Zubovas & King (2014) showed analytically that the formation of cold gas is a very rapid process, and most of the outflowing gas should become molecular. Therefore cold dense gas is expected to exist in the outflow.
5.4 Outflow bubbles – fake jets?
Evidence of bipolar outflows from the centres of galaxies is well-known both in the Milky Way (the Fermi bubbles; Su et al., 2010) and in active galaxies (e.g., Storchi-Bergmann et al., 2007; Veilleux et al., 2001). Quite often, the collimation of the bubbles is taken as evidence that the bubbles are produced by jets (Nesvadba et al., 2008; Guo & Mathews, 2012). Our results show that in fact, a spherically symmetric outflow can be efficiently collimated by the uneven density distribution in the host galaxy and produce elongated bubbles. These bubbles should be intrinsically bright gamma-ray sources due to multiple shock fronts within them (Zubovas & Nayakshin, 2012; King, 2010a) and so could present observational features similar to those of bubbles inflated by jets. This suggests that the mere presence of an outflow bubble does not necessarily indicate past jet activity of the AGN, and that estimates of jet power based on the mechanical power of the bubbles should be taken as upper limits only.
Bipolar bubbles inflated by initially spherical outflows are also a common effect of stellar feedback, mostly supernova explosions (Mac Low & Ferrara, 1999; Tenorio-Tagle & Munoz-Tunon, 1998; Springel & Hernquist, 2003), especially in low-mass galaxies (Dubois & Teyssier, 2008). The AGN-wind-driven outflow bubbles are a natural extension of these models into a higher mass and higher energy regime.
5.5 Pseudo-disc outflows and galactic fountains
The disc “atmosphere”, seen in the non-spherical simulations, contains gas moving with velocities of several hundred km/s in the vertical direction (i.e. directly away from the plane). Such velocities are sometimes large enough for the gas to escape the galaxy in a pseudo-disc wind (we call it “pseudo” because it is not triggered by any process happening in the disc). Other parcels of gas would later fall back on the disc further from the centre, contributing to the galactic fountain.
Disc winds with large velocities ( km/s) have been observed in many galaxies (Shopbell & Bland-Hawthorn, 1998; Coil et al., 2011). These velocities are difficult to achieve by supernova driving alone (Coil et al., 2011), and when they are, only a small fraction of gas can be accelerated to such large velocities (Strickland & Stevens, 2000). Our results suggest that some of these outflows can be caused, fully or in part, by AGN activity. These galaxies may have experienced episodes of AGN activity in the past, and one footprint of this activity is a vertically rebounding disc gas, which launches rapid outflows independently of star formation. Starbursts in such discs may also have been triggered by previous compression due to the AGN outflow.
6 Conclusion
Our numerical experiments showed that energy-conserving spherically-symmetric outflows from SMBHs may create highly aspherical bubbles if the ambient gas in the host galaxy is not spherically distributed. This may lead to a whole host of theoretical and observational implications for SMBH-host galaxy connections.
Firstly, SMBH driving energy-conserving outflows may self-regulate their growth to the momentum-conserving value found by King (2003). This implies that SMBH outflows may actually not lose much energy to radiation, as assumed in the momentum-conserving picture, and be therefore pumping all of their energy into the surrounding ambient gas. As we argued here, however, most of this energy leaks out from the bulge via low density channels and is therefore deposited outside of the bulge, in the halo of the host galaxy or even beyond. This leads to dense gas only being exposed to the ram pressure of the outflow, and thus the critical SMBH mass required to push it away and halt further accretion is very similar to .
Secondly, the observational appearance of SMBH feedback may be deceiving. This point is very important: the interpretation of observed feedback processes in the host galaxies may be incorrect in some cases. For example, wide angle outflow studied here forms biconical structures which may look very much like galaxy-disc outflows driven by starbursts in the discs of the host galaxies. Another potential mis-interpretation of observations could be the buoyant bubbles usually presumed to be inflated by AGN jet activity. The bubbles we obtained here are similarly energetic and are also filled with very high temperature gas where electrons could be potentially accelerated into non-thermal distributions in shocks (as suggested for the Fermi Bubbles by Zubovas & Nayakshin, 2012). If a jet, however weak, was also present in addition to the wide angle outflows studied here, then it could be a simple matter to attribute the bubble’s mechanical power to what is easier to discern in the observations – the jet.
Acknowledgments
We thank the anonymous referee for extensive comments, which helped significantly improve the clarity of the paper. KZ acknowledges the UK STFC for support successively in the form of a PhD studentship and a postdoctoral research position, both at the University of Leicester. This research is partially supported by the Research Council Lithuania grant no. MIP-062/2013.
Numerical simulations presented in this work were carried out on two computing clusters. Some computations were performed on resources at the High Performance Computing Center HPC Sauletekis in Vilnius University Faculty of Physics. This work also used the DiRAC Complexity system, operated by the University of Leicester, which forms part of the STFC DiRAC HPC Facility (www.dirac.ac.uk). This equipment is funded by a BIS National E-Infrastructure capital grant ST/K000373/1 and DiRAC Operations grant ST/K0003259/1. DiRAC is part of the UK National E-Infrastructure.
References
- Aller & Richstone (2007) Aller M. C., Richstone D. O., 2007, ApJ, 665, 120
- Bailin & Steinmetz (2005) Bailin J., Steinmetz M., 2005, ApJ, 627, 647
- Booth & Schaye (2009) Booth C. M., Schaye J., 2009, MNRAS, 398, 53
- Bourne & Nayakshin (2013) Bourne M. A., Nayakshin S., 2013, ArXiv e-prints
- Bower et al. (2006) Bower R. G., Benson A. J., Malbon R., et al., 2006, MNRAS, 370, 645
- Churazov et al. (2005) Churazov E., Sazonov S., Sunyaev R., Forman W., Jones C., Böhringer H., 2005, MNRAS, 363, L91
- Ciotti & Ostriker (1997) Ciotti L., Ostriker J. P., 1997, ApJL, 487, L105+
- Ciotti & Ostriker (2007) Ciotti L., Ostriker J. P., 2007, ApJ, 665, 1038
- Coil et al. (2011) Coil A. L., Weiner B. J., Holz D. E., Cooper M. C., Yan R., Aird J., 2011, ApJ, 743, 46
- Croton et al. (2006) Croton D. J., Springel V., White S. D. M., et al., 2006, MNRAS, 365, 11
- Daddi et al. (2010) Daddi E., Bournaud F., Walter F., et al., 2010, ApJ, 713, 686
- Debuhr et al. (2011) Debuhr J., Quataert E., Ma C.-P., 2011, MNRAS, 412, 1341
- Debuhr et al. (2010) Debuhr J., Quataert E., Ma C.-P., Hopkins P., 2010, MNRAS, 406, L55
- Di Matteo et al. (2008) Di Matteo T., Colberg J., Springel V., Hernquist L., Sijacki D., 2008, ApJ, 676, 33
- Di Matteo et al. (2005) Di Matteo T., Springel V., Hernquist L., 2005, Nature, 433, 604
- Diemand & Moore (2011) Diemand J., Moore B., 2011, Advanced Science Letters, 4, 297
- Dubois et al. (2012a) Dubois Y., Devriendt J., Slyz A., Teyssier R., 2012a, MNRAS, 420, 2662
- Dubois et al. (2012b) Dubois Y., Pichon C., Haehnelt M., et al., 2012b, MNRAS, 423, 3616
- Dubois & Teyssier (2008) Dubois Y., Teyssier R., 2008, A&A, 477, 79
- Everett & Ballantyne (2004) Everett J. E., Ballantyne D. R., 2004, ApJL, 615, L13
- Fabian (1999) Fabian A. C., 1999, MNRAS, 308, L39
- Fabian (2012) Fabian A. C., 2012, ARA&A, 50, 455
- Faucher-Giguère & Quataert (2012) Faucher-Giguère C.-A., Quataert E., 2012, MNRAS, 425, 605
- Feoli & Mancini (2009) Feoli A., Mancini L., 2009, ApJ, 703, 1502
- Ferrarese & Merritt (2000) Ferrarese L., Merritt D., 2000, ApJL, 539, L9
- Feruglio et al. (2010) Feruglio C., Maiolino R., Piconcelli E., et al., 2010, A&A, 518, L155+
- Gaibler et al. (2012) Gaibler V., Khochfar S., Krause M., Silk J., 2012, MNRAS, 425, 438
- Gültekin et al. (2009) Gültekin K., Richstone D. O., Gebhardt K., et al., 2009, ApJ, 698, 198
- Guo & Mathews (2012) Guo F., Mathews W. G., 2012, ApJ, 756, 181
- Häring & Rix (2004) Häring N., Rix H.-W., 2004, ApJL, 604, L89
- Harper-Clark & Murray (2009) Harper-Clark E., Murray N., 2009, ApJ, 693, 1696
- Hobbs et al. (2013a) Hobbs A., Read J., Power C., Cole D., 2013a, MNRAS, 434, 1849
- Hobbs et al. (2013b) Hobbs A., Read J., Power C., Cole D., 2013b, MNRAS, 434, 1849
- King (2003) King A., 2003, ApJL, 596, L27
- King (2005) King A., 2005, ApJL, 635, L121
- King et al. (2013) King A. L., Miller J. M., Raymond J., et al., 2013, ApJ, 762, 103
- King (2010a) King A. R., 2010a, MNRAS, 408, L95
- King (2010b) King A. R., 2010b, MNRAS, 402, 1516
- King & Pounds (2003) King A. R., Pounds K. A., 2003, MNRAS, 345, 657
- King et al. (2011) King A. R., Zubovas K., Power C., 2011, MNRAS, L263+
- Koopmans et al. (2009) Koopmans L. V. E., Bolton A., Treu T., et al., 2009, ApJL, 703, L51
- Krumholz et al. (2009) Krumholz M. R., McKee C. F., Tumlinson J., 2009, ApJ, 699, 850
- Krumholz & Thompson (2013) Krumholz M. R., Thompson T. A., 2013, MNRAS, 434, 2329
- Mac Low & Ferrara (1999) Mac Low M.-M., Ferrara A., 1999, ApJ, 513, 142
- Magorrian et al. (1998) Magorrian J., Tremaine S., Richstone D., et al., 1998, AJ, 115, 2285
- McConnell et al. (2011) McConnell N. J., Ma C.-P., Gebhardt K., et al., 2011, Nature, 480, 215
- McQuillin & McLaughlin (2013) McQuillin R. C., McLaughlin D. E., 2013, MNRAS, 434, 1332
- Murray et al. (2005) Murray N., Quataert E., Thompson T. A., 2005, ApJ, 618, 569
- Nayakshin (2013) Nayakshin S., 2013, MNRAS
- Nayakshin et al. (2009) Nayakshin S., Cha S.-H., Hobbs A., 2009, MNRAS, 397, 1314
- Nayakshin & Zubovas (2012) Nayakshin S., Zubovas K., 2012, MNRAS, 427, 372
- Nesvadba et al. (2008) Nesvadba N. P. H., Lehnert M. D., De Breuck C., Gilbert A. M., van Breugel W., 2008, A&A, 491, 407
- Page et al. (2012) Page M. J., Symeonidis M., Vieira J. D., et al., 2012, Nature, 485, 213
- Pounds et al. (2003a) Pounds K. A., King A. R., Page K. L., O’Brien P. T., 2003a, MNRAS, 346, 1025
- Pounds et al. (2003b) Pounds K. A., Reeves J. N., King A. R., Page K. L., O’Brien P. T., Turner M. J. L., 2003b, MNRAS, 345, 705
- Pounds & Vaughan (2011a) Pounds K. A., Vaughan S., 2011a, MNRAS, 413, 1251
- Pounds & Vaughan (2011b) Pounds K. A., Vaughan S., 2011b, MNRAS, 415, 2379
- Proga et al. (2000) Proga D., Stone J. M., Kallman T. R., 2000, ApJ, 543, 686
- Rupke & Veilleux (2011) Rupke D. S. N., Veilleux S., 2011, ApJL, 729, L27+
- Santini et al. (2014) Santini P., Maiolino R., Magnelli B., et al., 2014, A&A, 562, A30
- Sazonov et al. (2005) Sazonov S. Y., Ostriker J. P., Ciotti L., Sunyaev R. A., 2005, MNRAS, 358, 168
- Shakura & Sunyaev (1973) Shakura N. I., Sunyaev R. A., 1973, A&A, 24, 337
- Shopbell & Bland-Hawthorn (1998) Shopbell P. L., Bland-Hawthorn J., 1998, ApJ, 493, 129
- Sijacki et al. (2007) Sijacki D., Springel V., Di Matteo T., Hernquist L., 2007, MNRAS, 380, 877
- Silk & Nusser (2010) Silk J., Nusser A., 2010, ApJ, 725, 556
- Silk & Rees (1998) Silk J., Rees M. J., 1998, A&A, 331, L1
- Springel (2005) Springel V., 2005, MNRAS, 364, 1105
- Springel (2010) Springel V., 2010, ARA&A, 48, 391
- Springel & Hernquist (2003) Springel V., Hernquist L., 2003, MNRAS, 339, 312
- Storchi-Bergmann et al. (2007) Storchi-Bergmann T., Dors Jr. O. L., Riffel R. A., et al., 2007, ApJ, 670, 959
- Strickland & Stevens (2000) Strickland D. K., Stevens I. R., 2000, MNRAS, 314, 511
- Sturm et al. (2011) Sturm E., González-Alfonso E., Veilleux S., et al., 2011, ApJL, 733, L16+
- Su et al. (2010) Su M., Slatyer T. R., Finkbeiner D. P., 2010, ApJ, 724, 1044
- Tenorio-Tagle & Munoz-Tunon (1998) Tenorio-Tagle G., Munoz-Tunon C., 1998, MNRAS, 293, 299
- Thompson et al. (2005) Thompson T. A., Quataert E., Murray N., 2005, ApJ, 630, 167
- Tombesi et al. (2010) Tombesi F., Cappi M., Reeves J. N., et al., 2010, A&A, 521, A57+
- Tremaine et al. (2002) Tremaine S., Gebhardt K., Bender R., et al., 2002, ApJ, 574, 740
- Veilleux et al. (2001) Veilleux S., Shopbell P. L., Miller S. T., 2001, AJ, 121, 198
- Wagner et al. (2012) Wagner A. Y., Bicknell G. V., Umemura M., 2012, ApJ, 757, 136
- Wagner et al. (2013) Wagner A. Y., Umemura M., Bicknell G. V., 2013, ApJL, 763, L18
- Wolfire et al. (2003) Wolfire M. G., McKee C. F., Hollenbach D., Tielens A. G. G. M., 2003, ApJ, 587, 278
- Zubovas & King (2012a) Zubovas K., King A., 2012a, ApJL, 745, L34
- Zubovas & King (2014) Zubovas K., King A., 2014, ArXiv e-prints
- Zubovas & King (2012b) Zubovas K., King A. R., 2012b, MNRAS, 426, 2751
- Zubovas & Nayakshin (2012) Zubovas K., Nayakshin S., 2012, MNRAS, 424, 666
- Zubovas et al. (2013) Zubovas K., Nayakshin S., King A., Wilkinson M., 2013, MNRAS, 433, 3079