Study of three 2013 novae: V1830 Aql, V556 Ser and V809 Cep
Abstract
photometry and low-, medium- and high-resolution Echelle fluxed spectroscopy is presented and discussed for three faint, heavily reddened novae of the FeII-type which erupted in 2013. V1830 Nova Aql 2013 reached a peak =15.2 mag on 2013 Oct 30.3 UT and suffered from a huge 2.6 mag reddening. After a rapid decline, when the nova was =1.7 mag below maximum, it entered a flat plateau where it remained for a month until Solar conjunction prevented further observations. Similar values were observed for V556 Nova Ser 2013, that peaked near 12.3 around 2013 Nov 25 and soon went lost in the glare of sunset sky. A lot more observations were obtained for V809 Nova Cep 2013, that peaked at =11.18 on 2013 Feb 3.6. The reddening is 1.7 and the nova is located within or immediately behind the spiral Outer Arm, at a distance of 6.5 kpc as constrained by the velocity of interstellar atomic lines and the rate of decline from maximum. While passing at , the nova begun to form a thick dust layer that caused a peak extinction of 5 mag, and took 125 days to completely dissolve. The dust extinction turned from neutral to selective around 6000 Å. Monitoring the time evolution of the integrated flux of emission lines allowed to constrain the region of dust formation in the ejecta to be above the region of formation of OI 7774 Å and below that of CaII triplet. Along the decline from maximum and before the dust obscuration, the emission line profiles of Nova Cep 2013 developed a narrow component (FWHM=210 km/sec) superimposed onto the much larger normal profile, making it a member of the so far exclusive but growing club of novae displaying this peculiar feature. Constrains based on the optical thickness of the innermost part of the ejecta and on the radiated flux, place the origin of the narrow feature within highly structured internal ejecta and well away from the central binary.
keywords:
Stars: novae1 Introduction
Several Galactic novae are regularly missed because of yearly Sun conjunction with the Galactic central regions, where most of them appear, or because the heavy interstellar absorption low on the Galactic plane dims them below the observability threshold. Others are so fast that remains above the detection threshold of equipment used by amateur astronomers (who discover the near totality of Galactic novae), for too short a time to get a fair chance to be discovered (Warner 1989, 2008; Munari 2012). Finally, a significant fraction of those discovered and catalogued lack published data necessary to properly document and characterized them (Duerbeck 1988).
All these deficiencies reflect into still debated statistics about the basic properties of the Galactic novae, like their average number per year or their fractional partnership to Galactic populations like the Bulge, and the Thin Disk and the Thick Disk (della Valle and Livio 1998; della Valle 2002; Shafter 2002, 2008). The latter has long reaching implications about the origin, birth-rate and evolution of binary systems leading to nova eruption, the amount and type of nuclearly-processed material returned to the interstellar medium, the viability of recurrent novae as possible precursors of type Ia supernovae.
Three heavily reddened and faint novae appeared in 2013. V1830 Aql and V556 Ser were rapidly lost in the glare of sunset sky, and the spectroscopic observations here presented could possibly be the only multi-epoch available. V809 Cep was more favourably placed on the sky, but its peak brightnes of just =11.18, the fast decline and the very thick dust cocoon it rapidly developped one month into the decline required a highly motivated effort to conduct a thorough monitoring at optical wavelengths.
As a result of our effort to contribute to the documentation of as many as possible of the less observed novae, in this paper we present the results and analysis of our photometry and low-, medium- and high-resolution fluxed spectroscopy of these three novae.
2 Observations
photometry of the program novae was obtained with the Asiago 67/92cm Schmidt camera and various telescopes operated by ANS Collaboration (N. 11, 30, 62, 73, 157). Technical details of this network of telescopes running since 2005, their operational procedures and sample results are presented by Munari et al. (2012). Detailed analysis of the photometric procedures and performances, and measurements of the actual transmission profiles for all the photometric filter sets in use with ANS Collaboration telescopes is presented by Munari and Moretti (2012). All measurements on the program novae were carried out with aperture photometry, the long focal length of the telescopes and the absence of nearby contaminating stars not requiring to revert to PSF-fitting. All photometric measurements were carefully tied to a local photometric sequence extracted from the APASS survey (Henden et al. 2014) and ported to the Landolt (2009) system of equatorial standards following the transformation equations of Munari (2012). The adopted local photometric sequences were selected to densely cover a color range much larger than that displayed by the nova during its evolution. The sequences were intensively tested during the whole observing campaign for linearity of color equations and for absence of intrinsic variability of any of their constituent stars. The use of the same photometric comparison sequences for all the involved telescopes and for all observations of the novae, ensues the highest internal homogeneity of the collected data. The median value of the total error budget (defined as the quadratic sum of the Poissonian error on the nova and the formal error of the transformation from the local to the standard system as defined by the local photometric sequence) of the photometric data reported in this paper is 0.010 mag for , 0.008 in , 0.007 in , 0.007 in , and 0.008 mag for , 0.008 in , and 0.009 in . Colors and magnitudes are obtained separately during the reduction process, and are not derived one from the other.
![[Uncaptioned image]](/html/1403.3893/assets/x1.png)
Spectroscopic observations of the program novae (see Table 1 for a log), have been obtained with three telescopes.
The ANS Collaboration 0.70m telescope located in Polse di Cougnes and operated by GAPC Foundation is equipped with a mark.I Multi Mode Spectrograph, and obtain low- and medium-resolution spectra well into the deep red because its thick, front illuminated CCD (Apogee ALTA U9000, 30563056 array, 12m pixel, KAF9000 sensor) does not suffer from noticeable fringing. The ANS Collaboration 0.61m telescope operated by Schiaparelli Observatory in Varese and equipped with a mark.II Multi Mode Spectrograph obtains low-, medium- and high-resolution Echelle spectra. The detector is a SBIG ST10XME with KAF-3200ME chip, 21921472 array and 6.8 m pixel, with micro-lenses to boost the quantum efficiency. It also does not suffer from fringing because it is of the thick, front illuminated type. The optical and mechanical design, operation and performances of mark.I, II and III Multi Mode Spectrographs in use within ANS Collaboration are described in detail by Munari and Valisa (2014).
Low resolution spectroscopy of the program novae was obtained also with the 1.22m telescope + B&C spectrograph operated in Asiago by the Department of Physics and Astronomy of the University of Padova. The CCD camera is a ANDOR iDus DU440A with a back-illuminated E2V 42-10 sensor, 2048512 array of 13.5 m pixels. This instrument was mainly used for the observations of the faintest states of the program novae. It is highly efficient in the blue down to the atmospheric cut-off around 3200 Å, and it is normally not used longword of 8000 Å for the fringing affecting the sensor.
The spectroscopic observations at all three telescopes were obtained in long-slit mode, with the slit rotated to the parallactic angle, and red filters inserted in the optical path to suppress the grating second order where appropriate. All observations have been flux calibrated, and the same spectrophotometric standards have been adopted at all telescopes. All data have been similarly reduced within IRAF, carefully involving all steps connected with correction for bias, dark and flat, sky subtraction, wavelength and flux calibration.
3 V1830 Aql (Nova Aql 2013)
Nova Aql 2013 was discovered by K. Itakagi at unfiltered 13.8 mag on Oct. 28.443 UT (cf. CBET 3691) at equatorial coordinates =19h02m33s.35 and =03∘15’19”.0, corresponding to Galactic coordinates =037.12, =01.07. The variable was designated PNV J19023335+0315190 when it was posted at the Central Bureau for Astronomical Telegrams TOCP webpage. Spectroscopic confirmations as a classical nova of the FeII-type were provided by Fujii (2013), Munari (2013) and Takaki et al. (2013). It was later assigned the permanent GCVS designation V1830 Aql (Samus 2013b). At the reported astrometric position, no candidate progenitor is visible on any digitized Palomar I and II Sky Survey plates, and no counterpart is present in the 2MASS catalog. In addition to the discovery observations summarized in CBET 3691, no further information has been so far published on Nova Aql 2013.

3.1 Photometric evolution and reddening
Our , photometry of Nova Aql 2013 is presented in Table 2 and plotted in Figure 1 together with data retrieved from the public AAVSO database. For some dates, the AAVSO data are in the format of a series of rapid measurements (protracted for hours) from the same observer, that we have averaged into a single data point in Figure 1. The reason for that is the large scatter present in these AAVSO time-series. The scatter does not seem related to intrinsic variability of the nova but more likely to the low S/N of individual data points (short exposures with very small telescopes on a very faint nova low on the horizon) and to the absence of proper color-correction of the observations to transfer them from the local to the standard system (the AAVSO measurements are differential with respect to radomly choosen nearby field stars). The very red colors of the nova (far redder than typical surrounding field stars) and the large changes in airmass and sky transparencies encountered during these long time-series runs, suggest the apparent variability present in the AAVSO data to be an observational artifact.
![[Uncaptioned image]](/html/1403.3893/assets/x4.png)
![[Uncaptioned image]](/html/1403.3893/assets/x5.png)
The lightcurve in Figure 1 indicates that the nova was discovered during its rapid rise to maximum. The final portion of the rise to maximum shown in Figure 1 was covered at a rate of 0.45 mag day-1. The maximum was reached at =15.20.05 on HJDmax=2456595.80.2 ( Oct 30.3 UT), that will be taken as reference in the following. The color has remained constant around 2.0 during the recorded photometric evolution, suggesting a very high reddening affecting Nova Aql 2013. In fact, the high galactic latitude and low reddening (=0.18) FeII-type V339 Nova Del 2013 displayed at maximum brightness a color =+0.085 (Munari et al. 2013a). Supposing the reddening corrected ()∘=0.03 of Nova Del 2013 applies also to Nova Aql 2013 at the time of its maximum brightness, the reddening corresponding to the observed =+2.0 would be 2.6 (following the reddening analysis of Fiorucci and Munari 2003 for the Johnson-Cousins photometric system as realized by the Landolt equatorial standards onto which our photometry is accurately placed).
Upon reaching maximum brightness, Nova Aql 2013 bounced off it and immediately begun to decline, as Figure 1 shows. The early decline from maximum was very fast: the first =1.2 mag were covered in just 1.6 days, at a rate of 0.75 mag day-1. The decline than quickly leveled off and proceeded at a much lower pace, about 0.015 mag day-1 for several weeks. The monitoring of the photometric evolution of the nova did not extend after the first month as it became too faint and progressively lost in the bright sky at sunset because of the approaching conjunction with the Sun.
Overall, the light-curve of Nova Aql 2013 in Figure 1 can be best described as a month-long flat plateau following an initial brief surge that brightened the nova about =1.7 mag above the plateau level. As such, the application of standard MMRD (absolute Magnitude at Maximum vs. Rate of Decline) relations would be doubtful. Moreover, at the time the observations had to be terminated because of the conjunction with the Sun, the nova had not yet declined 2 mag from maximum (cf. Figure 1), the minimum amount for which MMRD relations are calibrated.
3.2 Spectroscopy
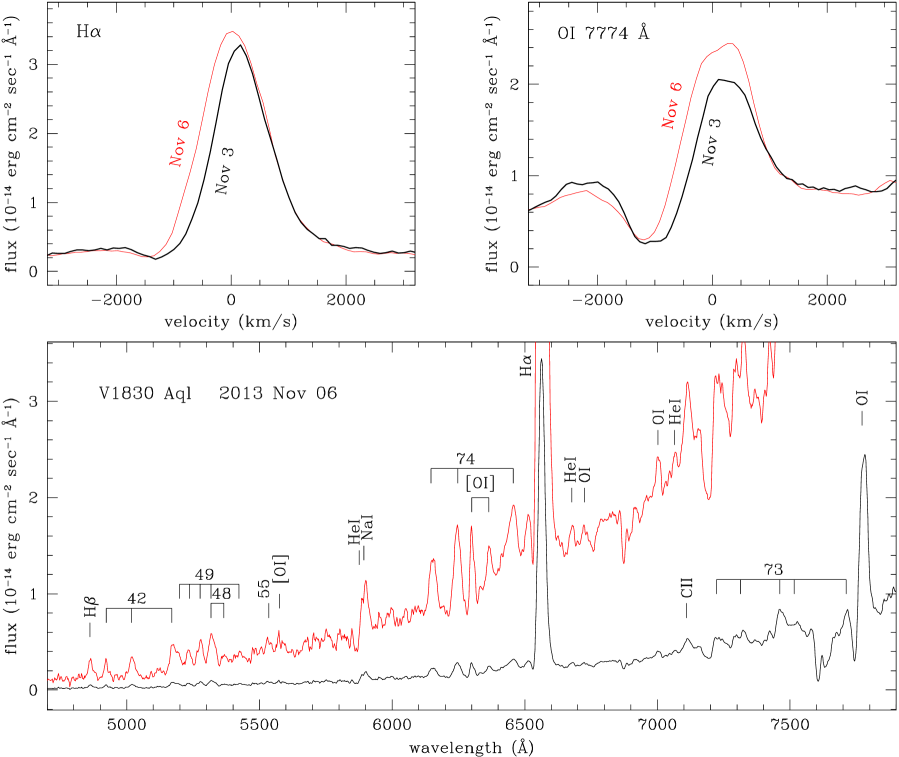
Our fluxed Nov. 6 spectrum of Nova Aql 2013 is shown in Figure 2, its S/N at blue wavelengths being appreciably higher that the spectrum for Nov. 3. The high reddening is evident in the continuum steeply rising toward the red. The spectrum is typical of a FeII-type nova soon after maximum brightness. The usual FeII multiplets N. 42, 48, 49, 55, 73, 74 are readily seen in strong emission (compare with the intensity of nearby H in Figure 2), with additional emissions mainly from NaI and OI. The integrated flux of the measurable emission lines is listed in Table 3, where the impressive flux ratio H/H=160 stands out, another indication of the huge reddening affecting this nova.
The P-Cyg line profiles of H and OI 7774 Å for the two observing dates are highlighted and compared in Figure 2 (top panels). The width of the emission component of both profiles increased between the two dates: from 1090 to 1435 km/sec for H, and from 990 to 1150 km/sec for OI. The blue shift of the absorption component increased between the two dates: from 1350 to 1500 km/sec for H, and from 1090 to 1200 km/sec for OI 7774 Å. This behavior can be interpreted in the simplified framework of ballistic launched spherical ejecta. As ionization spreads through a widening layer of the ejecta, the neutral part is confined to outer, faster moving regions (increasing the negative velocity of the P-Cyg absorption components), while reduction of the optical thickness allows radiation from different parts of the ejecta to contribute to widen the emission component. The H profiles can be accurately fitted by one Gaussian in emission and another in absorption. Some structure is instead present in the OI lines, where the absorption component for Nov 3 is wide and flat bottomed but otherwise symmetrical, while the profile for Nov 6 shows a flat-topped emission component and a sharper absorption with an extended blue wing, suggesting absorbing material radially distributed over a large interval characterized by a range of outwardly increasing ballistic velocities and decreasing local densities.
4 V556 Ser (Nova Ser 2013)
Nova Ser 2013 was discovered as an optical transient by K. Itakagi at unfiltered 12.3 mag on Nov 24.384 UT (cf. CBET 3724) at equatorial coordinates =18h09m03s.46 and =11∘12’34”.5, corresponding to Galactic coordinates =18.21 =+04.17. The variable was designated PNV J18090346-1112345 when it was posted at the Central Bureau for Astronomical Telegrams TOCP webpage. Spectroscopic confirmation and classification as a nova was provided by Munari and Valisa (2013) and Itoh et al. (2013). It was assigned the permanent GCVS designation V556 Ser (Kazarovets 2013). In addition to the discovery observations summarized in CBET 3724, no further information has been so far published on Nova Ser 2013. At the reported astrometric position, no candidate progenitor is visible on digitized Palomar I Sky Survey and SERC plates, and no counterpart is present in the 2MASS catalog. The amplitude of the outburst is therefore at least 9 mag in the optical, and the companion of the erupting white dwarf does not seem to be evolved away from the Main Sequence.
When it was discovered, the nova was only briefly observable very low on the horizon after sunset, when the sky was still bright, making it a very difficult target for observations. This is why we were not able to collect photometric observations of this nova, and why there are no observations logged in the public databases of any amateur astronomer organizations we consulted, VSNET and AAVSO included. The only available photometric data are those collected at the time of discovery by a few observers, and summarized in CBET 3724 that announced the nova. They all come from unfiltered instrumentation and no information is provided about what photometric sequence and what photometric band was used for their reduction/measurement. The nova was reproted at 13 mag on Nov. 22.370 and 23.361, 12.3 mag on Nov 24.384, 11.7 mag on Nov 26.369, and 12.7 mag on Nov 26.373. The last two measurements are essentially simultaneous and still differ by 1 whole magnitude, testifying the unfiltered nature of these measurements, their difficulty and their uncertainty. The best it can be said is that the magnitude of the nova seems to have remained constant around unfiltered 12.2/12.3 mag during the interval Nov 24-26, which could also mark the time of maximum. In Table 1 we adopt the time of discovery on Nov 24.384 as the reference .
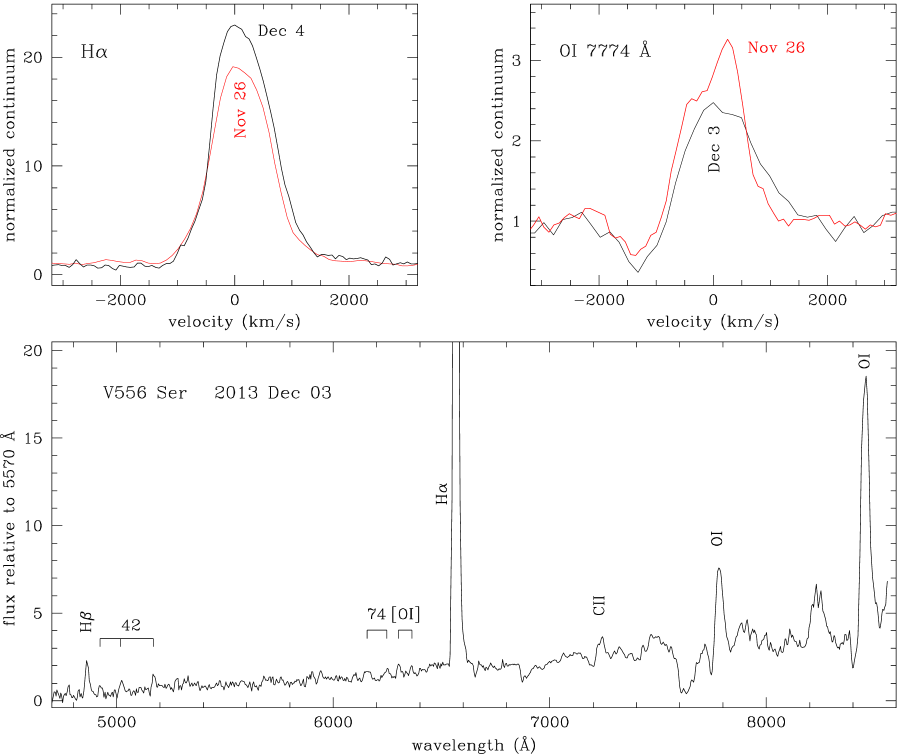
Our spectroscopic observations of Nova Ser 2013, are summarized in Table 1 and cover an interval of 9 days. The best exposed spectrum is that of Dec 3, which is displayed in Figure 3, together with details from the spectra of Nov 26 and Dec 4. While relative fluxes should be correct for the Dec 3 spectrum, the critical observing condition does not allow to confidently fix the zero point of the flux scale. Consequently, the flux is expressed relative to that at 5570 Å, the effective wavelength for the -band for a highly reddened nova (Fiorucci and Munari 2003).
The continuum of the Dec 3 spectrum in Figure 3 rises steeply toward the red with an inclination corresponding to =+1.62, indicative of a high reddening. The strongest emission lines belong to the Balmer series and OI. The H/H flux ratio is 32, confirming the high reddening. The OI 8446 / OI 7774 flux ratio is 3.8, reversed with respect the pure recombination value of 3/5. Even if the large reddening contributes in depressing OI 7774 with respect to OI 8446, it alone cannot justify the large 3.8 flux ratio, which therefore suggests that on Dec 3 the fluorescent pumping of OI 8446 by hydrogen Ly- (as originally proposed by Bowen 1947), was already effective.
Weak emission lines originate from FeII multiplets 42 and 74, and possibly 49 and 73, that allows to classify Nova Ser 2013 as a FeII-nova following Williams (1992). The [OI] 6300, 6364 Å doublet is faintly visible in emission, with a flux ratio of 2.2, indicating mild optically thick conditions.
P-Cyg absorption components are clearly visible in OI 7774 and 8446 Å lines, and absent in Balmer lines (cf. Figure 3). They are symmetric and well fitted by a Gaussian component. On Nov 25 and 26 spectra the absorption is blue shifted by 1400 km/s with respect to the emission component, and by a similar amount on Dec 3 and 4 spectra. On the Dec 3 spectrum, P-Cyg absorption components to FeII multiplet 42 emission lines are present with the same blue-shift as seen in OI 7774 and 8446 lines. The two spectra with the highest resolving power are those for Nov 26 and Dec 4. Their H profiles are compared in the top-left panel of Figure 3. Their FWHM is 1145 km/sec for Nov 26 and 1240 km/sec for Dec 4. The profile for Nov 26 closely resemble a perfect Gaussian, that for Dec 4 is non-symmetric, with a sharper blue side, perhaps suggestive of a superimposed (but not resolved by our low resolution spectra) absorption component or emerging sub-structures.
5 V809 Cep (Nova Cep 2013)
Nova Cep 2013 was discovered by K. Nishiyama and F. Kabashima at unfiltered 10.3 mag on Feb 2.412 UT (cf. CBET 3397) at equatorial coordinates =23h08m04s.71 and =60∘46’52”.1, corresponding to Galactic coordinates =11065, =+0040. It was designated PNV J23080471+6046521 and spectroscopic classification as a FeII nova was provided by Imamura (2013) and by Ayani and Fujii (2013). It was assigned the permanent GCVS designation V809 Cep (Samus 2013a).
Munari et al. (2013b) found in mid-March that the nova was rapidly declining in brightness and inferred it was forming a thick layer of dust in its ejecta. This was later confirmed by the infrared observations from Raj et al. (2013) and Ninan et al. (2013) that found a large infrared excess at bands and a featureless spectrum at wavelengths.
Radio observations of Nova Cep 2013 were obtained by Chomiuk et al. (2013). They detected the nova at 7.4 and 36.5 GHz (4.0 and 0.82 cm) on Mar 22.5, 47 days past maximum optical brightness and 11 days since the onset of dust condensation in the ejecta. Similar and earlier observation performed 10 days past optical maximum yield no detection. Negative radio detection at 1.3 and 0.61 GHz (23 and 49 cm) on June 1 and Aug 23, respectively, led Dutta et al. (2013) to place upper limits to any non-thermal radio emission from the nova.
Finally, Chomiuk et al. (2013) tried to record X-ray and ultraviolet emission from Nova Cep 2013 with Swift satellite observations carried out Feb 8.3 and 22.1 (4.7 and 18.5 days past optical maximum). The nova was not detected in X-rays on both epochs, while the UVOT UVM2 ultraviolet magnitudes (central wavelength = 2246 Å) were 20.0 and 19.5, respectively.
5.1 Photometric evolution
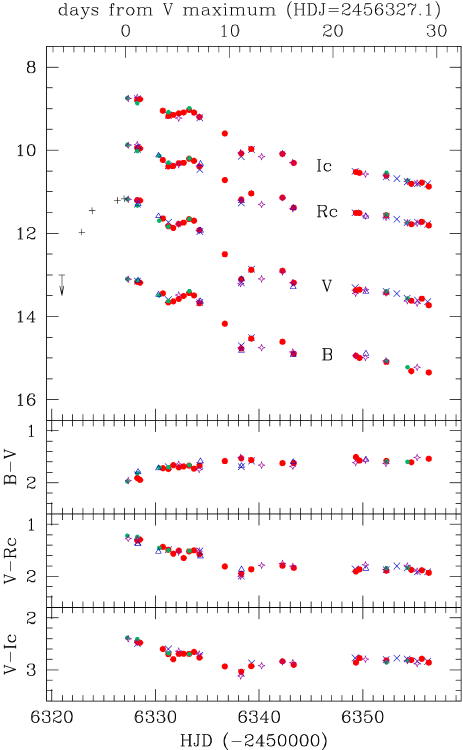
Our photometric observations of Nova Cep 2013 are presented in Table 4 and plotted in Figures 4 and 5. Combining with the pre-discovery data summarized in CBET 3397, it allows to fix the maximum to have occoured on Feb 3.60.2 (JD=2456327.1) at =11.181 mag, =+1.967, =+1.248, =+2.394. These colors are very red for a nova and suggest a huge interstellar reddening. The time required to decline by 2 and 3 mag has been =16, =36 days for the band and =25, =37 days for the band, respectively. Following the classification summarized by Warner (1995), they qualify Nova Cep 2013 as a fast nova. The magnitude 15 days past maximum was =13.07 and =14.75 mag.
Soon after reaching maximum, Nova Cep 2013 started the decline that proceeded smoothly for the first four days, after which the nova took two days to rise toward something resembling a secondary maximum, and then resumed the decline but with some fluctuations up to 0.25 mag in amplitude. Eventually, by day 20 and 2.0 mag below maximum, the nova settled onto a smooth decline that proceeded until day 36 when, while the nova was passing right through , it begun to rapidly form dust in the ejecta.
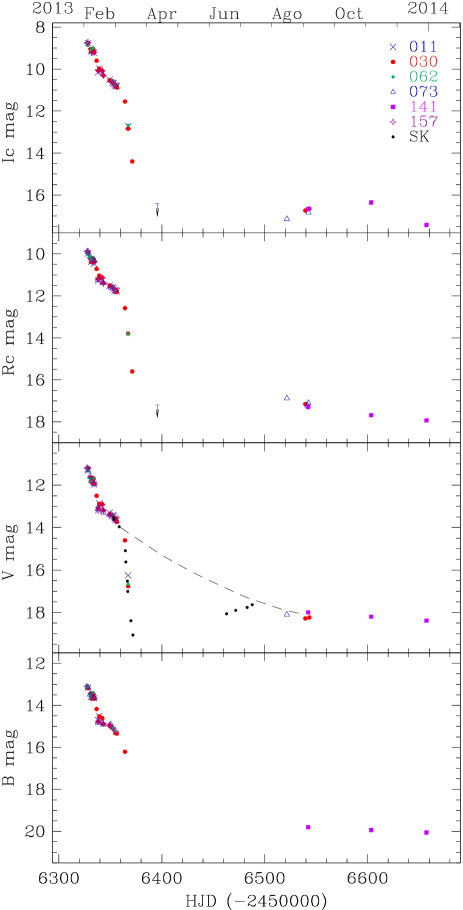
The nova progressively recovered from the dust obscuration episode during June and July, and by late July it resumed the normal decline, that continued smoothly until our last photometric observation, 330 days past the optical maximum when the nova was measured at =18.39, =7.2 mag fainter than maximum.
5.2 Dust formation
![[Uncaptioned image]](/html/1403.3893/assets/x9.png)
Most dust-forming novae start the condensation when they are between 3 and 4 mag below maximum (McLaughlin 1960, hereafter McL60; Warner 1989). Assuming a smooth photometric behavior, the available data allows to fix the onset of dust formation to March 12.0 0.5 UT (JD=2456363.5), when the nova was at =14.2 and exactly transiting at . Our closest in time observation was obtained on March 13.767, when dust condensation had just begun and was causing a fading of =0.40 mag. We measured =1.49, essentially the same (or even slightly bluer) as before the onset of dust condensation, while and rapidly became redder. The fact that the wavelength-dependent absorption efficiency of the dust turned from neutral to selective around 6000 Å suggests a prevalent carbon composition with a diameter of dust grains of the order of 0.1 m (Draine and Lee 1984; Kolotilov, Shenavrin and Yudin 1996). Nova Cep 2013 behaved closely similar to Nova Aql 1993 (Munari et al. 1994): this FeII nova was characterized the same , of Nova Cep 2013, similarly started to condense dust when transiting exactly at , and its dust also turned from neutral to selective absorption around 6000 Å. It is also worth noticing that Nova Cep 2013 is placed right on the relation by Williams et al. (2013) between the decline time and the time of dust condensation .
The dust condensation in Nova Cep 2013 proceeded at a fast pace: the nova dropped by =2.5 during the first 3.0 days, and after 8.5 days it was 4.7 mag below the extrapolated decline in absence of dust condensation. For comparison, the prototype of dust-condensing novae, Nova DQ Her 1934, dropped by =4.0 mag in 6.6 days (Martin 1989). The shape of the light-curve in Figure 5 strongly suggests that dust continued to condense for a while past JD 2456372 (when the last observation of the declining branch in Figure 5 was obtained), thus bringing the peak extinction well in excess of 5 mag in band (in DQ Her it was =8.0 mag). The dust layer was therefore completely optically thick at visual wavelengths. The fast pace of dust condensation suggests that the sticking efficiency of condensible elements onto dust grain nucleation sites was very high. The nova was re-acquired at optical wavelengths by mid June, and by mid July the emersion from the dust obscuration was completed and the nova resumed the normal decline. From the start of dust condensation to the end of obscuration, about 125 days passed (115 days in DQ Her).
There are a few infrared observations of Nova Cep 2013 obtained at the time of dust condensation. On April 26.95, 82 days past maximum brightness and 46 days past the onset of dust condensation, Raj et al. (2013) measured Nova Cep 2013 at =13.2, =10.6, =8.2. The large =+5.0 color corresponds to a black-body temperature of the order of 700 K. Such low temperatures are seen in novae forming thick layers (Gehrz et al. 1992, Gehrz 2008, Evans and Gehrz 2012), while the temperature is hotter in novae with thinner dust shells (Mason et al. 1996, Munari et al. 2008, Banerjee and Ahosk 2012). In both cases, the temperature of the dust declines with time, as the ejecta dilute in the circumstellar space. According to observations by Ninan et al. (2013), the infrared brightness of Nova Cep 2013 further increased after Raj et al. (2013) performed their observations. On June 23, Ninan et al. obtained =7.40, when the nova was quite advanced in the re-emersion from the dust obscuration, being just =1.0 mag below the extrapolated decline in absence of dust (cf Figure 5). On July 8, at =0.5 mag, Ninan et al. (2013) measured =7.84. On the same date, they recorded a spectrum in the wavelength range covered by the band (from 2.04 to 2.35 m) and found a featureless continuum still dominated by emission from dust.

5.3 Reddening
van den Bergh and Younger (1987) derived a mean intrinsic color =0.23 0.06 for novae at maximum and =0.02 0.04 for novae at . For Nova Cep 2013 we measured =+1.97 at the time of maximum and =+1.62 at (averaging from =+1.64 at , and =+1.60 at ). Comparing with van den Bergh and Younger (1987) intrinsic colors, this indicates a reddening of =1.7.
Munari (2014) has calibrated on many Galactic novae a relation between and the equivalent width of the diffuse interstellar band visible at 6614 Å. This DIB has an equivalent width of 0.378 Å on our Echelle spectrum of Nova Cep 2013 for Feb 07.819, the one with the highest S/N, and the corresponding reddening is =1.66.
Our Echelle spectra show that both lines of the NaI D1,2 doublet are splinted into two lines of nearly equal intensity, at heliocentric radial velocities of 14 and 57 km/s. Comparing with the Brand and Blitz (1983) map of the velocity field of the interstellar medium in our Galaxy, the 14 km/s component is associated with the crossing of the Perseus Arm, while the 57 km/s with the crossing the Outer Arm. The line of sight to Nova Cep 2013 crosses the Outer Arm at a distance of 6 kpc from the Sun, which is therefore a lower limit to the distance of the nova. The NaI interstellar lines are core saturated at the high reddening affecting Nova Cep 2013, while the KI 7699 Å interstellar line is still on the optically thin linear part of its relation with . Our Echelle spectra are somewhat noisy at such red wavelengths, and we have independently repeated several times the measurement of KI 7699 Å line on our Echelle spectra for Feb 04.813 and Feb 07.819, finding equivalent widths between the extrema 0.37 and 0.43 Å. Following the calibration by Munari and Zwitter (1997) this corresponds to 1.61.9, in excellent agreement with the values derived from the color of the nova and the intensity of the DIB 6614 Å.
We therefore adopt in this paper =1.7 as the reddening affecting Nova Cep 2013, that translates into an extinction of =7.25 and =5.45 mag for a standard =3.1 reddening law. The large H/H60 flux ratio observed before the onset of the dust obscuration agrees with the large reddening affecting this nova.
5.4 Distance
Both the and decline rates and the observed magnitude 15 days past optical maximum are popular means to estimating the distance to novae.
The relation between absolute magnitude and , takes the form . There are several different calibrations of and available. The relations of Cohen (1988) and Downes and Duerbeck (2000, hereafter DD00) for provide distances to Nova Cep 2013 of 5.1 and 6.3 kpc, and those of Schmidt (1957) and DD00 for distances of 4.6 and 5.6 kpc, respectively. Approximating , the relation by Capaccioli et al. (1989) for gives a distance of 4.7 kpc, and those of Pfau (1976) and de Vaucouleurs (1978) for result in distances of 5.5 and 4.7 kpc, respectively. The average over all above estimates provides a distance of 5.2 kpc to Nova Cep 2013, while the average limited to the two determinations from the most recent calibration by DD00 is 6.0 kpc.
Buscombe and de Vaucouleurs (1955) suggested that all novae have the same absolute magnitude 15 days after maximum light. The distance to Nova Cep 2013 turns out to be 3.7, 4.4, 3.7, 4.0, 4.6, 4.9, 4.2 and 4.7 kpc using the calibrations by Buscombe and de Vaucouleurs (1955), Cohen (1985), van den Bergh and Younger (1987), van den Bergh (1988), Capaccioli et al. (1989), Schmidt (1957), de Vaucouleurs (1978), and Pfau (1976), respectively. Their average is 4.3 kpc, a distance appreciably shorter than above inferred from and . This difference is appreciably reduced if the most recent calibration by DD00 is used for the absolute magnitude 15 days past maximum, that provides 5.4 kpc for Nova Cep 2013
Another classical MMRD relation uses a specific stretched shaped curve, which is apparent in samples of extragalactic novae. It was first suggested in analytic form by Capaccioli et al. (1989). Its revision by della Valle and Livio (1995) provides a distance of 6.4 kpc to Nova Cep 2013, that increases to 7.0 kpc for the revision proposed by DD00.
Summing up, the distance derived from the magnitude 15 days past maximum falls appreciably shorter than the minimum distance of 6 kpc inferred by the interstellar absorption lines associated to the line-of-sight crossing the Outer Arm. Similarly short turns out the distance inferred from old calibrations of the MMRD based on and times, while the most recent one from DD00 agrees with the 6 kpc lower limit. Good agreement is also found for distance inferred from the stretched shaped curve for the MMRD relation. The straight average of the valid distances is 6.5 kpc, that we adopt in this paper and that places Nova Cep 2013 within or immediately behind the Outer spiral arm.
5.5 Progenitor
At that time of the last photometric observation of Nova Cep 2013 logged in Table 4, +330 days past optical maximum, the optical spectra were totally dominated by nebular lines (see sect. 6 and Figure 6). The nebular lines disappear when the ejecta completely dissolve into the interstellar space. If those line are removed from the spectra, the flux declines by 2.2 mag. It therefore may be concluded that 330 days past maximum the central binary was fainter than 20.6, in agreement with the absence of a nova progenitor recorded on Palomar I and II plates.
There is no 2MASS source at the position of Nova Cep 2013. Examining the 2MASS catalog for the 300 sources within 3 arcmin of the nova position, the detection of infrared sources appear complete to =16.25 and to =15.50, while the faintest sources score =17.1 and =15.9. Adopting intrinsic colors from Koornneef (1983), absolute magnitudes from Sowell et al. (2007) and color-dependent reddening relation from Fiorucci and Munari (2003), at the distance and reddening above estimated for Nova Cep 2013, these limits completely rule out a luminosity class III giant as the donor star, because such giant would shine several magnitudes above the 2MASS completeness threshold. A K0IV, that represents the faint limit of the subgiant branch, would shine at =17.0 and =15.4, while a K3IV/III star, that marks the bright end of the subgiant branch, would shine at =15.4 and =13.8. Comparing with the 2MASS completness limit we conclude that the donor star in Nova Cep 2013 is on or still close to the main sequence.
6 Spectral evolution
The spectral evolution of Nova Cep 2013 over the wavelength range of Cousins’ and bands (55009000 Å) is illustrated in Figure 7, while Figure 6 shows the spectral appearance at bluer wavelengths at four key times: (a) maximum brightness, (b) close to and before the onset of dust formation, (c) during dust formation, and (d) one year past optical maximum, when the dust was fully dissolved and the nova was very faint and returning into the obscurity from which it arose.
The appearance and evolution is that of a typical FeII-nova. At maximum, in addition to Balmer, OI, NaI, the most prominent emission lines were those of FeII, in particoular the multiplets 42, 48, 49, 55, 73 and 74. All these lines had deep P-Cyg absorption components at that time (Figure 6). With respect to the emission component, on day +1.2 the core and terminal velocity of the absorption components were 675 and 1360 km/s for NaI, 620 and 1270 for OI 7774 Å, 920 and 1830 for OI 8446 Å, 800 and 1750 for FeII 42, with an average FWHM=800 km/s for their emission component. As usual, these velocities grew with time. On day +27, the core of the absorption for OI 7774 and 8446 Å reached 2100 km/s, and 2500 for NaI. The evolution of H and its absorption systems is illustrated in Figure 9 and discussed in sect. 6.2.
Figure 7 nicely depicts the interplay in the evolution of key emission lines in the far red spectra of FeII novae. Close to maximum CaII triplet is in strong emission, stronger than OI 8446 and with the ratio OI 7774 / OI 8446 1 (in a pure recombination, optically thin case this ratio should be 5/3). At later epochs, OI 8446 first equals and then rapidly surpasses in intensity the CaII triplet (as a consequence of increasing ionization of the ejecta), while in parallel the OI 7774 / OI 8446 ratio rapidly diminishes, an indication of emerging Ly- flourescence.
6.1 Evolution of emission line flux with time and across dust formation
Figure 8 highlights the evolution of integrated absolute fluxes (thus independent of the behaviour of underlying continuum) of representative emission lines. For compactness and an easier comparison with the photometric lightcurves of Figure 4 and 5, the integrated flux of the emission lines is expressed in magnitudes with respect to the highest measured value (which is 1.1810-11 erg cm-2 sec-1 for CaII triplet lines, 1.0710-11 for OI 7774 Å, 6.4210-13 for FeII multiplet 74 lines, 6.8410-13 for [OI] 6300 Å, 4.4210-11 or H and 2.2110-11 for OI 8446 Å). Figure 8 is particoularly interesting because it includes data from the spectrum obtained on day +40.2, when the dust was already causing an extinction of =3.1 mag of the underlying continuum. In Figure 8, the vertical dashed line marks the time when dust begun condensing in the ejecta. The two curves, one solid and one dotted, that repeats identical in each panel, show for the band the observed and expected decline in absence of dust formation, respectively (imported from Figure 5). These two curves have been scaled to the position expected for a given emission line at the time of the start of dust condensation, obtained from a low order polynomial fit to the earlier data. There is of course some arbitrarity in this extrapolation and an actual spectrum taken closer in time to the start of dust condensation would have been most useful in this regard, but unfortunately none is available. The aim of Figure 8 is to investigate the relative location of emission lines, continuum and dust formation sites within the ejecta assuming a spherically symmetric shape for them. Similar plots of the evolution with time of the integrated fluxes of selected emission lines is presented by Munari et al. (2008) for the slightly faster FeII nova V2362 Nova Cyg 2006 which also formed dust, but in much lower quantity than for Nova Cep 2013.

For the following discussion, it is relevant to note that the degree of ionization of the ejecta was not appreciably changing across the onset of dust condensation. In fact, In Figure 6 on the spectrum for day +40.2 no significant [OIII] emission lines are seen. Appearance of strong [OIII] lines normally mark the transition from optically thick to optically thin conditions (McL60), when high ionization rapidly spreads through the ejecta. Shore and Gehrz (2004) suggested that incresing ionization induces rapid grain growth in novae, but this did not happened in Nova Cep 2013. The +40.2 spectrum was obtained about four days past onset of grain condensation, when the dust was already causing a large reduction in the photo-ionizing input flux from the underlying pseudo-photosphere. Were four days enough to significantly affect the ionization balance in the ejecta ? Actually not. In fact, the recombination time scale of the ionized ejecta goes like (Ferland 2003):
| (1) |
where and are the electron temperature and density, respectively. The presence of a strong [NII] 5755 emission line in the day +40.2 spectrum suggests that the electronic density was below the critical value for this line at 6104 cm-3, which corresponds to a recombination time scale of 1 year for any reasonable assumption about the electronic temperature. In summary, from the point of view of the photo-ionization balance, the ejecta evolved smoothly between the two spectra obtained on day +29.2 and +40.2.
The behaviour of CaII triplet and OI 7774 Å represents the extrema of the observed evolution of emission lines across the dust formation episode.

CaII triplet lines reached their maximum flux 7 days past optical maximum. Their evolution was very smooth, essentially unaffected by the condensation of dust. CaII is easily ionized and the triplet lines form from low excitation levels, 3.13 eV above ground state. As ionization progresses through the ejecta along the decline from maximum, the location of formation of CaII lines is therefore rapidly pushed outward. Figure 8 tells us that the dust condensed in the part of the ejecta internal to the outer layer from where CaII lines originate.
The flux of OI 7774 Å line dropped by as much as the continuum radiation, indicating that it formed in a region of the ejecta close to the pseudo-photosphere and fully internal to the layer where dust formed. OI 7774 Å forms from a high upper energy level, 10.7 eV above ground state, populated mainly during recombination of OII. The proximity to the pseudo-photosphere is confirmed by the continued presence of P-Cyg absorption to this line even on spectra for both day +29.2 and +40.2, when P-Cyg absorptions were already gone for all the other lines and still weakly present only in Balmer series lines.
The behavior of these two lines confines the region of dust formation to the central layer of the ejecta. The attenuation across dust condensation of the other lines considered in Figure 8 (between 1.0 and 1.5 mag), indicates that the region where they formed is the same where dust formed. In fact, assuming that in the region of dust formation the density of dust and of emitting gas scales similarly with distance, an extinction of 1.45 mag is expected for a line forming exactly in the same layer as the dust, of 1.3 mag if 10% of the line flux forms above the dust layer, of 1.1 mag if this proportion rises to 20%.
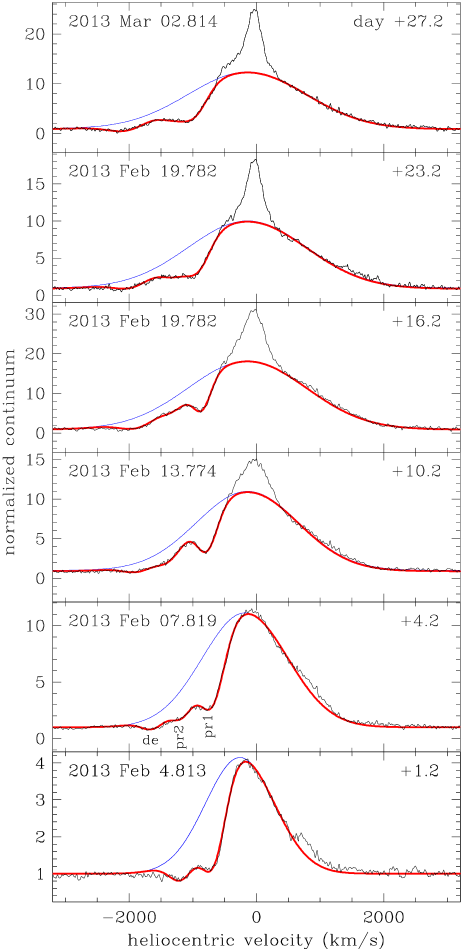
6.2 Evolution of H profile and its absorption systems
The evolution of the H emission line profile before the onset of dust formation is shown in Figure 9 from Echelle high resolution observations. During the first week, the profile is simple and characterized by the usual combination of a broad emission component and various blue-shifted and sharper superimposed absorption components (Payne-Gaposchkin 1957, McL60, Munari 2014). Later on, an unusual central peak appeared superimposed to these standard components, and this peak became progressively sharper, from FWHM=500 km/s on day +10.2 to 210 km/s on day +27.2. The broad emission and the multiple absorption components of the H profiles have been fitted with Gaussians and the resulting fit superimposed in Figure 9 to the actual observed profile. The fit is particularly good and the heliocentric velocity and width of the individual Gaussians are listed in Table 5.
The radial velocity of the emission component became less negative and its width increased with time. This is the effect of a progressively decreasing optical thickness of the expanding ejecta, that allows more direct radiation from internal strata and from the receding side to reach the observer.
On the first spectrum of Figure 9, two absorption components are present. They correspond to the principal absorption system described by McL60 from old photographic spectra and by Munari (2014) from modern CCD observations. This absorption system is normally observed as a single component, but sometimes - as in this case - is splinted in two. Other novae with splinted principal absorption lines were, for ex., Nova Gem 1912, Nova Aql 1918 and Nova Cyg 2006. The second spectrum in Figure 9 was obtained at day +4.2, and shows the appearance at larger velocities of the diffuse-enhanced absorption system, which is characterized by a single component at all epochs covered by our observations. As the ionization spreads through the ejecta, the neutral regions where these absorptions can form have to move outward in mass, involving progressively faster moving ejecta, with the result that the velocity of the absorptions grows more negative with time. This is well confirmed by Figure 10 that plots versus time the velocities of the various absorption components listed in Table 5, and shows how they follow nice linear trends. Similar linear trends have been reported for other recent FeII dust forming novae, like Nova Cyg 2006 (Munari et al. 2008) and Nova Scuti 2009 (Raj et al. 2012).
![[Uncaptioned image]](/html/1403.3893/assets/x14.png)

Data summarized by McL60 show a correlation between the mean radial velocity of the various absorption systems and the speed class of the nova. The McL60 velocity relation for the principal system is = 3.57 0.5, and predicts 930 km/s for Nova Cep 2013, in excellent agreement with the observed 960 km/s, which is obtained by averaging components 1 and 2 in Table 5. The McL60 relation for the diffuse enhanced system is = 3.71 0.4, and predicts 1700 km/s velocity for Nova Cep 2013, in good agreement with the 1800 km/s average of the value reported in Table 5. It is worth noticing that the pre-maximum absorption system, clearly present in early epochs spectra of Nova Cyg 2006 and Nova Scuti 2009, is apparently missing in Nova Cep 2013. The McL60 4750/ relation indicates, in the case of Nova Cep 2013, a velocity of 250 km/sec for the pre-maximum system. This is close to the velocity of the narrow component that became obvious at later epochs, so there could be some filling-in at earlier epochs that prevented detection of the pre-maximum absorption system.

When Nova Cep 2013 emerged from dust obscuration, the spectrum had turned into a deep nebular one, and was dominated by [OIII] 4959 and 5007, [NII] 5755, 6548 and 6854, and [OII] 7325 Å (cf. Figure 6), with only a feeble trace of H still visible. Figure 11 presents the emission line profiles (from low res spectra) for [OIII] 5007 Å and [NII] 6548, 6584 Å + H at days +220 and +352, now dominated by a double peak with a velocity separation of 1160 km/sec. This traces an outward bulk velocity of just 600 km/s, largely lower than that characterizing the absorption systems and the broad emission seen in the early phases, reaching 2000 and 1000 km/sec, respectively.
This is a manifestation of the dilution with time of the ejecta into the interstellar space. At early phases, the emission line profiles are dominated by the outer and faster moving material, and radiation from the inner part of the ejecta does not reach the observer because of the large optical depth of outer ejecta. As the ejecta expand and thin, more radiation from the inner and slower regions of the ejecta contribute to the spectra. The emissivity of the gas is proportional to the number of recombinations per unit time, i.e. to the local electron density that goes down like ( ) for an initial ballistic launch of the ejecta. Consequently, at the time of spectra at days +220 and +352, the emissivity of the outer regions was essentially nulled by the great dilution, and only the inner and slower ejecta were still able to contribute to observed spectra, resulting in the much slower expansion velocity inferred from the separation of the double peaked emission lines of Figure 11.
6.3 Late appearance of a narrow component in H
One unusual spectroscopic feature of Nova Cep 2013 deserves to be highlighted: the appearance of a narrow component superimposed on the broad underlying profile of H. As shown in Figure 9, this component was first visible at FWHM=500 km/sec on the H profile for day 10.2. The component rapidly narrowed, reaching FWHM=210 km/sec on day +27.2. The low S/N of the other emission lines on our Echelle spectra limits the possibility to assess the presence of the narrow component on other lines. We can only say that it was surely present for the OI 8446 Å line, and perhaps also for the OI 7774 Å line. The detection of the narrow component on the H profile has been possible only thanks to the high resolution of our Echelle spectra. Lower resolution data - as normally obtained for novae - would have missed it entirely.
Attention to narrow components is a recent affair. Their presence in Nova Oph 2009 was modelled by Munari et al. (2011) with an equatorial ring in a prolate system with polar blobs, in Nova Mon 2012 by Ribeiro et al. (2013) as a density enhancement toward the wrist of a bipolar structure. In some other novae the sharp component is instead believed to originate from the central binary and to trace (restored) accretion (Mason et al. 2012, Walter & Battisti 2011). Nova KT Eri 2009 seems to be a transitional case, showing the narrow component coming from both the ejecta as, at later times, from the accreting central binary (Munari, Mason and Valisa 2014).
The narrow component in Nova Cep 2013 become progressively visible as the outer ejecta were thinning and the inner ejecta were emerging into view. It originates from spatially structured inner ejecta, and cannot be associated with emission from the central binary for two basic reasons: (1) it was observed at a time when the ejecta were still optically thick and thus blocking direct view of the core of the system. The large optical thickness at that time is confirmed by the non detection of super-soft X-ray radiation (Krautter 2008) from the nova in the Swift observations by Chomiuk et al. (2013) for Feb 22.1 (day +18.5), when the narrow component was already strong, and (2) the flux radiated by the narrow component amounts to 3.710-12 erg cm-2 sec-1 (straight average over the similar values for day +10.2, +16.2, +23.2 and +27.2). Transforming this flux into a photometric magnitude, the narrow component alone would shine as a star of 15.0 mag. Considering that the progenitor was fainter than the 20 mag plate limit for Palomar II red plates, the narrow component alone radiated in the band 100 more than the progenitor in quiescence, a condition incompatible with an origin of the narrow component from the central binary.
7 Acknowledgements
We are grateful to Elena Mason for useful discussions and careful reading of the manuscript.
References
- Ayani & Fujii (2013) Ayani K., Fujii M., 2013, CBET, 3397
- Banerjee & Ashok (2012) Banerjee D.P.K., Ahosk, N. M. 2012, in Noave from Radio to Gamma Rays, D.J. Saikia and G.C. Anupama eds., BASI, 40, 243
- Bowen (1947) Bowen I. S., 1947, PASP, 59, 196
- Brand & Blitz (1993) Brand J., Blitz L., 1993, A&A, 275, 67
- Buscombe & de Vaucouleurs (1955) Buscombe W., de Vaucouleurs G., 1955, Obs, 75, 170
- Capaccioli et al. (1989) Capaccioli M., della Valle M., Rosino L., D’Onofrio M., 1989, AJ, 97, 1622
- Chomiuk et al. (2013) Chomiuk L., et al., 2013, ATel, 4950, 1
- Cohen (1985) Cohen J. G., 1985, ApJ, 292, 90
- Cohen (1988) Cohen J. G., 1988, ASPC, 4, 114
- della Valle (2002) della Valle M., 2002, in ”Classical Nova Explosions”, M. Hernanz and J. Jose eds., AIPC, 637, 443
- della Valle & Livio (1995) della Valle M., Livio M., 1995, ApJ, 452, 704
- della Valle & Livio (1998) della Valle M., Livio M., 1998, ApJ, 506, 818
- de Vaucouleurs (1978) de Vaucouleurs G., 1978, ApJ, 223, 351
- Downes & Duerbeck (2000) Downes R. A., Duerbeck H. W., 2000, AJ, 120, 2007
- Draine & Lee (1984) Draine B. T., Lee H. M., 1984, ApJ, 285, 89
- Durbeck (1988) Durbeck H. W., 1988, ”A Reference Catalogue and Atlas of Galactic Novae”, ApL&C, 27, 286
- Dutta et al. (2013) Dutta P., Kantharia N. G., Roy N., Anupama G. C., Ashok N. M., Banerjee D. P. K., 2013, ATel, 5375, 1
- Evans & Gehrz (2012) Evans A., Gehrz R. D., 2012, in ”Novae from Radio to Gamma Rays”, D.J. Saikia and G.C. Anupama eds., BASI, 40, 213
- Ferland (2003) Ferland G. J., 2003, ARA&A, 41, 517
- Fiorucci & Munari (2003) Fiorucci M., Munari U., 2003, A&A, 401, 781
- Fujii (2013) Fujii M., 2013, CBET, 3691
- Gaposchkin (1957) Gaposchkin C. H. P., 1957, The Galactic Novae, North-Holland
- Gehrz (2008) Gehrz R.D. 2008, in ”Classical Novae” 2nd ed., M. F. Bode and A. Evans eds., Cambridge Univ. Press, 167
- Gehrz et al. (1992) Gehrz R. D., Jones T. J., Woodward C. E., Greenhouse M. A., Wagner R. M., Harrison T. E., Hayward T. L., Benson J., 1992, ApJ, 400, 671
- Henden (2014) Henden, A. et al. 2014, AJ, submitted
- Imamura (2013) Imamura K., 2013, CBET, 3397
- Itoh (2013) Itoh, R., Kanda, Y., Moritani, Y., Kawabata, K. S. 2013, CBET, 3724
- Kazarovets (2013) Kazarovets E. V., 2013, IAUC, 9264
- Kolotilov, Shenavrin, & Yudin (1996) Kolotilov E. A., Shenavrin V. I., Yudin B. F., 1996, ARep, 40, 81
- Koornneef (1983) Koornneef J., 1983, A&A, 128, 84
- Krautter (2008) Krautter J., 2008, in ”Classical Novae” 2nd ed., M.F. Bode and A. Evans eds., Cambridge University Press, pag. 232
- Landolt (2009) Landolt A. U., 2009, AJ, 137, 4186
- Martin (1989) Martin P. G., 1989, in ”Classical Novae”, M. F. Bode and A. Evans eds., John Wiley & Sons, 93
- Mason et al. (1996) Mason C. G., Gehrz R. D., Woodward C. E., Smilowitz J. B., Greenhouse M. A., Hayward T. L., Houck J. R., 1996, ApJ, 470, 577
- Mason et al. (2012) Mason E., Ederoclite A., Williams R. E., della Valle M., Setiawan J., 2012, A&A, 544, A149
- McLaughlin (1960) McLaughlin D. B., 1960, in ”Stellar Atmospheres”, J.L.Greenstein ed., Univ. Chicago Press, pag 585
- Munari (2012) Munari U., 2012, JAVSO, 40, 582
- Munari (2013) Munari U., 2013, CBET, 3691
- Munari (2014) Munari, U. 2014, in “Stellae Novae: Future and past decades”, P. A. Woudt and V. A. R. M. Ribeiro (eds), ASP Conf. Ser., in press
- Munari et al. (1994) Munari U., Yudin B. F., Kolotilov E. A., Shenavrin V. I., Sostero G., Lepardo A., 1994, A&A, 284, L9
- Munari et al. (2008) Munari U., et al., 2008, A&A, 492, 145
- Munari et al. (2011) Munari U., Ribeiro V. A. R. M., Bode M. F., Saguner T., 2011, MNRAS, 410, 525
- Munari et al. (2012) Munari U., et al., 2012, BaltA, 21, 13
- Munari et al. (2013a) Munari U., Henden A., Dallaporta S., Cherini G., 2013a, IBVS, 6080, 1
- Munari et al. (2013b) Munari U., Dallaporta S., Cherini G., Castellani, F., Cetrulo, G., Valisa P., Graziani M. 2013b, ATel, 4893
- Munari et al. (2014) Munari, U., Mason, E., Valisa, P. 2014, A&A, in press
- Munari & Moretti (2012) Munari U., Moretti S., 2012, BaltA, 21, 22
- Munari & Valisa (2013) Munari U., Valisa P., 2013, CBET, 3724
- Munari & Valisa (2014) Munari, U., Valisa, P. 2014, in ”Observing techniques, instrumentation and science for metre-class telescopes”, T. Pribulla and R. M. Komzik eds., CAOSP, in press
- Munari & Zwitter (1997) Munari U., Zwitter T., 1997, A&A, 318, 269
- Nakano (2013) Nakano S., 2013, CBET, 3724
- Ninan et al. (2013) Ninan J. P., Ojha D. K., Ghosh S. K., Anupama G. C., Prabhu T. P., Bhatt B. C., 2013, ATel, 5269, 1
- Pfau (1976) Pfau W., 1976, A&A, 50, 113
- Raj, Banerjee, & Ashok (2013) Raj A., Banerjee D. P. K., Ashok N. M., 2013, ATel, 5026
- Raj et al. (2012) Raj A., Ashok N. M., Banerjee D. P. K., Munari U., Valisa P., Dallaporta S., 2012, MNRAS, 425, 2576
- Ribeiro, Munari, & Valisa (2013) Ribeiro V. A. R., Munari U., Valisa P., 2013, ApJ, 768, 49
- Samus (2013a) Samus N. N., 2013a, IAUC, 9260
- Samus (2013b) Samus N. N., 2013b, IAUC, 9263
- Schmidt (1957) Schmidt T., 1957, ZA, 41, 182
- Shafter (2002) Shafter A. W., 2002, in ”Classical Nova Explosions”, M. Hernanz and J. Jose eds., AIPC, 637, 462
- Shafter (2008) Shafter, A. W. 2008, in ”Classical Novae” 2nd ed., M. F. Bode and A. Evans eds., Cambridge Univ. Press, 335
- Shore & Gehrz (2004) Shore S. N., Gehrz R. D., 2004, A&A, 417, 695
- Sowell et al. (2007) Sowell J. R., Trippe M., Caballero-Nieves S. M., Houk N., 2007, AJ, 134, 1089
- Takaki et al. (2013) Takaki K., Itoh R., Kanda Y., Kawabata S., 2013, CBET, 3691
- van den Bergh (1988) van den Bergh S., 1988, PASP, 100, 8
- van den Bergh & Younger (1987) van den Bergh S., Younger P. F., 1987, A&AS, 70, 125
- Walter & Battisti (2011) Walter, F.M., Battisti, A., 2011, AAS, 21733811
- Warner (1989) Warner B., 1989, in ”Classical Novae”, M. F. Bode and A. Evans eds., John Wiley & Sons, 1
- Warner (1995) Warner B., 1995, ”Cataclysmic Variable Stars”, Cambridge Astrophys. Ser. 28
- Warner (2008) Warner B., 2008, in ”Classical Novae 2nd ed.”, M. F. Bode and A. Evans eds., Cambridge Univ. Press, 16
- Williams (1992) Williams R.E. 1992, AJ 104, 725
- Williams et al. (2013) Williams S. C., Bode M. F., Darnley M. J., Evans A., Zubko V., Shafter A. W., 2013, ApJ, 777, L32
![[Uncaptioned image]](/html/1403.3893/assets/x17.png)