Antiferroelectricity in thin film ZrO2 from first principles
Sebastian E. Reyes-Lillo, Kevin F. Garrity and Karin M. Rabe
Department of Physics and Astronomy, Rutgers University, Piscataway, NJ 08854-8019
Abstract
Density functional calculations are performed to investigate the experimentally-reported field-induced phase transition in thin-film ZrO2 (J. Mller et al., Nano. Lett. 12, 4318). We find a small energy difference of 1 meV/f.u. between the nonpolar tetragonal and polar orthorhombic structures, characteristic of antiferroelectricity. The requisite first-order transition between the two phases, which atypically for antiferroelectrics have a group-subgroup relation, results from coupling to other zone-boundary modes, as we show with a Landau-Devonshire model. Tetragonal ZrO2 is thus established as a previously unrecognized lead-free antiferroelectric with excellent dielectric properties and compatibility with silicon. In addition, we demonstrate that a ferroelectric phase of ZrO2 can be stabilized through epitaxial strain, and suggest an alternative stabilization mechanism through continuous substitution of Zr by Hf.
pacs:
77.84.-s81.05.Zx, 77.65.Bn,
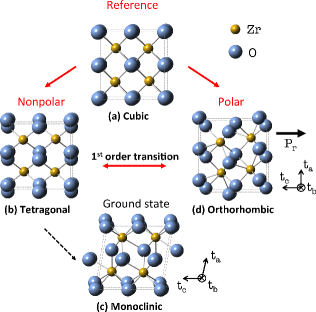
Zirconia (ZrO2) is a high-k dielectric Bohr2007 , chemically and structurally similar to HfO2, and likewise is a candidate for dynamic random access memory (DRAM) applications Kittl2009 ; Hwang2010 and complementary metal-oxide-semiconductor (CMOS) devices Choi2011 ; Panda2013 . Bulk ZrO2 has a high-symmetry cubic (Fmm) structure (Fig. 1(a)) above 2400 K, and a tetragonal (P42/nmc) structure (Fig. 1(b)) between 2400 K and 1200 K Ruh1968 . The tetragonal structure is related to the cubic structure by freezing in an unstable mode Mirgorodsky1995 and is nonpolar. Below 1200 K, ZrO2 is monoclinic (P21/c) (Fig. 1(c)). The first-order transition from the tetragonal phase to the monoclinic phase changes the coordination number of Zr from 8 to 7 and increases the volume by 5 %.
In light of the extensive research which has been conducted over the past fifty years on this relatively simple dielectric, the recent report of antiferroelectric-like double-hysteresis loops in thin film ZrO2Muller2012 at first seems rather surprising. In thin film ZrO2, the tetragonal-monoclinic transition temperature is suppressed and the structure is tetragonal at room temperature Garvie1978 ; Kim2004 ; Keun2008 ; in contrast, thin film HfO2 is monoclinic at room temperature and exhibits simple dielectric behavior. The field-induced polar phase in ZrO2, which appears above a critical field on the order of 2 MV/cm, is isostructural with the ferroelectric phases that have been observed in thin films of HfO2 doped with Al SMueller2012a , Y Muller2011a , Gd SMueller2012b , Si Boscke2011a ; Boscke2011b and Sr Schenk2013 , as well as in (Hf1/2Zr1/2)O2 thin films Muller2011b ; Park2013 . The structure of the polar phase is orthorhombic (Pca21) Kisi1989 and corresponds to a distortion of the high-symmetry cubic structure, as depicted in Fig. 1.
Antiferroelectrics have recently been the subject of increasing interest Rabe2013 . The characteristic electric-field-induced transition from a nonpolar to a strongly polar phase is the source of functional properties and promising technological applications. Non-linear strain and dielectric responses due to the phase switching are useful for transducers and electro-optic applications Berlincourt1966 ; Zhang2009 . The shape of the double hysteresis loop suggests applications in high-energy storage capacitors Jaffe1961 ; Love1990 . In addition, an electro-caloric effect can be observed in systems with a large entropy change between the two phases Mischenko2006 . While most attention has focused on PbZrO3 and related perovskites Tan2011 , a recent theoretical materials design search Bennett2013 suggested that there are many more antiferroelectric compounds to be discovered.
Figure 1: Experimentally reported phases of ZrO2: (a) Cubic (Fmm), (b) Tetragonal (P42/nmc), (c) Monoclinic (P21/c) and (d) Orthorhombic (Pca21).
In this work, we use first-principles calculations to provide clear evidence that the tetragonal phase of ZrO2 is a previously unrecognized antiferroelectric material, and that the behavior observed in thin films is intrinsic. We find a remarkably small energy difference of 1 meV per formula unit (meV/f.u.) between the nonpolar tetragonal and polar orthorhombic structures, which is a key characteristic of antiferroelectricity Singh1995 ; Johannes2005 ; Reyes-Lillo2013 ; Lasave2007 . We show with a polynomial expansion of the energy that the requisite first-order transition between nonpolar and polar phases, which in the present case, atypically for antiferroelectrics, have a group-subgroup relation, results from coupling to other zone-boundary modes. This novel mechanism for antiferroelectricity provides a basis for broader searches for antiferroelectric materials with optimal functional properties. In addition, we demonstrate that the polar phase of ZrO2 can be stabilized through epitaxial strain, and we discuss the possibility of ferroelectricity in the solid solution (Zr1-xHfx)O2.
Density-functional theory (DFT) calculations are performed using version 7.4.1 of ABINITGonze2009 and the local-density approximation (LDA). We use a plane-wave energy cutoff of 680 eV, and a Monkhorst-Pack sampling of the Brillouin zone Monkhorst1976 for all structural optimizations. Polarization was calculated on a grid using the modern theory of polarization King-Smith1993 as implemented in ABINIT. We used norm-conserving pseudopotentials from the Bennett-Rappe library Bennett2012 with reference configurations: Zr ([Kr]4d05s0), Hf ([Xe]4f145d0.56s0) and O ([He]2s22), generated by the OPIUM code opium .
Table 1 reports relaxed bulk energies and lattice constants for the experimentally observed bulk phases of ZrO2. Our results are in good agreement with previous first principles results Jansen1991 ; Lowther1999 ; Rignanese2001 ; Zhao2002a . The monoclinic phase is the lowest energy structure, consistent with experiments. Experimental lattice constants Ding2012 ; Jin2003 ; Kisi1989 ; Jovalekic2008 are underestimated by 1 %, typical for LDA. The spontaneous polarization of the orthorhombic structure was found to be Pr 58 C/cm2.
Table 1: Energy (meV/f.u.), volume expansion () and lattice parameters (latt.) in Å (: monoclinic angle) of the experimental phases of ZrO2.
Table 2: Wave-vector () in reciprocal lattice units (2/a0) and eigenvector of the structural modes contained in the Pca21 structure, specified by the independent non zero displacements. With Zr at the origin, O1 at a0/4(111) and O2 at a0/4(11). and are the computed and experimental mode amplitudes, defined as described in the text.
Zr
O1
O2
uz
uz
uz
0
ux
ux
0
ux
ux
0
uy
uy
0
uz
uz
0
uy
uy
ux
0
0
uy
0
0
0.259
0.499
0.377
0.394
0.392
0.119
0.159
0.089
0.233
0.491
0.335
0.376
0.381
0.111
0.158
0.086
We begin by discussing the energy-lowering distortions of the cubic phase of ZrO2. The zone-boundary mode corresponds to an antipolar displacement of oxygen atoms in the direction. It is the single instability exhibited in the first-principles phonon dispersion of the high-symmetry cubic structure Parlinski1997 and, as mentioned above, leads to the tetragonal P42/nmc phase with amplitude 0.319 Å and 4-fold axis along . We find that the tetragonal structure is a local minimum, with no unstable modes. Therefore, even though the symmetry analysis shows that the transition from the -polarized tetragonal structure to the orthorhombic Pca21 phase is allowed to be second order, the field-induced transition is expected to be first order.
The distortion relating the tetragonal P42/nmc structure to the polar orthorhombic Pca21 phase can be decomposed into symmetry-adapted modes of the high-symmetry cubic Fmm structure. Mode amplitudes are computed with respect to eigenvectors normalized to 1 Å. Table 2 shows excellent agreement between first principles () and experimental () values of the mode amplitudes. There are six nonzero modes in addition to the mode: , , , , and fm-3m-irrep . The zone-center mode corresponds to a polar displacement of the zirconium atoms relative to the oxygen atoms in the direction. The three modes involve antipolar displacements of planes of oxygen atoms. The amplitudes of the and modes are relatively small.
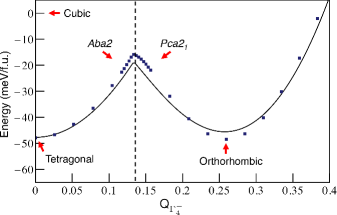
We explore the field-induced tetragonal-to-orthorhombic transition by performing relaxations of the structures obtained by linear interpolation of the atomic positions, holding fixed the value of the polar mode amplitude . Fig. 2 shows the energy of the polar structure as a function of . For small values of , the energy of the system increases, as expected for freezing in a stable mode. The induced polar structure has an orthorhombic space group Aba2, different from that of the polar orthorhombic Pca21 phase, and relaxes back to the tetragonal phase if the constraint is removed. At 0.134 Å, we find an energy cusp with magnitude E 35 meV/f.u., which separates the Aba2 structure with Q0 and Q=0, from the Pca21 phase with Q0 pca21-variant . Above this threshold value, the system volume expands ( 1.5 %), and the structure relaxes to the polar orthorhombic Pca21 phase if the constraint is removed. Assuming that the critical field EC required to overcome the energy barrier is given by EC E / VC PC (with PC = 36 C/cm2 and VC=32.9 Å3/f.u., the first principles values of polarization and volume at the barrier), we estimate the critical field as EC 4.7 MV/cm.
Figure 2: First-principles calculations (squares) and Landau-Devonshire model (solid line) of the energy profile between tetragonal and orthorhombic phases.
In order to characterize this unusual energy surface, we describe the energetics of a single orthorhombic Pca21 variant based on an expansion around the minimum-energy tetragonal P42/nmc structure using modes of the high-symmetry Fmm structure as a basis set:
where is a function to be determined below. The invariance of the term originates in the fact that the expansion is around a structure of lower symmetry than the structure used to construct and label the modes (for details, see
Supplemental Material supp-mat ).
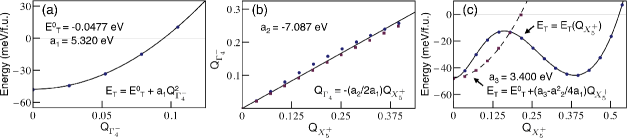
The values of the coefficients are obtained by fitting the model to first principles calculations. By freezing in in the tetragonal phase, and relaxing the structure with constrained to zero, we extract the values of and (Fig. 4 (a)). For the two sets of structures obtained by freezing in , and separately ==, and relaxing, we obtain the energies and the relaxed values of . By fitting the relaxed values of to the expression =(a2/2a1) obtained for both structures by minimizing Eq. (1) with respect to , we extract the value of (Fig. 4 (b)). Finally, we use the computed energies of these two sets of structures to obtain = and as a spline interpolation (Fig. 4 (c)).
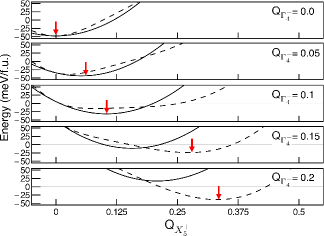
Figure 3: Energy (ET) as a function of Q (solid line) and Q (dashed line) at fixed values of the mode amplitude Q. The red arrows show the global energy minimum for each value of Q.
Using the model we can reproduce the energy cusp of Fig. 2 by plotting
as a function of . As shown in Fig. 2, the model is able to capture the essential elements of the energy landscape: the position and height of the energy barrier, the two local minima and the energy difference between them. The disagreement between first principles and the model can be attributed to the truncation of the expansion in Eq. (1). The cusp is caused by the multiple local minima displayed by the energy as a function of the X mode, with a small change in the value of causing a switch between two local minima (Fig. 3).
Figure 4: First-principles calculations (circles and squares) and model fitting (solid and dashed lines). (a) Energy of the polar Aba2 structure as a function of with =0. (b) as a function of = (circles) and = (squares) (c) Energy of the polar Pca21 structure as a function of = (circles) and = (squares).
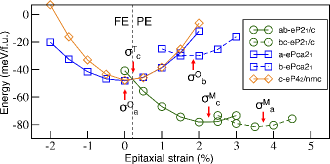
We investigate the effect of epitaxial strain on the relative stability of the tetragonal, orthorhombic, and monoclinic phases. Epitaxial strain is simulated through “strained-bulk” calculations Pertsev1998 ; Dieguez2005 . We denote the epitaxially (e) strained Pca21 structure as ePca21, and indicate the matching plane by a prefix labelling the normal to the plane (for example, normal vector ta yields a-ePca21).
Fig. 5 shows the calculated epitaxial strain diagram for ZrO2. As expected from the dissimilar lattice constants, the equilibrium energy strains () for the three phases and various matching planes are quite different (=2.3% and =3.8% for monoclinic, =0.0% and =1.9% for orthorhombic, and =0.2% for tetragonal phases, respectively). The computed values of are in excellent agreement with the estimates obtained by comparing the relevant relaxed lattice vectors with the reference lattice constant a0=5.03 Å, as discussed in Reyes-Lillo2013 .
For large values of tensile strain ( %), the monoclinic phases are highly favorable in energy. As the strain is decreased, the relative stability of the monoclinic phase is reduced and the tetragonal and orthorhombic phases become favorable. In the strain range from % to %, the tetragonal and orthorhombic phases are very close in energy. In this regime, if the appearance of the lower-energy monoclinic phase is suppressed by surface effects Garvie1978 ; Kim2004 ; Keun2008 or other means Fischer2008a ; Fischer2008b , the system is expected to be antiferroelectric. For large values of compressive strain ( %), the ferroelectric structure a-ePca21 is favored. While within the accuracy of our calculations it is not possible precisely to predict the critical strains that will be observed in experiments, we expect stabilization of ferroelectricity at accessible values of compressive strain.
Figure 5: Epitaxial strain diagram for ZrO2. FE and PE refer to ferroelectric and paraelectric ground state.
Finally, as an illuminating comparison with ZrO2, we consider the stability of the corresponding tetragonal, orthorhombic, and monoclinic structures in HfO2. The calculated lattice constants for the structures of HfO2 are shown in Table 3. The smaller ion size of Hf+4 compared to Zr+4 explains the reduced lattice constants of HfO2, in good agreement with previous calculations Zhao2002b . The computed spontaneous polarization of 60 C/cm2 is consistent with previous results Clima2014 . The main difference between ZrO2 and HfO2 is the higher relative energy of the tetragonal structure in HfO2, so that the polar orthorhombic structure is favored over the nonpolar tetragonal phase by 23 meV/f.u. This suggests that isovalent substitution of Zr by Hf will favor the polar orthorhombic phase in thin films of (Zr1-xHfx)O2, consistent with Refs. Muller2012, ; Muller2011b, ; Park2013, .
Estimation of the minimum energy strains for the relevant structures of HfO2 gives similar values to the case of ZrO2 (=2.4% and =3.7% for monoclinic, =% and =% for orthorhombic, and =0.2% for tetragonal structures, respectively). Therefore, the epitaxial strain diagram should be similar to that of ZrO2 (Fig. 5) but with the epitaxial strain curve of the tetragonal structure shifted higher by 23 meV/f.u. Based on this, we speculate that ferroelectricity would be observed in HfO2 over a wide range of epitaxial strain if the monoclinic ground state were suppressed.
Table 3: Energy (meV/f.u.), lattice constants (Å), monoclinic angle (), and volume expansion () for the ZrO2-type phases of HfO2.
Phase
a
b
c
Cubic
Tetragonal
Orthorhombic
Monoclinic
0
-22.5
-45.1
-93.2
4.89
4.90
5.07
4.95
4.88
5.06
4.95
4.89
5.08
99.53
0
1.3
3.4
7.0
In summary, the experimentally observed field-induced ferroelectric transition corresponds to an intrinsic behavior of thin-film ZrO2. The tetragonal-to-orthorhombic antiferroelectric transition is explained as a field-induced first-order transition where the polar mode is stabilized from the cubic phase by a coupling with two zone-boundary modes. Our results suggest that a ferroelectric phase could be favored over the antiferroelectric phase by appropriate epitaxial strain or isovalent substitution of Zr for Hf. The absence of toxic elements and the compatibility of ZrO2 with silicon make these results especially relevant for technological applications.
I Acknowledgments
We thank S. V. Kalinin, T. Mikolajick, J. Mller, T. Schenk, D. G. Schlom, U. Schrder, and D. Vanderbilt for valuable discussions. S.E.R.-L. would like to thank S. Trolier-McKinstry and C. Randall for their hospitality at MRI-Penn State. This work was supported by the Office of Naval Research Grant No. N00014-12-1-1040. S.E.R.-L. would also like to thank the support of Conicyt and the sponsor of Fulbright Foundation.
References
(1) M. T. Bohr, R. S. Chau, T. Ghani and K. Mistry, Spectrum, IEEE 44 (10), 29 (2007).
(2) J. A. Kittl et al., Microelectron. Eng. 86 (7-9), 1789 (2009).
(3) S. K. Kim, S. W. Lee, J. H. Han, B. Lee, S. Han and C. S. Hwang, Adv. Funct. Mater. 20 2989 (2010).
(4) D. Panda and T. -Y. Tseng, Thin Solid Films 531, 1 (2013).
(5) J. H. Choi, Y. Mao, J. P. Chang, Mater. Sci. Eng. R 72 (6), 97 (2011).
(6) R. Ruh, H. J. Garrett, R. F. Domagala, N. M. Tallan, J. Am. Ceram. Soc. 51 (1), 23 (1968).
(7) A. P. Mirgorodsky, M. B. Smirnov, P. E. Quintard and T. Merle-Mejean, Phys. Rev. B 52, 9111 (1995).
(8) J. Mller, T. S. Bscke, U. Schrder, S. Mueller, D. Bruhaus, U. Bttger, L. Frey, and T. Mikolajick, Nano. Lett. 12, 4318 (2012).
(9) K. S. Keun and C. S. Hwang, Electrochem. and Solid-State Lett. 11, G9 (2008).
(10) H. Kim, P. C. McIntyre, K. C. Saraswat, J. Mater. Res. 19 (2), 643 (2004).
(11) R. C. Garvie, J. Phys. Chem., 82, 218 (1978).
(12) S. Mueller, J. Mueller, A. Singh, S. Riedel, J. Sundqvist, U. Schroeder, and T. Mikolajick, Adv. Funct. Mater. 22 (11), 2412 (2012).
(13) J. Mller, U. Schrder, T. S. Bscke, I. Mller, U. Bttger, L. Wilde, J. Sundqvist, M. Lemberger, P. Kcher, T. Mikolajick, and L. Frey, J. Appl. Phys. 110, 114113 (2011).
(14) S. Mueller, C. Adelmann, A. Singh, S. Van Elshocht, U. Schroeder and T. Mikolajick, ECS J. Solid State Sci. Technol. 1 (6), N123-N126 (2012).
(15) T. S. Bscke, St. Teichert, D. Bruhaus, J. Mller, U. Schrder, U. Bttger, and T. Mikolajick, Appl. Phys. Lett. 99, 112904 (2011).
(16) T. S. Bscke, J. Mller, D. Bruhaus, U. Schrder and U. Bttger, Appl. Phys. Lett. 99, 102903 (2011).
(17) T. Schenk, S. Mueller, U. Schroeder, R. Materlik, A. Kersch, M. Popovici, C. Adelmann, S. Van Elshocht, and T. Mikolajick, ESSDERC (2013).
(18) J. Mller, T. S. Bscke, D. Bruhaus, U. Schrder, U. Bttger, J. Sundqvist, P. Kcher, T. Mikolajick, and L. Frey, Appl. Phys. Lett. 99, 112901 (2011).
(19) M. H. Park, H. J. Kim, Y. J. Kim, W. Lee, T. Moon, and C. S. Hwang, Appl. Phys. Lett. 102, 242905 (2013).
(20) E. H. Kisi, C. J. Howard and R. J. Hill, J. Am. Ceram. Soc. 72, 1757 (1989).
(21) K. M. Rabe, in Functional Metal Oxides: New Science and Novel Applications, ed. by Satish Ogale and V. Venkateshan, Wiley (2013).
(22) D. Berlincourt, IEEE Trans. Sonics Ultrason., 13, 116 (1966).
(23) S-T. Zhang, A. B. Kounga, W. Jo, C. Jamin, K. Seifert, T. Granzow, J. Rdel, and D. Damjanovic, Adv. Mater. 21, 1 (2009).
(24) B. Jaffe, Proc. IRE, vol 49, 1264 (1961).
(25) G. R. Love, J. Am. Ceram. Soc., vol 73, 323 (1990).
(26) A. S. Mischenko, Q. Zhang, J. F. Scott, R. W. Whatmore, N. D. Mathur, Science, vol 311, 1270 (2006).
(27) X. Tan, C. Ma, J. Frederick, S. Beckman, and K. G. Webber, J. Am. Ceram. Soc. 94[2], 4091 (2011).
(28) J. W. Bennett, K. F. Garrity, K. M. Rabe, and D. Vanderbilt, Phys. Rev. Lett. 110, 017603 (2013).
(29) D. J. Singh, Phys. Rev. B 52, 12559 (1995).
(30) M. D. Johannes and D. J. Singh, Phys. Rev. B 71, 212101 (2005).
(31) S. E. Reyes-Lillo and K. M. Rabe, Phys. Rev. B 88, 180102 (2013).
(32) J. Lasave, S. Koval, N. S. Dalal, and R. L. Migoni, Phys. Rev. Lett. 98, 267601 (2007).
(33) X. Gonze, B. Amadon, P. Anglade, J. M. Beuken, F. Bottin, P. Boulanger, F. Bruneval, D. Caliste, R. Caracas, M. Cote et al., Comput. Phys. Commun. 180, 2582 (2009).
(34) H. J. Monkhorst and J. D. Pack, Phys. Rev. B 13, 5188 (1976).
(35) R. D. King-Smith and D. Vanderbilt, Phys. Rev. B 47, R1651 (1993).
(36) J. W. Bennett, Phys. Procedia 34, 14 (2012).
(37) http://opium.sourceforge.net
(38) H. J. F. Jansen, Phys. Rev. B 43, 7267 (1991)
(39) G. -M. Rignanese, F. Detraux, X. Gonze, and A. Pasquarello, Phys. Rev. B 64, 134301 (2001).
(40) X. Zhao and D. Vanderbilt, Phys. Rev. B 65, 075105 (2002).
(41) J. E. Lowther, J. K. Dewhurst, J. M. Leger, and J. Haines, Phys. Rev. B 60, 14485 (1999).
(42) H. Ding, A. V. Virkar and L. Feng, Solid State Ionics 215, 16 (2012).
(43) J. Jin, Y. Taek-Yung, K. Y. Woon, P. H. Min. W. Fan-Xin, Z. Jin, H. Taeghwan, J. of the Amer. Chem. Soc. 125, 6553 (2003).
(44) C. Jovalekic, M. Zdujic, D. Poleti, Lj. Karanovic, M. Mitric, J. Sol. Stat. Chem. 181, 1321 (2008).
(45) K. Parlinski, Z-. Q. Li, and Y. Kawazoe, Phys. Rev. Lett. 78, 4063 (1997).
(46) Note that each of these modes transform as a single partner function of a multidimensional irrep of Fmm.
(47) We note the fact that freezing or alone in the tetragonal structure gives rise to a Pca21 structure distinct from the orthorhombic phase of ZrO2 considered here.
(48) See Supplemental Material at [URL will be inserted by publisher] for a description of the structural modes and the construction of the invariants using group theory.
(49) N. A. Pertsev, A. G. Zembilgotov, and A. K. Tagantsev, Phys. Rev. Lett. 80, 1988 (1998).
(50) O. Dieguez, K. M . Rabe and D. Vanderbilt, Phys. Rev. B 72, 144101 (2005).
(51) D. Fischer, and A. Kersch, Appl. Phys. Lett. 92, 012908 (2008).
(52) D. Fischer, and A. Kersch, J. Appl. Phys. 104, 084104 (2008).
(53) X. Zhao and D. Vanderbilt, Phys. Rev. B 65, 233106 (2002).
(54) S. Clima, D. J. Wouters, C. Adelman, T. Schenk, U. Schroeder, M. Jurczak, and G. Pourtois, Appl. Phys. Lett. 104, 092906 (2014).