[Fe II] EMISSIONS ASSOCIATED WITH THE YOUNG INTERACTING BINARY UY AURIGE 11affiliation: Subaru Telescope, National Astronomical Observatory of Japan, 650 North A‘ohōkū Place, Hilo, HI 96720, USA
Abstract
We present high resolution 1.06 – 1.28 m spectra toward the interacting binary UY Aur obtained with GEMINI/NIFS and the AO system Altair. We have detected [Fe II] 1.257 m and He I 1.083 m lines from both UY Aur A (the primary source) and UY Aur B (the secondary). In [Fe II] UY Aur A drives fast and widely opening outflows with an opening angle of 90∘ along a position angle of 40∘, while UY Aur B is associated with a redshifted knot. The blueshifted and redshifted emissions show complicated structure between the primary and secondary. The radial velocities of the [Fe II] emission features are similar for UY Aur A and B: 100 km s-1 for the blueshifted emission and 130 km s-1 for the red-shifted component. The He I line profile observed toward UY Aur A comprises a central emission feature with deep absorptions at both blueshifted and redshifted velocities. These absorption features may be explained by stellar wind models. The He I line profile of UY Aur B shows only an emission feature.
stars: low-mass — stars:formation — stars: pre-main-sequence
1 INTRODUCTION
UY Aur is a close binary system composed of classical T Tauri stars separated by 089 (Close et al., 1998; Duchêne et al., 1999; Hioki et al., 2007). Joy & van Biesbroeck (1944) was the first to identify the binarity of UY Aur. The secondary source UY Aur B is an infrared companion with a large extinction; A22 - 12 magnitude (Koresko et al., 1997). The spectral types of the primary and secondary sources are M0 and M2.5, respectively (Hartigan & Kenyon, 2003). In the optical forbidden emission lines of [O I] and [S II], Hirth, Mundt, & Solf (1997) identified a redshifted jet (HH 386) extending over a few arcseconds along a position angle (PA) of 220∘. They also reported that a blueshifted jet was evident in 1992 December. The driving source of the jets was not clear in their data, however; UY Aur A, B, or both sources. In their wide-field survey McGroarty et al. (2004) have since failed to detect the optical jets beyond what was discovered by Hirth et al.
Molecular hydrogen emission has also been detected from UY Aur, though only from the secondary source, the infrared companion UY Aur B. This emission was interpreted as arising from accretion shocks associated with the circumstellar disk (Herbst et al., 1995). The circumbinary disk around UY Aur is the second such disk that has been resolved and imaged after the GG Tau A system. It was resolved for the first time in a millimeter interferometer survey (Dutrey et al., 1994). Duvert et al. (1998) found that the 13CO gas in the circumbinary disk is in Keplerian rotation and estimated the total mass of the binary as 1.2 M☉. Using orbital parameters derived from observations obtained as far back as 1944, Close et al. (1998) estimated the total mass of the binary to be 1.61 . The PA of the semi-major axis of the circumbinary disk is 135∘; the inclination angle of the disk is 42 3∘ with respect to the line of sight. High spatial resolution near infrared imaging with adaptive optics (AO) has also revealed inner cavity betwen the circumstellar and circumbinary disks as well as clumpy structure in the circumbinary disk (Close et al., 1998; Hioki et al., 2007). The inner cavity or gap (i.e. the region with relatively low density) is produced by a continuous transfer of angular momentum from the binary to the outer circumbinary disk (Artymowicz et al., 1991). Indeed, Artymowicz & Lubow (1996) and Rozyczka & Laughlin (1997) showed that material in the outer disk can penetrate the inner gap and episodically accrete onto the lower mass secondary star, provided the material has sufficiently high viscosity and temperature. Simulations of the UY Aur system by Günther & Kley (2002) suggest that the mass accretion rate from the outer circumbinary disk onto the secondary star might be five times higher and more phase dependent than that to the primary star. However, Hanawa et al. (2010) conversely showed that usually the mass accretion rate of the primary is higher than that of the secondary, and in late times the two accretion rates become similar. Many simulations produce a gas stream bridge between the circumstellar disks, as well as an accretion flow toward the individual circumstellar disks from the outer circumbinary disk (e.g. Fateeva et al., 2011). Hanawa et al. (2010) showed that the bridge contains a strong shock front caused by the collision of opposing flows. Such a bridge structure has been detected in high-resolution coronagraphic H-band imaging of SR24 (Mayama et al., 2010).
Many young stars are born in binary or multiple systems (see e.g. the reviews by Mathieu, 1994; Zinnecker & Mathieu, 2001; Duchêne et al., 2007). The binary frequency for solar type main-sequence stars is about 40 %60 % (Duquennoy & Mayor, 1991; Fischer & Marcy, 1992), similar to the frequency (48.9 % 5.3 %) observed for the young stars in the Taurus molecular cloud (Köhler & Leinert, 1998). Other nearby star forming regions show a binary freqency of 9 %-32 % (King et al., 2012a, b, and references therein). Recent studies suggest that binarity is common in embedded protostars (Haisch et al., 2004; Connelley et al., 2008a, b; Chen et al., 2013). Jets or outflows have been observed from a few tens of multiple low-mass young stars (Reipurth et al., 1993; Reipurth, 2000; Takami et al., 2003; Murphy et al., 2008; Mundt et al., 2010). For single stars, the most plausible launching mechanism is based on magnetocentrifugal acceleration in a star-disk system: scenarios include the disk wind (Königl & Pudritz, 2000), X-wind (Shu et al., 2000), and stellar wind (Matt & Pudritz, 2005, 2008a, 2008b) models. Jets from a binary system can be explained if the jets emanate from each single star-disk system (e.g. L1551 IRS5: Fridlund & Liseau, 1998; Rodríguez et al., 1998; Itoh et al., 2000; Pyo et al., 2002, 2005), although it has been suggested that one of the binary jets could be destroyed or engulfed by interaction between or merging of the two jets (Murphy et al., 2005, 2008). A single outflow or jet from a binary system could also be produced by a single circumbinary disk (Machida et al., 2009; Mundt et al., 2010). Reipurth (2000) has also postulated that the dynamical decay of multiple systems induces outflow activity based on the fact that the binary frequency (79%-86%) in 14 giant Herbig-Haro objects is twice higher than the higher multiple frequency.
At near-infrared (NIR) wavelengths, [Fe II] and H2 emission lines are excellent tracers of outflows and jets (e.g. Nisini et al., 2002; Davis et al., 2001, 2003; Takami et al., 2006; Garcia Lopez et al., 2008, 2010; Hayashi & Pyo, 2009). Observations obtained with high-angular and high-velocity resolution, particularly those that utilize large ground-base telescopes combined with adaptive optics systems, allow us to study the detailed spatial and kinematical structure close to the launching region (Pyo et al., 2003, 2006; Takami et al., 2007; Beck et al., 2008; Davis et al., 2011). The He I 1.083 m line is a good tracer of the inner hot wind and funnel flow. These are evident as blueshifted absorption combined with emission, and redshifted absorption, respectively (Edwards et al., 2003; Dupree et al., 2005; Edwards et al., 2006; Kwan, Edwards, & Fischer, 2007; Fischer et al., 2008; Kwan & Fischer, 2011). Takami et al. (2002) found that the He I emission associated with DG Tau was spatially extended toward the high-velocity blushifted jet direction. Pyo et al. (2014) will present the detail spatial structure of this He I extension. Finally, the NIR H I emission lines traces accretion but also outflow activity. For example, spectro-astrometry indicates that the high velocity blueshifted gas observed in Pa emission in DG Tau is offset along the jet direction (Whelan et al., 2004), while Beck et al. (2010) have detected Br emission extended by more than 01 from the star along the jet axes in four CTTSs.
In this paper we present NIR 1 m spectroscopy over a wavelength range that covers He I 1.083 m, Pa 1.094 m, and [Fe II] 1.257 m emission lines obtained with the integral field spectrograph, NIFS, at the Gemini North Observatory. We focus on high-resolution [Fe II] emssion maps which show the complicated structure associated with the binary system UY Aur.
2 OBSERVATIONS AND DATA REDUCTION
The data presented in this study were acquired on 2007 February 13 (UT) at the “Fredrick C. Gillett” Gemini-North 8m telescope located on the summit of Mauna Kea, Hawaii, through the Subaru-Gemini time exchange program under the Gemini program ID GN-2007A-Q-3. We used the AO-fed NIR integral field spectrograph NIFS (McGregor et al., 2002). A modified J-band spectral setting, with central wavelength of 1.17 m, was used to acquire spectra in the 1.06 –1.28 m range. We chose this setting in order to simultaneously sample the emission features of He I 1.0833 m, Pa 1.094 m, and [Fe II] 1.257 m. These lines are known to arise from accretion shocks, outflows, and jets, respectively, around T Tauri stars. The integral field unit (IFU) provided a spectral resolution of R 5000 covering a 33′′ field of view with a pixel scale of 01004. The NIFS data were taken during photometric weather with an average natural seeing of 06–085. Altair, the Gemini-North facility AO system, operates at 200 Hz at 700 nm with an optical stellar image as the wavefront reference star. We used UY Aur A as the reference star because it was sufficiently bright in the R-band (R 11.4). The total on-source integration time was 1680 s ( 120 s 14 frames). The position angle was set to 40∘, which is the orientation of the blueshifted micro-jet associated with this system (Hirth, Mundt, & Solf, 1997).
The individual NIFS IFU data exposures were sky subtracted, flat fielded, cleaned for bad pixels and rectified onto regularly sampled spatial and spectral pixel grids using the processing tasks in the Gemini IRAF package. The standard NIFS data reduction process is described in detail in Beck et al. (2008). Removal of telluric absorption features was done using calibration observations of the A0 star HIP 23226 (J 8.029, 2MASS). Removal of the Pa 1.094 m absorption from the A0 standard star was done by fitting Voigt profile shapes to the absorption, and interpolating and removing any residual flux errors. In the nifcube data reduction task used to generate 3-D datacubes from the NIFS data, we resampled the data into a square grid of 004 004 pixels in the spatial dimension. The individual IFU datacubes were then shifted so that the PSFs lined up at a central spatial location in the field, and the multiple datacubes were combined using a median filter. The few frames that had measured seeing of more than 085 were excluded in the combining process, to improve the spatial sensitivity of the final data. The final combined cubes have a FWHM on the stellar PSF of 014 at the central wavelength of 1.17 m. IDL was used for all post-processing of the reduced data cubes: extraction of 1-D spectra, 2-D channel maps, position-velocity maps, etc.
3 RESULTS
3.1 He I, [Fe II], and Pa Line Profiles
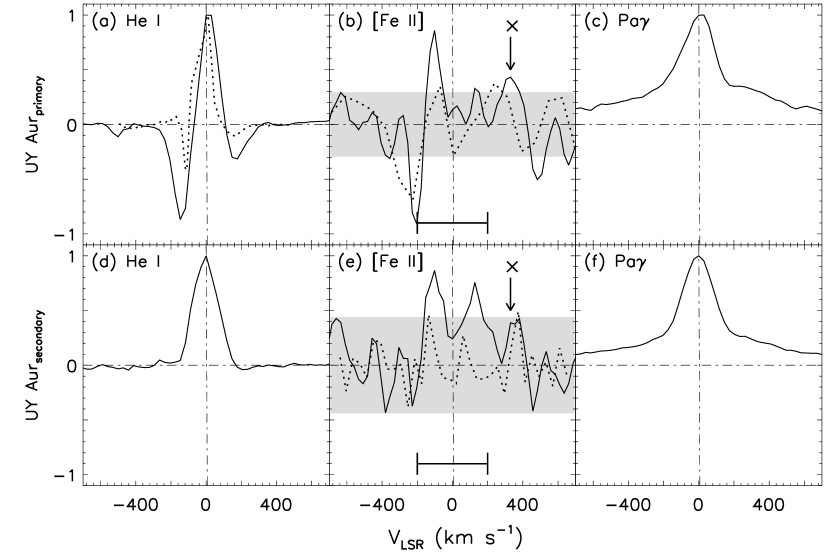
Figure 1 shows the normalized line profiles of He I 1.0833 m, [Fe II] 1.257 m, and Pa 1.094 m emission from UY Aur A (primary) and B (secondary). To extract these spectra we integrated the flux within a 04 diameter ( 3 – 4 times the FWHM of the achieved spatial resolution) around each star. The systemic velocity of UY Aur is V 6.2 km s-1 (Duvert et al., 1998). The system has an orbital period of 2074 yr and the orbital maximum velocity is 3.13 0.37 km s-1 (Close et al., 1998). We use the LSR velocity system for all velocities quoted in this paper.
The He I 1.0833 m line profiles observed towards UY Aur A and B are remarkably different. The He I line towards UY Aur A possesses deep blue-shifted and redshifted absorption features (85.5 % and 33.5 % of the emission, respectively). The total amount of absorption flux is 19 % larger than that of emission flux. Indeed, a pure He I line image made by integrating the flux density from 600 km s-1 to 600 km s-1 has a negative net flux. The deepest trough in the blueshifted absorption feature is located at 150 km s-1; the wings of this absorption feature reach a maximum velocity of 400 km s-1. The deepest point in the redshifted absorption feature is at 170 km s-1; the wings of this absorption feature reach 300 km s-1. Notably, the He I profile shows more developed absorption dips than were observed by Edwards et al. (2006) in November 2002. This is perhaps not surprising since, as noted by Edwards et al., He I profiles can vary, even over a two night interval. In stark contrast to UY Aur A, the He I profile observed towards UY Aur B has a very simple, symmetric emission line profile that is confined to within 200 km s-1. No blueshifted nor redshifted absorption is seen. The peak flux of He I emission from UY Aur B is 25 times smaller than that of UY Aur A.
The [Fe II] 1.257 m line profiles from UY Aur A and B are shown in Figures 1b and 1e, where the velocity ranges of the [Fe II] emission are shown by the horizontal bars. These [Fe II] lines were detected at greater than 3 of the background noise from both stars, but are marginally seen in these spectra where the continuum emission is strong and many photospheric features are seen. The primary and secondary both have emission peaks at velocities at 100 km s-1 and 130 km s-1 . The absorption and emission features at 200 km s-1 and 300 km s-1, respectively, are photospheric features from the star. The dotted lines represent the spectra of M0V and M2V type stars, objects that have spectral types similar to UY Aur A and B, respectively. The spectral resolution of these standard star observations is lower than our data. Even so, they demonstrate how the [Fe II] emission within 200 km s-1 is affected by photospheric features. The blueshifted [Fe II] emission peak of the primary is two times higher than the photospheric feature, but the [Fe II] emission of the secondary is dominated by both blue-shifted and red-shifted photospheric features.
3.2 [Fe II] and Continuum Images
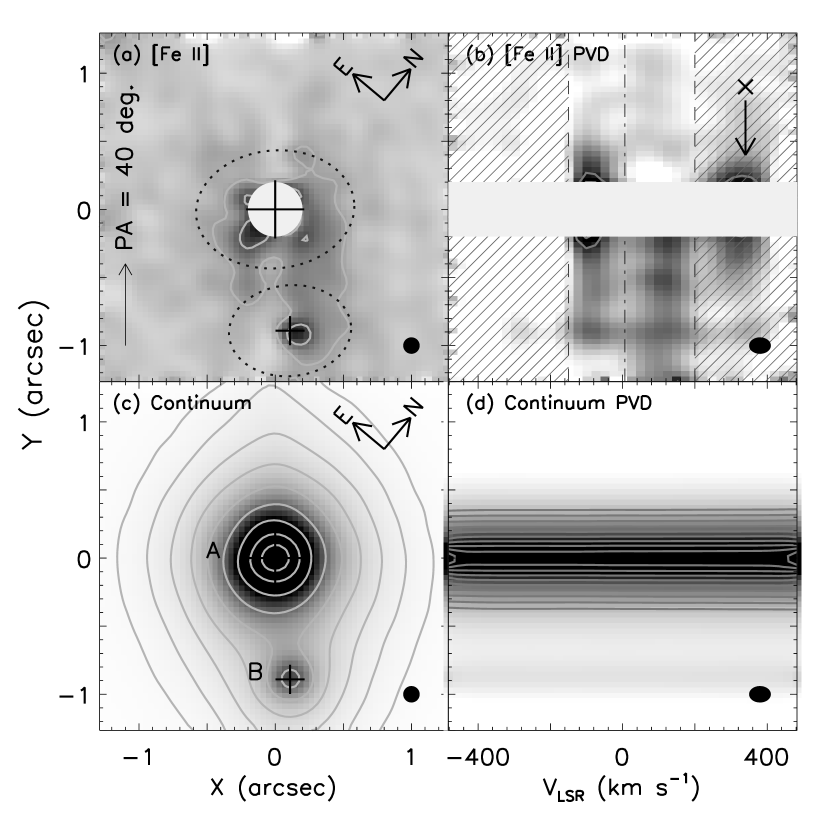
Monochromatic images produced by integrating across the He I and Pa emission lines do not show any spatial extension beyond a simple point source distribution. Thus we do not discuss these data further in this section and instead concentrate on our [Fe II] data. A continuum subtracted [Fe II] line image is presented in Figure 2a; a continuum image is shown in Figure 2c. To investigate the structure of the gas emission in the context of the gravitational influence of the two stars, we have calculated the individual Roche lobe radii for UY Aur A and B. We use this Roche lobe analysis as an approximation for the sphere of influence of each star, to better understand the structure of the gas emission.
The [Fe II] line image in Figure 2a was extracted from the reduced IFU data cube by integrating over the velocity range 150 to 200 km s-1. Note that by choosing this range we exclude the deep stellar absorption feature adjacent to the blueshifted [Fe II] emission peak (see Figure 1a). Figure 2b shows a position velocity diagram for [Fe II] plotted along the Y-axis in Figure 2a, with the emission integrated across the entire X-axis direction. In Figure 2a the effective Roche lobes111The effective Roche lobe radius is defined as: , where length of semi-major axis, (Eggleton, 1983). associated with UY Aur A and B are indicated by ellipses drawn with a dashed line. In defining these areas we have assumed that 1.765 (; Hartigan & Kenyon, 2003) and 190 AU (Close et al., 1998). The [Fe II] emission in Figure 2a appears to fill the Roche lobe around the primary, UY Aur A, although the emission is clumpy. The emission around the primary also extends toward the SW where it connects to a faint peak associated with the secondary source, UY Aur B. There is no emission to the south of the secondary.
The continuum image was made by integrating the spectra over 22.458 Å around 1.2250 m and is shown in Figure 2d. The large and small ’’ symbols in 2c indicate the positions of the primary and secondary sources, respectively. The continuum image (2c) clearly resolves the 0897 separation between UY Aur A and B. The position-angle of the axis that links UY Aur A and B is 22697; the position angle of the semi-major axis of the circumbinary disk that surrounds UY Aur A and B is 135∘. The two stars appear to lie within the plane of the circumbinary disk (Close et al., 1998). The inclination angle of the disk with respect to the line of sight is 42 3∘ (Hioki et al., 2007; Close et al., 1998). After correcting for this inclination angle, the separation between A and B is 121 and the position angle of the axis between the two sources is 22646 007. The separation is 002 larger than was measured by Hioki et al. (2007) and Close et al. (1998). The position angle is 23 degrees smaller than values cited by Hioki et al. (2007). The continuum flux ratio of the primary (A) with respect to the secondary (B) is 15.4 3.9 ( 2.97 1.5m ); Close et al. (1998) measured in 1996 a J-band flux ratio of 2.19 mag.
3.3 [Fe II] Velocity Structure
Figure 2b shows a position-velocity diagram (PVD) for [Fe II] over the range 500 km s-1. Hirth, Mundt, & Solf (1997) reported that they detected high-velocity blueshifted gas with a radial velocity of 200 to 100 km s-1 in [S II] in 1992 December although they did not present the data. They could not spatially resolve the binary because the data was limited by the seeing of 14 – 20. Our high spatial resolution data clearly show that the blueshifted [Fe II] emission between 150 and 50 km s-1 is strongest around the primary star and extends toward the secondary star. The redshifted [Fe II] emission between 50 and 200 km s-1 is evident at Y 01.
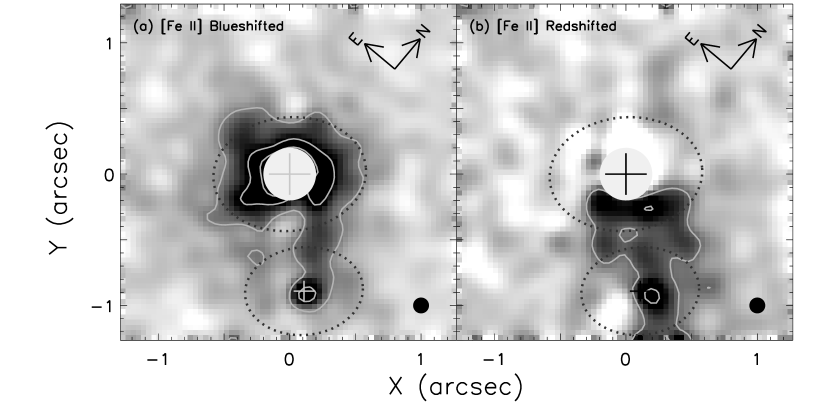
In Figure 3a and 3b we present images of the blueshifted and redshifted [Fe II] emission, respectively. The blueshifted emission fills the inside of the Roche lobe surrounding the primary, while the redshifted emission is widely spread to the south-west of the primary with 02 offset at Y 01 in Figure 3b. A portion of the blue-shifted and red-shifted gas fills a ’bridge’ that links the western side of the primary with the secondary (along X 01 – 04). Inside the Roche lobe of the secondary, the blueshifted and redshifted emission occupies only a narrow ridge that runs along the NW side of the source connecting up with the gas SW of the primary. The redshifted emission near the secondary is more extended toward the SW direction (PA 220∘). The SE side of the secondary does not exhibit any emission at all. The blueshifted emission peaks are offset 01 NE of the primary and 004 W of the secondary; the redshifted emission peak near the secondary is offset 01 to the NW. The blueshifted emission is a few times brighter than the redshifted peak.
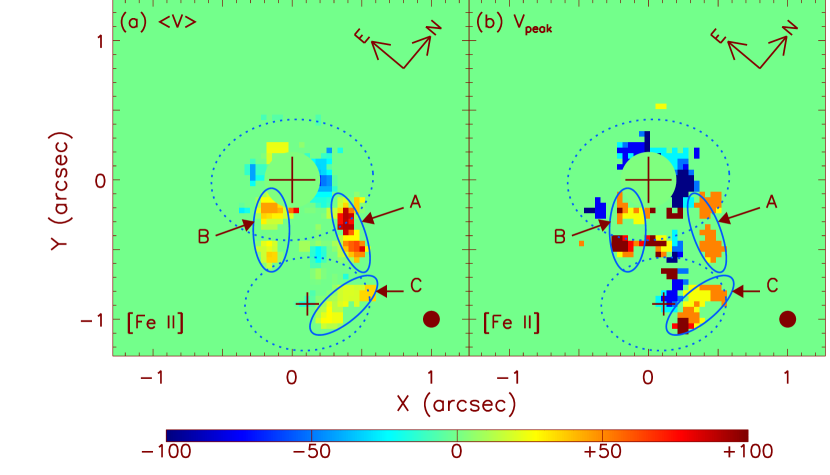
In Figure 4a and 4b we plot the intensity weighted mean velocity or velocity barycenter222 is the velocity centroid, where is the intensity of emission at velocity ) (Beck et al., 2008; Riera et al., 2003)., , as well as the velocity of the emission peak333 is defined as the velocity with peak intensity MAX., . The velocity range for the calculation in each case is from 150 km s-1 to 200 km s-1. represents the effective velocity moment of the emission line profile at each point, while is useful for distinguishing the flow tendency. In Figure 4a, the effective blueshifted gas shows a ‘V’ shape morphology with a 90∘ opening angle pointing upward (PA 40∘) from a point Y 01 below the primary. The effective redshifted gas is pronounced to the west (region ‘A’) and SW (region ‘B’) of the primary, and to the NW (region ‘C’) of the secondary. The ‘bridge’ structure shown in Figure 3a along the Y direction at X 01 – 04 disappears in the map. This indicates that blueshifted and redshifted gases co-exist in this area, together making 0 km s-1. Overall, the effectivelly redshifted gas shows a clumpy structure. The most redshifted clump is in region ‘A’ at (X, Y) (038, 03). This feature is elongated along a PA 240∘ with respect to the primary and represents fast, redshifted gas with 100 km s-1. The region ‘B’ (25 km s-1) is located at (X, Y) (015, 036) and is elongated along a PA 220∘ with respect to the primary. The regions ‘A’ and ‘B’ correspond to the boundary seen in Figure 3b. Region ‘C’ (25 km s-1) is located to the west of the secondary at (X, Y) (028, 09) and is elongated along a PA 10∘.
The distribution of velocities at the emission line peak, (Figure 4b), is somewhat different from the map. The gas with blueshifted is spread around the primary at Y 02. The ‘bridge’ of blueshifted gas reappeared here along the Y direction elongated from the vicinity of the secondary to the NW of the primary as was seen in Figure 3. The fastest blueshifted emission peak, , is located at (X, Y) (025, 005), at the end of the extension. Most of the gas clumps with redshifted are located within the regions identified as ‘A’, ‘B’, and ‘C’. The fast (100 km s-1) redshifted clumps are found at (X, Y) (02, 0.45) in ‘B’ region, (025, 105) in ‘C’ region.
4 DISCUSSION
The primary shows deep blueshifted absorption in the He I 10830 line profile (Figure 1). Edwards et al. (2003, 2006) pointed out that the diversity in width and depth of the blueshifted absorption of He I indicates an inner wind emanating from a star with a large solid angle. Kwan, Edwards, & Fischer (2007) classified the He I line profile they observed towards UY Aur as a disk wind with the second source of emission because the profile in Edwards et al. (2006) showed narrow blueshifted absorption and emission extended to blueward. However, the profile which we observed on 2007 (Figure 1a) showed more developed blueshifted absorption and resembled the profile of CY Tau in Kwan, Edwards, & Fischer (2007), which were interpreted in terms of a stellar wind model.
The Pa 1.094 m emission does not show any spatial extension. This is consistent with the interpretation that the Br and Pa emissions arise from very compact magnetospheric accretion columns in the vicinity of the central stars. On the other hand, Beck et al. (2010) reported that 50 % of their targets (four out of eight) had spatially extended Br emission, suggesting that the atomic Hydrogen emission can originate from extended jets or scattering by extended dust around the central stars. They assumed that the other four objects also had spatially extended Br emission that was obscured by the bright continuum emission close to the central stars. The extended emission could not have been detected if the physical conditions of the jet gas were not adequate: i.e., if the temperature were too low or the density were too high. In the case of spatially extended dust scattering, the spatial distribution of the line emission should follow that of the continuum emission.
The velocity structure between UY Aur A and B is complicated because of the overlap of blueshifted and redshifted emission features. A narrow structure connecting the primary and secondary disks similar to the ‘bridge’ observed in the present studies is predicted by accretion flow simulations of circumbinary disks (Günther & Kley, 2002; Hanawa et al., 2010; Fateeva et al., 2011). The bridge might then be related to the boundary region between two colliding accretion flows. If the circumbinary disk planes are not perpendicular to the line of sight, both blueshifted and redshifted accretion flows would exist around the ‘bridge’ structure. However, it is difficult to produce the high velocity features seen in our data as a result of colliding flows between the two circumstellar disks because the accretion gas flows should basically have Keplerian velocities, of the order of a few km s-1 at the edge of circumstellar disks. Thus, the high velocity emission features are probably associated with outflows launched from the vicinity of the central stars.
The [Fe II] emission profile observed towards the UY Aur system exhibits blueshifted emission at 154 – 46 km s-1 and redshifted emission at 67 – 201 km s-1 (after correcting for the 42∘ inclination angle of the circumbinary disk). Because the terminal velocity of an outflow is comparable to the Keplerian rotation velocity of a disk at the launching region (Kudoh, Matsumoto, & Shibata, 1998), the fast flow velocities indicate that the launching region is located in a deep potential well, close to the star in the accreting star-disk system. If we use the stellar masses of the primary and secondary as 0.6 and 0.34 , respectively, estimated by Hartigan & Kenyon (2003) using the pre-main-sequence tracks of Siess et al. (2000), and assume three-times larger lever arm radii than the foot point radii for magnetocentrifugal acceleration (Königl & Pudritz, 2000), then the foot points for outflow acceleration correspond to 0.22 – 0.6 AU and 0.12 – 0.34 AU for UY Aur A and B, respectively. The other estimates of stellar masses are more or less consistent with that of Hartigan & Kenyon (2003). Based on the Keplerian rotation measured by the 13CO gas in the circumbinary disk, Duvert et al. (1998) estimated the total mass of the UY Aur binary as 1.2 . Close et al. (1998) estimated the total mass of the binary as 1.61 using orbital parameters derived from observations obtained since 1944. Together these results show the uncertainty of the total mass estimate of the binary system, not affecting the above estimates of launching radii.
The geometrical distribution of [Fe II] emission from the primary suggests a wind with a wide opening angle: the blueshifted and redshifted emission in Figure 3 is widely distributed, and in the diagram of (Figure 4a) the blueshifted emission opens out in a ‘V’ shape around the primary. The gap of 02 between the primary and the redshifted emission can be explained by the optically thick circumstellar disk of UY Aur A. The FWHM diameter of the star in our images was measured to be 014. We have to be careful when interpreting structures within 01 of the star because the subtraction residuals associated with Poission noise in the central region can hugely affect the structure. However, we can say that the blueshifted gas is spread over more than 02 radius. We note that a similar fast wind with a wide opening angle has been reported from at least one other young source, L1551 IRS 5 (Pyo et al., 2005, 2009).
The complicated velocity structure in UY Aur prevents us from easily identifying the origin of the various emission features. The high-velocity redshifted features labelled A and B in Figure 4 could be assocaited with the edges of a fast wind with a wide opening angle from UY Aur A. Feature ‘C’ could then be an extension of feature ‘A’. With this model, however, it is diffcult to explain the blueshifted emission seen between features A, B and C. This emission may be associated with a micro jet from the secondary, UY Aur B. Clearly, deeper observations with spatial and spectral resolutions comparable to those presented here are required in [Fe II] to further probe this complex region. The elongated knot of redshifted emission labelled region ‘C’ in Figure 4 may be associated with the primary rather than the secondary, i.e. it may be an extension of region ‘A’. The secondary may drive only a narrow blueshifted jet towards the North. Deeper observations with spatial and spectral resolutions comparable to the presented studies are required in the [Fe II] line to further probe this complex region.
The absence of [Fe II] emission at the south of the secondary (within its Roche lobe) in Figure 3b is curious. Intrinsically existing emission could have been obscured by a gas-dust cloud ejected from the binary or the secondary. A notably large flux variation of the secondary may be caused buy such a cloud. For example, in 1992 it became 5 mag fainter than the primary in the R-band (Herbst et al., 1995). The R-band magnitude difference (m) between the primary and secondary has changed by 6.6m in 1996 (Close et al., 1998) and 2.0m in 2000 (Brandeker et al., 2003). In the H-band, the m changed 1.7m in 1996, 0.43m in 2002, and 1.7m in 2005. Overall, the secondary has exhibited larger magnitude variations than the primary: 1.3m compared to 0.3m between 1996 - 2005 (Hioki et al., 2007; Close et al., 1998). These magnitude variations should be related to the changes in mass loss (outflow) and mass accretion rates. Berdnikov, Ermash, & Lamzin (2010) pointed out that a gas-dust cloud had obscured UY Aur during 1945 - 1974. This cloud may still be responsible to obscure UY Aur B.
Skemer et al. (2010) reported that the silicate spectrum of UY Aur B is much flatter than expected. This may be the result of foreground extinction for an edge-on disk: the UY Aur disk may be viewed edge-on, although such a disk has not been detected in direct imaging observations of UY Aur B. Thus the disk may not be precisely ‘edge-on’, i.e., the inclination may be larger than 15 degrees with respect to the line of sight. Monin et al. (2007) postulated that the mis-alignment of circumstellar disks in binary systems may be quite common in wide binaries (with a 100 AU) for Class 0, I , and II phases. UY Aur system may be an example of such a case.
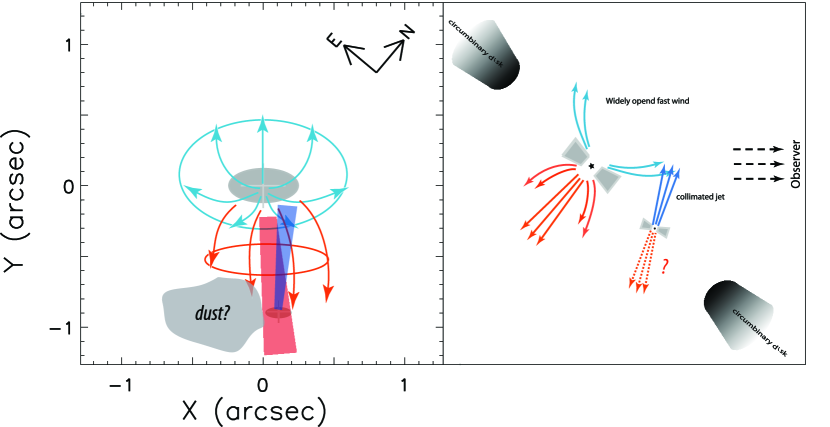
Figure 5 shows a schematic drawing of the UY Aur system, illustrating our overall understanding of this remarkable object.
5 SUMMARY
Our high spatial and high velocity resolutions NIR integral field spectroscopy of the UY Aur young interacting binary system show the following results:
-
1.
We detected He I 1.0830 m emission from both the primary and the secondary components of the binary, UY Aur A and B. UY Aur A shows deep blueshifted and redshifted absorptions with a central emission line which supports the stellar wind model interpretation of Kwan, Edwards, & Fischer (2007). UY Aur B shows only emission, 25 times fainter than that of the primary.
-
2.
Our observations suggest that UY Aur A drives fast, blueshifted and redshifted [Fe II] outflows with wide opening angles. Between binary components A and B we observe complex velocity structure with overlapping blueshifted and redshifted emission features. We identified a gas ‘bridge’ between the primary and secondary stars, although the high velocities observed along the edges of this feature support an outflow interpretation. UY Aur B may then be associated with a blushifted micro-jet.
References
- Artymowicz et al. (1991) Artymowicz, P., Clarke, C. J., Lubow, S. H., & Pringle, J. E. 1991, ApJ, 370, L35
- Artymowicz & Lubow (1996) Artymowicz, P., & Lubow, S. H. 1996, ApJ, 467, L77
- Beck et al. (2008) Beck, T. L., McGregor, P. J., Takami, M., & Pyo, T.-S. 2008, ApJ, 676, 472
- Beck et al. (2010) Beck, T. L., Bary, J. S., & McGregor, P. J. 2010, ApJ, 722, 1360
- Berdnikov, Ermash, & Lamzin (2010) Berdnikov, L. N., Ermash, A. A., & Lamzin, S. A. 2010, Astronomy Letters, 36, 653
- Brandeker et al. (2003) Brandeker, A., Jayawardhana, R., & Najita, J. 2003, AJ, 126, 2009
- Chen et al. (2013) Chen, X., Arce, H. G., Zhang, Q., et al. 2013, ApJ, 768, 110
- Close et al. (1998) Close, L. M., Dutrey, A., Roddier, F., et al. 1998, ApJ, 499, 883
- Connelley et al. (2008a) Connelley, M. S., Reipurth, B., & Tokunaga, A. T. 2008, AJ, 135, 2526
- Connelley et al. (2008b) Connelley, M. S., Reipurth, B., & Tokunaga, A. T. 2008, AJ, 135, 2496
- Davis et al. (2003) Davis, C. J., Whelan, E., Ray, T. P., & Chrysostomou, A. 2003, A&A, 397, 693
- Davis et al. (2001) Davis, C. J., Ray, T. P., Desroches, L., & Aspin, C. 2001, MNRAS, 326, 524
- Davis et al. (2011) Davis, C. J., Cervantes, B., Nisini, B., et al. 2011, A&A, 528, A3
- Duchêne et al. (1999) Duchêne, G., Monin, J.-L., Bouvier, J., & Ménard, F. 1999, A&A, 351, 954
- Duchêne et al. (2007) Duchêne, G., Delgado-Donate, E., Haisch, K. E., Jr., Loinard, L., & Rodríguez, L. F. 2007, Protostars and Planets V, 379
- Dupree et al. (2005) Dupree, A. K., Brickhouse, N. S., Smith, G. H., & Strader, J. 2005, ApJ, 625, L131
- Duquennoy & Mayor (1991) Duquennoy, A., & Mayor, M. 1991, A&A, 248, 485
- Dutrey et al. (1994) Dutrey, A., Guilloteau, S., & Simon, M. 1994, A&A, 286, 149
- Duvert et al. (1998) Duvert, G., Dutrey, A., Guilloteau, S., et al. 1998, A&A, 332, 867
- Edwards et al. (2006) Edwards, S., Fischer, W., Hillenbrand, L., & Kwan, J. 2006, ApJ, 646, 319
- Edwards et al. (2003) Edwards, S., Fischer, W., Kwan, J., Hillenbrand, L., & Dupree, A. K. 2003, ApJ, 599, L41
- Eggleton (1983) Eggleton, P. 1983, ApJ, 268, 368
- Fateeva et al. (2011) Fateeva, A. M., Bisikalo, D. V., Kaygorodov P. V., & Sytov, A. Y. 2011, Ap&SS, 335, 125
- Fischer & Marcy (1992) Fischer, D. A., & Marcy, G. W. 1992, ApJ, 396, 178
- Fischer et al. (2008) Fischer, W., Kwan, J., Edwards, S., & Hillenbrand, L. 2008, ApJ, 687, 1117
- Fridlund & Liseau (1998) Fridlund, C. V. M., & Liseau, R. 1998, ApJ, 499, L75
- Garcia Lopez et al. (2008) Garcia Lopez, R., Nisini, B., Giannini, T., et al. 2008, A&A, 487, 1019
- Garcia Lopez et al. (2010) Garcia Lopez, R., Nisini, B., Eislöffel, J., et al. 2010, A&A, 511, A5
- Günther & Kley (2002) Günther, R., & Kley, W. 2002, A&A, 387, 550
- Haisch et al. (2004) Haisch, K. E., Jr., Greene, T. P., Barsony, M., & Stahler, S. W. 2004, AJ, 127, 1747
- Hanawa et al. (2010) Hanawa, T., Ochi, Y., & Ando, K. 2010, ApJ, 708, 485
- Hartigan & Kenyon (2003) Hartigan, P., & Kenyon, S. J. 2003, ApJ, 583, 334
- Hartigan et al. (2004) Hartigan, P., Raymond, J., & Pierson, R. 2004, ApJ, 614, L69
- Hayashi & Pyo (2009) Hayashi, M., & Pyo, T. -S. 2009, ApJ, 694, 582
- Herbst et al. (1995) Herbst, T. M., Koresko, C. D., & Leinert, C. 1995, ApJ, 444, L93
- Hioki et al. (2007) Hioki, T., et al. 2007, AJ, 134, 880
- Hirth, Mundt, & Solf (1997) Hirth, G. A., Mundt, R., & Solf, J. 1997, A&AS, 126, 437
- Itoh et al. (2000) Itoh, Y., Kaifu, N., Hayashi, M., et al. 2000, PASJ, 52, 81
- Joy & van Biesbroeck (1944) Joy, A. H., & van Biesbroeck, G. 1944, PASP, 56, 123
- King et al. (2012a) King, R. R., Goodwin, S. P., Parker, R. J., & Patience, J. 2012, MNRAS, 427, 2636
- King et al. (2012b) King, R. R., Parker, R. J., Patience, J., & Goodwin, S. P. 2012, MNRAS, 421, 2025
- Koresko et al. (1997) Koresko, C. D., Herbst, T. M., & Leinert, C. 1997, ApJ, 480, 741
- Kudoh, Matsumoto, & Shibata (1998) Kudoh, T., Matsumoto, R., & Shibata, K. 1998, ApJ, 508, 186
- Köhler & Leinert (1998) Kohler, R., & Leinert, C. 1998, A&A, 331, 977
- Königl & Pudritz (2000) Königl, A., & Pudritz, R. 2000, in Protostars and Planets IV. ed. V. Mannings, A. P. Boss, & S. S. Russell (Tucson: University of Arizona Press), 759
- Kwan, Edwards, & Fischer (2007) Kwan, J., Edwards, S., & Fischer, W. 2007, ApJ, 657, 897
- Kwan & Fischer (2011) Kwan, J., & Fischer, W. 2011, MNRAS, 411, 2383
- Machida et al. (2009) Machida, M. N., Inutsuka, S.-i., & Matsumoto, T. 2009, ApJ, 704, L10
- Mathieu (1994) Mathieu, R. D. 1994, ARA&A, 32, 465
- Matt & Pudritz (2005) Matt, S. & Pudritz, R. E. 2005, ApJ, 632, L135
- Matt & Pudritz (2008a) Matt, S., & Pudritz, R. E. 2008, ApJ, 678, 1109
- Matt & Pudritz (2008b) Matt, S., & Pudritz, R. E. 2008, ApJ, 681, 391
- Mayama et al. (2010) Mayama, S., et al. 2010, Science, 327, 306
- McGregor et al. (2002) McGregor, P., et al. 2003, Proc. SPIE, 4841, 1581
- McGroarty et al. (2004) McGroarty, F., Ray, T. P., & Bally, J. 2004, A&A, 415, 189
- Monin et al. (2007) Monin, J.-L., Clarke, C. J., Prato, L., & McCabe, C. 2007, Protostars and Planets V, 395
- Mundt et al. (2010) Mundt, R., Hamilton, C. M., Herbst, W., Johns-Krull, C. M., & Winn, J. N. 2010, ApJ, 708, L5
- Murphy et al. (2008) Murphy, G. C., Lery, T., O’Sullivan, S., et al. 2008, A&A, 478, 453
- Murphy et al. (2005) Murphy, G. C., Lery, T., O’Sullivan, S., & Spicer, D. S. 2005, Protostars and Planets V, 8174
- Nisini et al. (2002) Nisini, B., Caratti o Garatti, A., Giannini, T., & Lorenzetti, D. 2002, A&A, 393, 1035
- Pyo et al. (2002) Pyo, T. -S., Hayashi, M., Kobayashi, N., et al. 2002, ApJ, 570, 724
- Pyo et al. (2003) Pyo, T. -S., Kobayashi, N., Hayashi, M., et al. 2003, ApJ, 590, 340
- Pyo et al. (2005) Pyo, T. -S., Hayashi, M., Kobayashi, N., et al. 2005, ApJ, 618, 817
- Pyo et al. (2006) Pyo, T. -S., Hayashi, M., Kobayashi, N., et al. 2006, ApJ, 649, 836
- Pyo et al. (2009) Pyo, T.-S., Hayashi, M., Kobayashi, N., Terada, H., & Tokunaga, A. T. 2009, ApJ, 694, 654
- Pyo et al. (2014) Pyo, T. -S., et al. 2014, in preparation
- Rayner et al. (2009) Rayner, J. T., Cushing, M. C., & Vacca, W. D. 2009, ApJS, 185, 289
- Reipurth et al. (1993) Reipurth, B., Heathcote, S., Roth, M., Noriega-Crespo, A., & Raga, A. C. 1993, ApJ, 408, L49
- Reipurth (2000) Reipurth, B. 2000, AJ, 120, 3177
- Riera et al. (2003) Riera, A., Raga, A. C., Reipurth, B., et al. 2003, AJ, 126, 327
- Rodríguez et al. (1998) Rodríguez, L. F., D’Alessio, P., Wilner, D. J., et al. 1998, Nature, 395, 355
- Rozyczka & Laughlin (1997) Rozyczka, M., & Laughlin, G. 1997, in ASP conf. Ser. 121, IAU Colloq. 163, Accretion Phenomena and Related Outflows, 792
- Shu et al. (2000) Shu, F. H., Najita, J. R., Shang, H., & Li, Z. -Y. 2000, Protostars and Planets IV, 789
- Siess et al. (2000) Siess, L., Dufour, E., & Forestini, M. 2000, A&A, 358, 495
- Skemer et al. (2010) Skemer, A. J., Close, L. M., Hinz, P. M., et al. 2010, ApJ, 711, 1280
- Takami et al. (2002) Takami, M., Chrysostomou, A., Bailey, J., et al. 2002, ApJ, 568, L53
- Takami et al. (2003) Takami, M., Bailey, J., & Chrysostomou, A. 2003, A&A, 397, 675
- Takami et al. (2006) Takami, M., Chrysostomou, A., Ray, T. P., et al. 2006, ApJ, 641, 357
- Takami et al. (2007) Takami, M., Beck, T. L., Pyo, T. -S., McGregor, P., & Davis, C. 2007, ApJ, 670, L33
- Wallace et al. (2000) Wallace, L., Meyer, M. R., Hinkle, K., & Edwards, S. 2000, ApJ, 535, 325
- Whelan et al. (2004) Whelan, E. T., Ray, T. P., & Davis, C. J. 2004, A&A, 417, 247
- Zinnecker & Mathieu (2001) Zinnecker, H., & Mathieu, R. 2001, The Formation of Binary Stars, IAU Symp., 200.