Discovery of a cold stellar stream in the ATLAS DR1 data
Abstract
We report the discovery of a narrow stellar stream crossing the constellations of Sculptor and Fornax in the Southern celestial hemisphere. The portion of the stream detected in the Data Release 1 photometry of the ATLAS survey is at least 12 degrees long, while its width is 0.25 deg. The Color Magnitude Diagram of this halo sub-structure is consistent with a metal-poor stellar population located at a heliocentric distance of 20 2 kpc. There are three globular clusters that could tentatively be associated with the stream: NGC 7006, NGC 7078 (M15) and Pyxis, but NGC 7006 and 7078 seem to have proper motions incompatible with the stream orbit.
keywords:
Galaxy: fundamental parameters — Galaxy: halo — Galaxy: kinematics and dynamics — stars: main sequence — stars1 Introduction
The last decade has witnessed the arrival of unprecedented amounts of high quality imaging data from the Sloan Digital Sky Survey (SDSS). Thanks to the depth and the exquisite stability of the SDSS broad-band photometry across thousands of square degrees on the sky, previously unseen low-level fluctuations in the Galactic stellar density field have been unearthed (see e.g. Newberg et al., 2002; Willman et al., 2005; Belokurov et al., 2006; Belokurov, 2013). In the Milky Way halo one striking example of a small-scale over-density is the GD-1 stellar stream (Grillmair & Dionatos, 2006b), only a fraction of a degree in width, but running over 60 degrees from end to end in the SDSS footprint. Such stellar trails are formed in the process of a satellite disruption in the tidal field of the Galaxy. The mechanics of the stream formation and the subsequent dynamical evolution in the host potential have been carefully studied (e.g. Eyre & Binney, 2011; Sanders & Binney, 2013). The consensus that has emerged from both theoretical considerations and admittedly, very few tests on the actual data (e.g. Koposov et al., 2010), is that these structures can be used to yield powerful, unbiased constraints of the matter distribution in the Galaxy.
In principle there exists a methodology to model the entire spectrum of tidal debris in the Galactic halo (see e.g. Helmi & White, 1999), from very narrow structures like GD-1 to broad luminous streams like that of Sgr (exposed in e.g. Majewski et al., 2003), including the stellar over-densities that do not necessarily even trace out a stream (e.g. Price-Whelan & Johnston, 2013). However, the thinnest streams appear doubly interesting. First, given that these are not affected by the progenitor’s gravity, methods are now in place to infer the Galactic potential without the need to resort to approximating the stellar tracks with a single orbit (e.g. Bovy, 2014; Sanders, 2014). Second, along these narrow tidal tails it is easiest to observe density fluctuations due to interactions with dark matter sub-halos in the Galaxy (see e.g. Carlberg, 2009; Yoon et al., 2011), provided that so-called epicyclic feathering is taken care of (see e.g. Mastrobuono-Battisti et al., 2012). SDSS data has already been thoroughly mined to yield a handful of cold stellar streams. These include, for example, the tails of the Pal 5 globular cluster (Odenkirchen et al., 2001, 2003; Grillmair & Dionatos, 2006a), as well as tails around NGC 5466 (Belokurov et al., 2006), NGC 5053 Lauchner et al. (2006), Pal 14 (Sollima et al., 2011) and Pal 1 (Niederste-Ostholt et al., 2010). In addition Grillmair (2009) found a group of narrow streams Acheron, Cocytos, Lethe and more recently the discovery of the Pisces Stellar Stream was announced (Bonaca et al., 2012; Martin et al., 2013).
In this paper we present the discovery of a new stellar stream in the Southern celestial hemipshere based on photometry from Data Release 1 (DR1) of the VST ATLAS survey (Shanks et al., 2013). ATLAS is one of the three imaging surveys being currently undertaken within the remit of the ESO VST Public Surveys Program, the other two being KiDS (de Jong et al., 2013) and VPHAS+ (Drew et al 2014). The aim of the ATLAS survey is to obtain photometry in the SDSS filters down to for approximately 4,500 square degrees of the southern sky. The primary motiviation for the survey is to identify large numbers of QSOs and Luminous Red Galaxies out to redshifts of for studies of the cosmological matter power spectrum. The ability to use this data to also detect low-level Galactic Halo stellar sub-structure spanning several hundred square degree survey fields is testament to the quality and the stability of the ATLAS photometric and astrometric calibration. Section 2 briefly describes the data being used, while Section 3 gives the details of the newly discovered stream. The final section summarises the main results.
2 VST ATLAS DR1
The ATLAS survey makes use of the VLT Survey Telescope, VST, a 2.6 m ESO telescope on Paranal. Images are taken with the OmegaCAM camera mounted at the Cassegrain focus of the VST. The camers consists of 32 individual 4k 2k CCDs with a pixel size of 0.21 arcsec, providing a field of view of 1 square degree. Compared to the SDSS, total exposure times are slightly longer, to account for a smaller pixel size, namely 120 s in , 100 s in , and 90 s in each of . The specified survey seeing is arcsec and the actual median seeing of the ATLAS DR1 is just under 1 arcsec. The resulting median limiting magnitudes in each of the five bands corresponding to 5 source detection limits are approximately .
The raw data are automatically transferred to the Cambridge Astronomical Survey Unit (CASU) for further quality checks and subsequent processing. CASU processes VST data on a nightly basis including all three of the VST public surveys together with any calibration data. The processing sequence is similar to that used for the IPHAS survey of the northern Galactic Plane (e.g. Gonzalez-Solares et al 2008), however the higher level control software is based on that developed for the VISTA Data Flow System (VDFS, Irwin et al 2004). Science images are first de-biased and flat-fielded (using series of twilight sky flats) with particular care taken of 4 detectors suffering from inter-detector cross-talk. The flatfield sequences plus bad pixel masks are used to generate confidence maps (e.g. Irwin et al 2004) for subsequent use in stacking and cataloguing. The integration time for each band for ATLAS data is split into two dithered exposures which are stacked in the pipeline based on derived individual image World Coordinate System (WCS) solutions and then catalogued.
Catalogue generation is based on IMCORE111Software publicly available from http://casu.ast.cam.ac.uk (Irwin, 1985) and makes direct use of the aforementioned confidence maps to downweight unreliable parts of the images. At this stage, objects are detected, parameterized and classified morphologically. With catalogues in hand, the World Coordinate System (WCS) solution based on the telescope pointing and general system characteristics is progressively refined using matches between detected objects and the 2MASS catalogue (Skrutskie et al 2006). The source photometry is calibrated in two stages. A first-pass solution is obtained using the observations of standard star fields (observed each night). This is then refined and adjusted to correct for the scattered light systematics using APASS all-sky photometric catalogues (http://www.aavso.org/apass). The ATLAS DR1 VST photometry is only in Vega magnitudes222The transformation between Vega and AB systems can be found in Blanton & Roweis (2007). Subsequent releases will provide an independent AB magnitude calibration based on the APASS photometry. For the analysis that follows we use the Vega system and correct the magnitudes for Galactic extinction using the dust maps of Schlegel et al. (1998).
3 The ATLAS Stream
To test the quality of the ATLAS photometry across a range of colors and magnitudes, density maps of stars close to the expected location of halo main sequence turnoffs at various distances were produced. As reported previously (Shanks et al., 2013), such maps reveal a smooth slowly varying stellar density field with several overdensities superposed. Most of this sub-structure is well known, for example, the southern Sgr stream and the Fornax and Sculptor dwarf spheroidals, however, a narrow, approximately 12 degree long stream of stars centered around was immediately apparent.
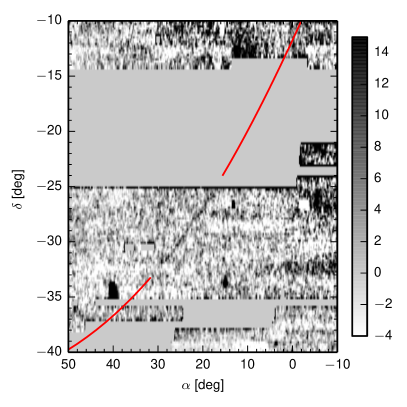
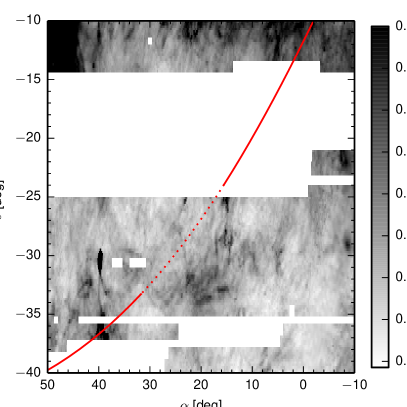
Figure 1 shows an enhanced version of the density distribution of main sequence stars of an area of the sky around the discovered stream. This particular map was obtained using the so-called “matched-filter” technique (e.g. Rockosi et al., 2002). A matched-filter assigns higher weights to stars in the regions of the Color-Magnitude Diagram (CMD) dominated by the target stellar population of chosen age, metallicity and distance, and least contaminated by foreground stars. These weights, obtained from the ratios of CMD densities of the target population to the background, are then summed in pixels on the celestial sphere to expose structures whose stellar populations are similar to the target. In practice we assume that the stream stellar population is old and metal-poor and only search for an optimal distance match. Therefore, a model isochrone with and 12.5 Gyr age is chosen from the synthetic library produced by Girardi et al. (2004); the CMD tests described below show that this simplifying assumption is reasonable. The selected isochrone is placed at different trial distance moduli, the matched-filter density map is produced and the signal-to-noise ratio of the stream is estimated. The best signal-to-noise is obtained for a heliocentric distance of 20 kpc - the distance used to produce the final map shown in the left panel of Figure 1. In order to enhance the contrast of the small scale structures in the map we fitted the large scale stellar distribution by 2-dimensional 6-th order polynomial and subtracted it. The right panel of Figure 1 shows the distribution of the Galactic extinction in the same area as the stream. There is no evidence in the extinction map of any structures related to the dust distribution that are coincident with the stream.
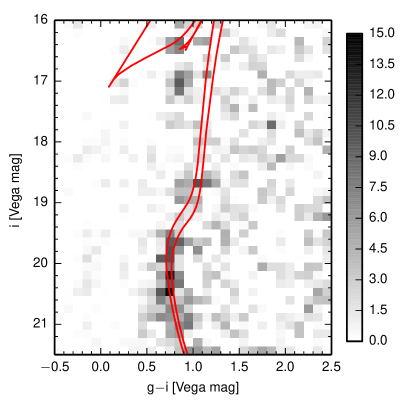
To analyze the properties of the newly discovered sub-structure we switch from equatorial coordinates to a system aligned with the stream great circle. This is achieved by rotating the equatorial coordinate pole to a new position at to give the along-stream and the across-stream coordinates and (see e.g. Koposov et al., 2010); the origin of the rotated coordinates is defined to be near the center of the observed part of the stream . The left panel of Figure 2 shows the Hess difference, that is the CMD density difference between the region of the sky dominated by the stream stars, namely and the Galactic background. Fainter than , there are several familiar features visible, including a sub-giant branch and a main sequence turn-off. Brighter than the Hess difference reveals several artefacts of imperfect background subtraction. While the isochrone with metallicity seems to describe the CMD of the stream reasonably well, so does the more metal rich-one, with . The fit of the Hess diagram by the stellar population reveals the best fit distance of 20 kpc and the formal error of 2 kpc with the expected larger systematic error associated with the lack of knowledge of metallicity and age of the stellar population in the stream. We conclude that while the assumption of an old and metal-poor stellar population in the stream is not inadequate, based on the currently available photometry alone it is not possible to assign metallicity, age and distance to the stream more robustly. Furthermore the existing photometry and the shortness of the visible part of the stream does not seem to allow us to constrain the distance gradient along the stream.
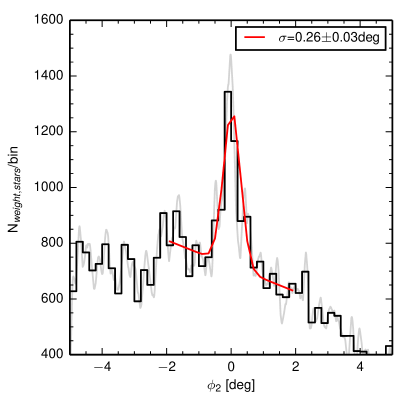
The right panel of Figure 2 shows the stellar density distribution across the stream for a range of , confirming that the stream detection is highly significant. Additionally to the density computed by making the histogram of stars we show the density measured by the Kernel Density Estimation using the Epanechnikov kernel (Epanechnikov, 1969; Wand & Jones, 1994), as this density measurement is invariant to the location of the bin edges of the histogram. Also shown is a Gaussian model fit with width . At the distance of 20 kpc the stream angular width corresponds to pc. Similarly modest thickness is observed in several previously detected cold streams that are either known to originate from star clusters like that of Pal 5 or are believed to be so, for example GD-1. In order to calculate the total luminosity of the stream we have calculated the number of stream stars in the color-magnitude box of and by fitting a Gaussian model to the across-stream profile (see Figure 2). Within the region of , the total number of stars . According to the isochrone with the age of 12.5 Gyr and Chabrier initial mass function, this would correspond to a total stellar mass and luminosity around . The corresponding average surface brightness of the stream is estimated to be mag/arcsec2.
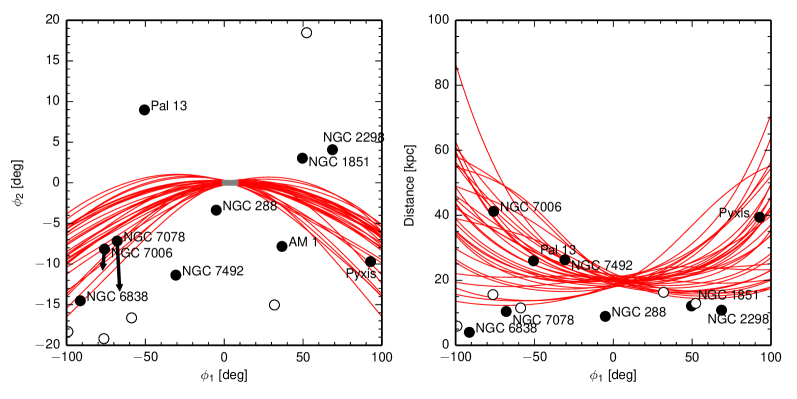
The question of the likely stream progenitor can be addressed by exploring the possibility that the stream is produced through the disruption of one of the known Galactic globular clusters. Figure 3 displays a representative sample of 30 random possible orbits that pass through the ends of the stream. i.e. points with , , in a realistic Galactic potential. In this experiment, it is assumed that at the distance modulus of the stream debris . The orbits have been obtained by sampling the posterior on orbital parameters given the distance and positional constraints, broad prior on radial velocity, and limit of 100 kpc on the apocenter (to avoid unbound or extremely excentric orbits). The gravitational potential of the Galaxy employed here is identical to that described in Fellhauer et al. (2006); Koposov et al. (2010). The left panel of the figure shows the distribution of the possible stream orbits on the sky in the coordinate system, while the right panel presents the change of heliocentric distance along each orbit. From comparing the two panels of the figure it is clear that within 90 degrees of the stream there are only 3 globular clusters whose three-dimensional positions could be coincident with an orbit passing through the portion of the stream observed in ATLAS DR1. These three are NGC 7006, NGC 7078 (M15) and Pyxis. The proper motions of the first two globulars have been measured and therefore can be compared to the model orbit predictions at the cluster location. According to Jacoby et al. (2006), the components of the proper motion of NGC 7078 are mas/yr. In the stream coordinate system, and after removing the contribution of the Solar motion in the Galaxy, this corresponds to mas/yr. Similarly, for NGC 7006, Dinescu et al. (2001) give mas/yr, or mas/yr. As is clear from the left panel of Figure 3 these measured proper motions are inconsistent with the predicted orbits giving significant non-zero across-stream components . But we also note that in the case of NGC 7078 and NGC 7006 the significance of the across-stream proper motions is 3.2 and 2.6 respectively, so the inconsistency of the stream and proper motion alignment is only marginally significant.
If the reported proper motions of NGC 7006 and NGC 7078 are correct, the only globular cluster that can not be ruled out as the stream progenitor is Pyxis (Irwin et al., 1995). The spectroscopic metallicity of Pyxis is (Palma et al., 2000), which is consistent with the, admittedly noisy, CMD presented here. Pyxis stands out somewhat when compared to the rest of the Galactic globular clusters. First, at 40 kpc it falls in between the inner and the outer halo globulars. Second, it is 12 Gyr younger that the globulars of similar metallicity (Dotter et al., 2011). Finally, Pyxis is very sparse, much like similarly puny Palomar clusters. Perhaps Pyxis was the first example of an ultra-faint satellite discovered given its size (in excess of 10 pc) and luminosity (). We remark also that the velocity dispersion of Pyxis has been measured using 6 stars (Palma et al., 2000) and is in the range between 26 km/s (1 ). While it is entirely possible that the juxtoposition of one of the tentative stream progenitor orbits and the three-dimensional position of Pyxis is accidental, wide-angle deep imaging observations of this peculiar globular are warranted.
4 Conclusions
We have presented the discovery of a new narrow stream in the VST ATLAS DR1 data. The portion of the stream detected has the following properties.
(1) The stream lies on a great circle with a celestial pole at .
(2) The heliocentric distance to the stream is kpc.
(3) The width of the debris distribution on the sky is 0.25 degrees which at the distance of the stream corresponds to 90 pc physical size.
(4) The CMD of the stream appears to be well described by an old and metal-poor isochrone. But in order to pinpoint the precise metallicity and age of the stream we will need spectroscopic measurements of the stream members.
(5) There are 3 Galactic globular clusters that could plausibly act as stream progenitors, based on their proximity to the stream orbit: NGC 7006 , NGC 7078 (M15) and Pyxis. However, given the proper motions available in the literature, NGC 7006 and NGC 7078 are unlikely to be associated with the stream. It is more difficult to rule out Pyxis at this stage.
Acknowledgments
Based on data products from observations made with ESO Telescopes at the La Silla Paranal Observatory under public survey programme ID programme 177.A-3011(A,B,C). The research leading to these results has received funding from the European Research Council under the European Union’s Seventh Framework Programme (FP/2007-2013) / ERC Grant Agreement n. 308024. VB acknowledges financial support from the Royal Society. S.K. acknowledges financial support from the STFC and the ERC. We also thank the anonymous referee for thorough review.
References
- An et al. (2008) An, D., et al. 2008, ApJS, 179, 326
- Belokurov et al. (2006) Belokurov, V., Evans, N. W., Irwin, M. J., Hewett, P. C., & Wilkinson, M. I. 2006, ApJ, 637, L29
- Belokurov et al. (2006) Belokurov, V., Zucker, D. B., Evans, N. W., et al. 2006, ApJ, 642, L137
- Belokurov (2013) Belokurov, V. 2013, NewAR, 57, 100
- Blanton & Roweis (2007) Blanton, M. R., & Roweis, S. 2007, AJ, 133, 734
- Bonaca et al. (2012) Bonaca, A., Geha, M., & Kallivayalil, N. 2012, ApJ, 760, L6
- Bovy (2014) Bovy, J. 2014, arXiv:1401.2985
- Carlberg (2009) Carlberg, R. G. 2009, ApJ, 705, L223
- de Jong et al. (2013) de Jong, J. T. A., Kuijken, K., Applegate, D., et al. 2013, The Messenger, 154, 44
- Dinescu et al. (2001) Dinescu, D. I., Majewski, S. R., Girard, T. M., & Cudworth, K. M. 2001, AJ, 122, 1916
- Dotter et al. (2011) Dotter, A., Sarajedini, A., & Anderson, J. 2011, ApJ, 738, 74
- Epanechnikov (1969) Epanechnikov, V. A. 1969, Theory of Probability & Its Applications, 14, 153
- Eyre & Binney (2011) Eyre, A., & Binney, J. 2011, MNRAS, 413, 1852
- Fellhauer et al. (2006) Fellhauer, M., Belokurov, V., Evans, N. W., et al. 2006, ApJ, 651, 167
- Girardi et al. (2004) Girardi, L., Grebel, E. K., Odenkirchen, M., & Chiosi, C. 2004, A&A, 422, 205
- Grillmair & Dionatos (2006b) Grillmair, C. J., & Dionatos, O. 2006, ApJ, 643, L17
- Grillmair (2006) Grillmair, C. J. 2006, ApJ, 645, L37
- Grillmair & Dionatos (2006a) Grillmair, C. J., & Dionatos, O. 2006, ApJ, 641, L37
- Helmi & White (1999) Helmi, A., & White, S. D. M. 1999, MNRAS, 307, 495
- Grillmair (2009) Grillmair, C. J. 2009, ApJ, 693, 1118
- Irwin et al. (1995) Irwin, M. J., Demers, S., & Kunkel, W. E. 1995, ApJ, 453, L21
- Jacoby et al. (2006) Jacoby, B. A., Cameron, P. B., Jenet, F. A., et al. 2006, ApJ, 644, L113
- Koposov et al. (2010) Koposov, S. E., Rix, H.-W., & Hogg, D. W. 2010, ApJ, 712, 260
- Lauchner et al. (2006) Lauchner, A., Powell, W. L., Jr., & Wilhelm, R. 2006, ApJ, 651, L33
- Majewski et al. (2003) Majewski, S. R., Skrutskie, M. F., Weinberg, M. D., & Ostheimer, J. C. 2003, ApJ, 599, 1082
- Martin et al. (2013) Martin, C., Carlin, J. L., Newberg, H. J., & Grillmair, C. 2013, ApJ, 765, L39
- Mastrobuono-Battisti et al. (2012) Mastrobuono-Battisti, A., Di Matteo, P., Montuori, M., & Haywood, M. 2012, A&A, 546, L7
- Newberg et al. (2002) Newberg, H. J., Yanny, B., Rockosi, C., et al. 2002, ApJ, 569, 245
- Niederste-Ostholt et al. (2010) Niederste-Ostholt, M., Belokurov, V., Evans, N. W., et al. 2010, MNRAS, 408, L66
- Odenkirchen et al. (2001) Odenkirchen, M., Grebel, E. K., Rockosi, C. M., et al. 2001, ApJ, 548, L165
- Odenkirchen et al. (2003) Odenkirchen, M., Grebel, E. K., Dehnen, W., et al. 2003, AJ, 126, 2385
- Palma et al. (2000) Palma, C., Kunkel, W. E., & Majewski, S. R. 2000, PASP, 112, 1305
- Price-Whelan & Johnston (2013) Price-Whelan, A. M., & Johnston, K. V. 2013, ApJ, 778, L12
- Rockosi et al. (2002) Rockosi, C. M., Odenkirchen, M., Grebel, E. K., et al. 2002, AJ, 124, 349
- Sanders & Binney (2013) Sanders, J. L., & Binney, J. 2013, MNRAS, 433, 1826
- Sanders (2014) Sanders, J. L. 2014, arXiv:1401.7602
- Shanks et al. (2013) Shanks, T., Belokurov, V., Chehade, B., et al. 2013, The Messenger, 154, 38
- Schlegel et al. (1998) Schlegel, D. J., Finkbeiner, D. P., & Davis, M. 1998, ApJ, 500, 525
- Sollima et al. (2011) Sollima, A., Martínez-Delgado, D., Valls-Gabaud, D., & Peñarrubia, J. 2011, ApJ, 726, 47
- Wand & Jones (1994) Wand, M. P., & Jones, M. C. 1994, Kernel smoothing, Vol. 60 (Crc Press)
- Willman et al. (2005) Willman, B., Dalcanton, J. J., Martinez-Delgado, D., et al. 2005, ApJ, 626, L85
- Yoon et al. (2011) Yoon, J. H., Johnston, K. V., & Hogg, D. W. 2011, ApJ, 731, 58