Estimating robustness of the tileShuffle method with repeated probes
Abstract
Motivation:
In this paper the TileShuffle method is evaluated as a search method for candidate lncRNAs at 8q24.2. The method is run on three microarrays. Microarrays which all contained the same sample and repeated copies of tiled probes. This allows the coherence of the selection method within and between microarrays to be estimated by Monte Carlo simulations on the repeated probes.
Results: The results show poor consistency in areas selected between arrays containing identical samples. A crude application of the method can result in majority of the region to be selected, resulting in a need for further restrictions on the selection. Restrictions based on ranking internal tileShuffle test statistics do not increase precision. As the tileShuffle method has been shown to have higher precision than the MAS and TAS software, one can conclude that methods giving unreliable results are in common use.
Availability: The data discussed in this publication have been deposited in NCBI’s Gene Expression Omnibus and are accessible through GEO Series accession number GSE45934.
Contact: sigrunhelga@gmail.com
1 Introduction
Gene expression is the process by which information from a gene is used in the synthesis of a functional gene product. These products are often proteins, but there are also non-protein coding genes where the product is a functional RNA. It has been predicted that more than 30,000 RNA genes are associated with the human genome (Kapranov and Laurent 2012).
Non-protein coding genes and their products can vary considerably in length. The shortest products, micro RNAs (miRNA), are on average only 22 bp, whereas long non-coding RNA (lncRNAs) are defined as transcribed RNA molecules longer than 200 nucleotides in length (Sana et al. 2012).
There have been several publications indicating that lncRNAs might play an important role in cancer development (Wang et al. 2011; Huarte and Rinn 2010; Tsai et al. 2011; Gibb et al. 2011b; Shore et al. 2012; Willard and Koochekpour 2012) and a good review of their functional role in human carcinomas is given in Gibb et al. (2011a).
lncRNAs are also thought to play a regulatory role in cancer-associated pathways governing mechanisms such as cell growth, invasion, and metastasis and have been seen to be expressed differently in primary and metastatic cancer (Tahira et al. 2011). lncRNAs might thus provide insights into the mechanisms underlying tumor development.
lncRNAs originate everywhere in the genome, but especially in long stretches where no protein-coding genes have been identified chung2011association. An example of such area is 8q24, where multiple single nucleotide polymorphisms (SNPs) have been associated with risk of developing prostate cancer (Haiman et al. 2007; Yeager et al. 2007; Gudmundsson et al. 2007; Amundadottir et al. 2006). Currently, there are at least 11 databases which record lncRNAs (Dinger et al. 2009; Amaral et al. 2011; Bu et al. 2012; Risueño et al. 2010; Gibb et al. 2011a).
Microarrays are frequently used to locate RNA genes. A microarray contains multiple copies of the same DNA oligonucleotides, known as probes, which are hybridized to a labeled RNA sample and the array is subsequently washed. Theoretically this will result in the labeled sample only remaining where the sample hybridized to probes. The signal intensities at the corresponding location on the microarray are used as a measure of the relative abundance of hybridization of each probe.
Typically a probe corresponds to a specific genomic region. Sometimes the probes overlap, referred to as tiling, and such arrays are called tiled microrarrays. Tiled microarrays have been successful in assessing expression of non-coding RNAs. (Johnson et al. 2005; Mockler and Ecker 2005; Weile et al. 2007)
The ability to accurately detect the true gene-expression signal in microarrays is affected by several sources of variation(Pozhitkov et al. 2007; Churchill 2002). Further issues and different biases arise when using tiled microarrays, as opposed to other analysis of differential expression (Royce et al. 2005). It is therefore important to take technical variation into account when doing statistical analysis on microarray data (Wu et al. 2004; Royce et al. 2005).
Currently a variety of methods are available to analyse data from tiled microarrays, but as expression levels are generally lower for lncRNA than protein coding genes,(Gibb et al. 2011a) conventional methods for differential expression detection may have difficulties detecting them. A good overview of available methods is found in Otto et al.(Otto et al. 2012), where the tileShuffle method is introduced and shown to have higher precision than the commonly used TAS (Kampa et al. 2004) and MAT (Johnson et al. 2006) methods.
The tileShuffle method identifies transcribed segments in terms of significant differences from the background distribution, using a permutation test statistic, called a window score. All probes within a sliding window have a window score assigned (arithmetic mean trimmed by median or max and min value). Further, probes are subdivided into bins by GC content and processed independently. The significance of a window score is assessed by permuting probes accross the array, but always within the same bin. Empirical p-values are estimated by counting the number of permuted windows with higher score (Otto et al. 2012).
The aim of this study is to assess the robustness of the tileShuffle method on the expressed regions level. It utilizes a special array-design where every probe is repeated ten times on each tiled array. This enables Monte-Carlo simulations of expression signals which are used to estimate expression on pseudo-arrays, whose differences lie in a variability that is usually neglected in microarray experiments. Further, a single biological sample was split in three and used on repeated arrays, providing estimates of another variability that is commonly neglected. The consistency in regions selected across the pseudo-arrays, that should ”in theory” give identical results, will be used as a measure of the robustness of the tileShuffle method.
2 Methods
The data discussed in this publication are RNA expression data from custom designed Nimblegen microarray experiments where the same prostate tissue sample was used on three arrays. The data have been deposited in NCBI’s Gene Expression Omnibus (Edgar et al. 2002) and are accessible through GEO Series accession number GSE45934 111http://www.ncbi.nlm.nih.gov/geo/query/acc.cgi?acc=GSE45934.
The arrays contained 50 nucleotide probes from chr8:127640000-129120000 at locus 8q24, tiled at a 20 base interval. The whole region was tiled evenly, but probes with blat score greater than 5 (Kent 2002) or blast score greater than 40 (Altschul et al. 1990) were excluded. That left in total 54236 (out of 74000) probes, each of which was replicated 10 times on the array.
Spatial artifacts in the expression signal were minimized by aggregating the wells of the microarray into ten non-overlapping logical virtual ”containers”, allocating each of the ten replicates af a probe to a different container.
These ten replicate spots for each probe, evenly spread across the array, permitted Monte-Carlo simulation of the expression signals. In that way, for each of the three microarrays, 1000 pseudo replicate arrays were produced, with only one repetition of each probe, selected at random. The peudo-arrays were made in triplets, such that the same set of replicates was used to produce pseudo-arrays for all three microarrays within every simulation.
The arrays were normalized by the quantile normalization method (Bolstad et al. 2003) and consequently analysed with the tileShuffle method under various conditions, detailed later, but always one at a time. The window size, the minimum length of selected areas, was set as 1000 bases, as the aim was to detect relatively long areas. Three GC-content bins were used and the number of permutations was 1000. All statistical analyses were performed in the R statistical package (R Development Core Team 2011) and graphics are generated with the ggplot2 library (Wickham 2009).
The tileShuffle method assesses significance on minimal expected transcriptional units rather than on a single probe level. (Otto et al. 2012) Therefore the tiled region was split up into areas of length 100 bases. These areas will be underlying when addressing genomic locations that are expressed. An area will be deemed as expressed if all corresponding 100 bases were within an expressed region.
3 Results
3.1 Consistency within an array
As each probe was repeated ten times on every array, the consistency of the method could be estimated by Monte-Carlo simulations on the probe sets. In that way, 1000 pseudo-arrays were produced, each by randomly selecting one repetition of each probe. All experimental sources of variation of these pseudo-arrays are identical, except the physical location of the probesets within the microarray.
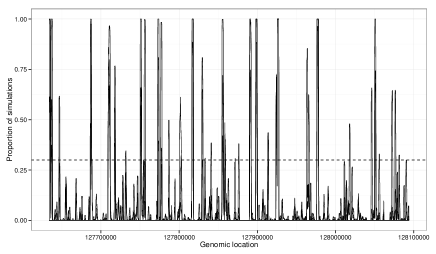
In order to investigate the effect of this probe-to-probe variation on calls of expression, the tileShuffle method was run on each of the 1000 pseudo-arrays. Figure 1 shows on how many of the pseudo-arrays each genomic location was ”called” ”expressed” (p 0.05, adjusted for multiplicity). For clarity, the figure shows only the first 300.000 bases of the tiled area or about one-fifth of the tiled region. Graphs for the remaining regions were similar. The figure shows that a great majority of the underlying tiled region is selected on at most 25% of the pseudo-arrays, whereas a few areas are selected consistently in near all cases.
3.2 Consistency between arrays
To compare across arrays, pseudo arrays were simulated in triplicates so that a single set containing probes from the same physical location on the microarray was generated for all three arrays at a time. Thus, within each triplicate of pseudo-arrays, all probes have the same internal physical location of probes on the original microarrays, blocking the location effect of probes within a microarray. This emulates real situations where probes are not replicated.
The performance of different methods for selecting subsets of the areas deemed expressed is compared in Table 1. The three columns show the areas selected on exactly one, two or all three pseudo-arrays within a triplicate, as a proportion of areas that are selected on some pseudo-array within the triplicate. Ideally one would like to maximize the proportion of instances where a location is expressed on either none, or all of the three arrays. The results are shown by increasing proportion of areas that are selected on all three pseudo-arrays.
| One array | Two arrays | Three arrays | |
|---|---|---|---|
| thirty highest window scores | 0.58 | 0.19 | 0.22 |
| one replicate of all probes | 0.49 | 0.23 | 0.28 |
| two replicates of half of the probes | 0.47 | 0.23 | 0.30 |
| median of every ten probes | 0.46 | 0.23 | 0.31 |
| selected in at least 99% of simulations | 0.52 | 0.16 | 0.32 |
| all ten replicates | 0.23 | 0.14 | 0.63 |
Finally, Supplementary Fig. 1 shows the relationship between the average proportion of the total underlying genomic area that is chosen in each simulations against the number of replicates used in every simulation. The relationship is shown for the proportion that is selected on at least one array, at least two arrays and all three arrays and a number of replicates running from 1 up to 10 replicates of each probe per array.
4 Discussion
This paper is based on an experimental setup using three tiled microarrays containing the same biological sample, each using ten repetitions of each probe. Monte-Carlo simulations from real data are used to investigate the robustness of the tileShuffle method when targeting areas on locus 8q24 that are expressed in prostate cancer.
This study raises several concerns regarding the consistency of areas selected. First of all the method shows considerable variability depending on which of the 10 replicates of each probe the method is applied to. Ideally, every area on Figure 1 should be expressed in either all or none of the Monte-Carlo simulations, resulting in the proportion being close to 0 or 1. As shown on the figure, these proportions span the whole spectrum from zero to one. Most probes which are ”called” are only called in fewer than 25% of all simulations, indicating a serious lack of repeatability. A few areas are selected consistently on nearly all pseudo-arrays, but as probes are not repeated in the common situation, this plot is not available and one cannot identify locations that are consistently expressed across pseudo-arrays.
Table 1 shows poor between-array consistency in choice of areas, which should ideally be identical. Probes which show consistency across repetitions within an array (selected in at least 99% of simulations) do not show more consistency across arrays.
The difference in results by applying the method on all ten replicates v.s. first calculating the median of every ten probes and then applying the method is somewhat counter-intuitive. A few further points should also be noted: Selecting a fixed number of areas with the highest window score is an unrobust method. The difference in using repeated probes rather then denser tiling is small, although in favour of repeated probes.
Finally, as shown on Supplementary Fig. 1, the average proportion of the underlying genomic region that is selected increases rapidly as the number of replicates of each probe increases. With ten replicates of each probe, almost 60% of the underlying region is selected on at least one array out of three. This might suggest that majority of the underlying region is ”expressed” by definition and the lack of consistency is in caused by small power.
5 Conclusion
This paper shows poor consistency of the tileShuffle method both between selection of replicates of probes within a microarray and also between microarrays containing the same sample. As the tileShuffle method has shown to have higher precision than the MAS and TAS software, one can conclude that methods giving unreliable results are in common use.
6 Acknowledgement
This research project was funded in part by grant 5R01CA129991-02 from the NCI and by an FS-Grant from the Icelandic Centre for Research (RANNIS).
References
- Altschul et al. (1990) S.F. Altschul, W. Gish, W. Miller, E.W. Myers, and D.J. Lipman. Basic local alignment search tool. J. mol. Biol, 215(3):403–410, 1990.
- Amaral et al. (2011) P.P. Amaral, M.B. Clark, D.K. Gascoigne, M.E. Dinger, and J.S. Mattick. lncrnadb: a reference database for long noncoding rnas. Nucleic acids research, 39(suppl 1):D146–D151, 2011.
- Amundadottir et al. (2006) L.T. Amundadottir, P. Sulem, J. Gudmundsson, A. Helgason, A. Baker, B.A. Agnarsson, A. Sigurdsson, K.R. Benediktsdottir, J.B. Cazier, J. Sainz, et al. A common variant associated with prostate cancer in European and African populations. Nature genetics, 38(6):652–658, 2006.
- Bolstad et al. (2003) Benjamin M Bolstad, Rafael A Irizarry, Magnus Åstrand, and Terence P. Speed. A comparison of normalization methods for high density oligonucleotide array data based on variance and bias. Bioinformatics, 19(2):185–193, 2003.
- Bu et al. (2012) D. Bu, K. Yu, S. Sun, C. Xie, G. Skogerbø, R. Miao, H. Xiao, Q. Liao, H. Luo, G. Zhao, et al. Noncode v3. 0: integrative annotation of long noncoding rnas. Nucleic acids research, 40(D1):D210–D215, 2012.
- Chung et al. (2011) S. Chung, H. Nakagawa, M. Uemura, L. Piao, K. Ashikawa, N. Hosono, R. Takata, S. Akamatsu, T. Kawaguchi, T. Morizono, et al. Association of a novel long non-coding rna in 8q24 with prostate cancer susceptibility. Cancer science, 102(1):245–252, 2011.
- Churchill (2002) G.A. Churchill. Fundamentals of experimental design for cDNA microarrays. Nature Genetics, 32(supp):490–495, 2002.
- Dinger et al. (2009) M.E. Dinger, K.C. Pang, T.R. Mercer, M.L. Crowe, S.M. Grimmond, and J.S. Mattick. Nred: a database of long noncoding rna expression. Nucleic acids research, 37(suppl 1):D122–D126, 2009.
- Edgar et al. (2002) R. Edgar, M. Domrachev, and A.E. Lash. Gene expression omnibus: Ncbi gene expression and hybridization array data repository. Nucleic acids research, 30(1):207–210, 2002.
- Gibb et al. (2011a) E.A. Gibb, C.J. Brown, and W.L. Lam. The functional role of long non-coding rna in human carcinomas. Mol Cancer, 10(1):38, 2011a.
- Gibb et al. (2011b) E.A. Gibb, E.A. Vucic, K.S.S. Enfield, G.L. Stewart, K.M. Lonergan, J.Y. Kennett, D.D. Becker-Santos, C.E. MacAulay, S. Lam, C.J. Brown, et al. Human cancer long non-coding rna transcriptomes. PloS one, 6(10):e25915, 2011b.
- Gudmundsson et al. (2007) J. Gudmundsson, P. Sulem, A. Manolescu, L.T. Amundadottir, D. Gudbjartsson, A. Helgason, T. Rafnar, J.T. Bergthorsson, B.A. Agnarsson, A. Baker, et al. Genome-wide association study identifies a second prostate cancer susceptibility variant at 8q24. Nature genetics, 39(5):631–637, 2007.
- Haiman et al. (2007) C.A. Haiman, N. Patterson, M.L. Freedman, S.R. Myers, M.C. Pike, A. Waliszewska, J. Neubauer, A. Tandon, C. Schirmer, G.J. McDonald, et al. Multiple regions within 8q24 independently affect risk for prostate cancer. Nature genetics, 39(5):638–644, 2007.
- Huarte and Rinn (2010) M. Huarte and J.L. Rinn. Large non-coding rnas: missing links in cancer? Human molecular genetics, 19(R2):R152–R161, 2010.
- Johnson et al. (2005) J.M. Johnson, S. Edwards, D. Shoemaker, and E.E. Schadt. Dark matter in the genome: evidence of widespread transcription detected by microarray tiling experiments. TRENDS in Genetics, 21(2):93–102, 2005.
- Johnson et al. (2006) W Evan Johnson, Wei Li, Clifford A Meyer, Raphael Gottardo, Jason S Carroll, Myles Brown, and X Shirley Liu. Model-based analysis of tiling-arrays for chip-chip. Proceedings of the National Academy of Sciences, 103(33):12457–12462, 2006.
- Kampa et al. (2004) Dione Kampa, Jill Cheng, Philipp Kapranov, Mark Yamanaka, Shane Brubaker, Simon Cawley, Jorg Drenkow, Antonio Piccolboni, Stefan Bekiranov, Gregg Helt, et al. Novel rnas identified from an in-depth analysis of the transcriptome of human chromosomes 21 and 22. Genome research, 14(3):331–342, 2004.
- Kapranov and Laurent (2012) P. Kapranov and G.S. Laurent. Dark matter rna: existence, function, and controversy. Frontiers in Genetics, 3, 2012.
- Kent (2002) W.J. Kent. BLAT-the BLAST-like alignment tool, 2002.
- Liao et al. (2011) Q. Liao, H. Xiao, D. Bu, C. Xie, R. Miao, H. Luo, G. Zhao, K. Yu, H. Zhao, G. Skogerbø, et al. ncfans: a web server for functional annotation of long non-coding rnas. Nucleic Acids Research, 39(suppl 2):W118–W124, 2011.
- Mockler and Ecker (2005) T.C. Mockler and J.R. Ecker. Applications of DNA tiling arrays for whole-genome analysis. Genomics, 85(1):1–15, 2005.
- Otto et al. (2012) C. Otto, K. Reiche, and J. Hackermüller. Detection of differentially expressed segments in tiling array data. Bioinformatics, 28(11):1471–1479, 2012.
- Pozhitkov et al. (2007) A.E. Pozhitkov, D. Tautz, and P.A. Noble. Oligonucleotide microarrays: widely applied poorly understood. Briefings in Functional Genomics and Proteomics, 6(2):141, 2007.
- R Development Core Team (2011) R Development Core Team. R: A Language and Environment for Statistical Computing. R Foundation for Statistical Computing, Vienna, Austria, 2011. ISBN 3-900051-07-0.
- Risueño et al. (2010) A. Risueño, C. Fontanillo, M.E. Dinger, and J. De Las Rivas. Gatexplorer: Genomic and transcriptomic explorer; mapping expression probes to gene loci, transcripts, exons and ncrnas. BMC bioinformatics, 11(1):221, 2010.
- Royce et al. (2005) T.E. Royce, J.S. Rozowsky, P. Bertone, M. Samanta, V. Stolc, S. Weissman, M. Snyder, and M. Gerstein. Issues in the analysis of oligonucleotide tiling microarrays for transcript mapping. Trends in Genetics, 21(8):466–475, 2005.
- Sacco et al. (2011) L.D. Sacco, A. Baldassarre, and A. Masotti. Bioinformatics tools and novel challenges in long non-coding rnas (lncrnas) functional analysis. International journal of molecular sciences, 13(1):97–114, 2011.
- Sana et al. (2012) J. Sana, P. Faltejskova, M. Svoboda, and O. Slaby. Novel classes of non-coding rnas and cancer. Journal of Translational Medicine, 10(1):103, 2012.
- Shore et al. (2012) A.N. Shore, J.I. Herschkowitz, and J.M. Rosen. Noncoding rnas involved in mammary gland development and tumorigenesis: There’sa long way to go. Journal of mammary gland biology and neoplasia, pages 1–16, 2012.
- Tahira et al. (2011) A.C. Tahira, M.S. Kubrusly, M.F. Faria, B. Dazzani, R.S. Fonseca, V. Maracaja-Coutinho, S. Verjovski-Almeida, M.C.C. Machado, and E.M. Reis. Long noncoding intronic rnas are differentially expressed in primary and metastatic pancreatic cancer. Molecular cancer, 10(1):141, 2011.
- Tsai et al. (2011) M.C. Tsai, R.C. Spitale, and H.Y. Chang. Long intergenic noncoding rnas: new links in cancer progression. Cancer research, 71(1):3–7, 2011.
- Wang et al. (2011) X. Wang, X. Song, C.K. Glass, and M.G. Rosenfeld. The long arm of long noncoding rnas: roles as sensors regulating gene transcriptional programs. Cold Spring Harbor perspectives in biology, 3(1), 2011.
- Weile et al. (2007) C. Weile, P. Gardner, M. Hedegaard, and J. Vinther. Use of tiling array data and rna secondary structure predictions to identify noncoding rna genes. Bmc Genomics, 8(1):244, 2007.
- Wickham (2009) Hadley Wickham. ggplot2: elegant graphics for data analysis. Springer New York, 2009. ISBN 978-0-387-98140-6. URL http://had.co.nz/ggplot2/book.
- Willard and Koochekpour (2012) S.S. Willard and S. Koochekpour. Regulators of gene expression as biomarkers for prostate cancer. American Journal of Cancer Research, 2(6):620, 2012.
- Wu et al. (2004) Z. Wu, R.A. Irizarry, R. Gentleman, F. Martinez-Murillo, and F. Spencer. A model-based background adjustment for oligonucleotide expression arrays. Journal of the American Statistical Association, 99(468):909–917, 2004.
- Yeager et al. (2007) M. Yeager, N. Orr, R.B. Hayes, K.B. Jacobs, P. Kraft, S. Wacholder, M.J. Minichiello, P. Fearnhead, K. Yu, N. Chatterjee, et al. Genome-wide association study of prostate cancer identifies a second risk locus at 8q24. Nature genetics, 39(5):645–649, 2007.