High abundance ratio of 13CO to C18O toward photon-dominated regions in the Orion-A giant molecular cloud ††thanks: Figures 1, 2 (a) and (b), and 3 (a) are available in electric form at the CDS via anonymous ftp to cdsarc.u-strasbg.fr (130.79.128.5) or via http://cdsweb.u-strasbg.fr/cgi-bin/qcat?J/A+A/.
Abstract
Aims. We derive physical properties such as the optical depths and the column densities of 13CO and C18O to investigate the relationship between the far ultraviolet (FUV) radiation and the abundance ratios between 13CO and C18O.
Methods. We have carried out wide-field (0.4 deg2) observations with an angular resolution of 25.8 ( 0.05 pc) in 13CO (=1–0) and C18O (=1–0) toward the Orion-A giant molecular cloud using the Nobeyama 45 m telescope in the on-the-fly mode.
Results. Overall distributions and velocity structures of the 13CO and C18O emissions are similar to those of the 12CO (=1–0) emission. The optical depths of the 13CO and C18O emission lines are estimated to be 0.05 1.54 and 0.01 0.18, respectively. The column densities of the 13CO and C18O emission lines are estimated to be 0.2 1016 3.7 1017 cm-2 and 0.4 1015 3.5 1016 cm-2, respectively. The abundance ratios between 13CO and C18O, /, are found to be 5.7– 33.0. The mean value of / in the nearly edge-on photon-dominated regions is found to be 16.47 0.10, which is a third larger than that the solar system value of 5.5. The mean value of / in the other regions is found to be 12.29 0.02. The difference of the abundance ratio is most likely due to the selective FUV photodissociation of C18O.
Key Words.:
ISM: individual objects:Orion-A Giant Molecular Cloud – ISM: clouds – (ISM:) photon-dominated region (PDR)1 Introduction
Far ultraviolet (FUV: 6 eV 13.6 eV) radiation emitted from massive stars influences the structure, chemistry, thermal balance, and evolution of the neutral interstellar medium of galaxies (Hollenbach & Tielens, 1997). Furthermore, stars are formed in the interstellar medium (ISM) irradiated by the FUV radiation. Hence, studies of the influence of FUV are crucial for understanding the process of star formation. Regions where FUV photons dominate the energy balance or chemistry of the gas are called photon-dominated regions (PDRs). The FUV emission selectively dissociates CO isotopes more effectively than CO because of the difference in the self shielding (Glassgold et al., 1985; Yurimoto & Kuramoto, 2004; Liszt, 2007; Röllig & Ossenkopf, 2013). The FUV intensity at the wavelengths of the dissociation lines for abundant CO decays rapidly on the surface of molecular clouds, since the FUV emission becomes optically very thick at these wavelengths. For less abundant C18O, which has shifted absorption lines owing to the difference in the vibrational-rotational energy levels, the decay of FUV is much lower. As a result, C18O molecules are expected to be selectively dissociated by UV photons, even in a deep molecular cloud interior. In the dark cloud near a young cluster (IC 5146, for example), the ratio of the 13CO to C18O fractional abundance, /, considerably exceeds the solar system value of 5.5 at visual extinction () values of less than 10 mag (Fig. 19 in Lada et al., 1994). This trend indicates the selective UV photodissociation of C18O. A variation of the abundance ratios of the isotopes is also reported (Wilson, 1999; Wang et al., 2009). For example, the values of / in the solar system, local ISM, Galactic center, and Large Magellanic Cloud (LMC) are measured to be 5.5, 6.1, 12.5, and 40.8. In the Milky way, the isotopic ratio is proportional to the distance from our Galactic center (Wilson, 1999).
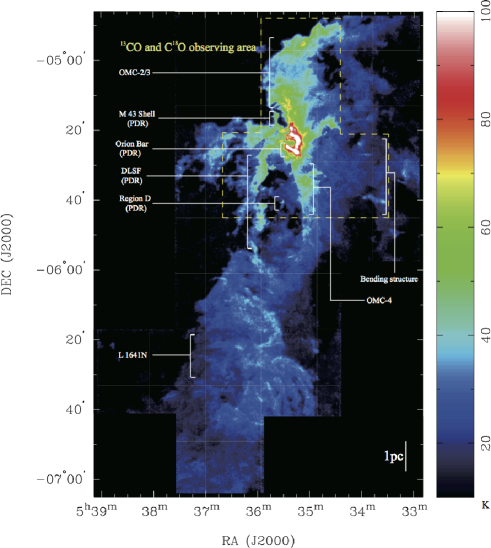
The Orion-A giant molecular cloud (Orion-A GMC) is the nearest GMC ( = 400 pc; Menten et al. (2007); Sandstrom et al. (2007); Hirota et al. (2008)) and is one of the best studied star-forming regions (e.g., Bally et al. (1987); Dutrey et al. (1993); Tatematsu et al. (1999); Johnstone & Bally (1999); Shimajiri et al. (2008, 2009); Takahashi et al. (2008); Davis et al. (2009); Berné et al. (2010); Takahashi et al. (2013); Lee et al. (2013)). In the northern part of the Orion-A GMC, there are three HII regions, M 42, M 43, and NGC 1977 (Goudis, 1982). From the comparison of the AzTEC 1.1 mm and the Nobeyama 45 m 12CO (=1–0), and () 8 m emissions (from polycyclic aromatic hydrocarbons, PAHs) maps, Shimajiri et al. (2011) have identified seven PDRs and their candidates in the northern part of the Orion-A GMC: 1) Orion Bar; 2) the M 43 Shell; 3) a dark lane south filament (DLSF); 4-7) the four regions A-D. Since the stratification among these distributions can be recognized, the PDR candidates are likely to be influenced by the FUV emission from the Trapezium star cluster and from NU Ori in nearly edge-on configuration. Thus, the Orion-A GMC is one of the most suitable targets for investigating the PDRs. Recently, Shimajiri et al. (2013) carried out wide-field (0.17 deg2) and high-angular resolution (21.3 0.04 pc) observations in [CI] line toward the Orion-A GMC. The mapping region includes the nearly edge-on PDRs and the four PDR candidates of the Orion Bar, DLSF, M 43 Shell, and Region D. The overall distribution of the [CI] emission coincides with that of the 12CO emission in the nearly edge-on PDRs, which is inconsistent with the prediction by the plane-parallel PDR model (Hollenbach & Tielens, 1999). The [CI] distribution in the Orion-A GMC is found to be more similar to those of the 13CO (=1–0), C18O (=1–0), and H13CO+ (=1–0) lines rather than that of the 12CO (=1–0) line in the inner part of the cloud, suggesting that the [CI] emission is not limited to the cloud surface, but is tracing the dense, inner parts of the cloud.
| Molecular line | 13CO (=1–0) | C18O (=1–0) |
|---|---|---|
| Rest Frequency [GHz] | 110.201354 | 109.782176 |
| Observation | 2013 May | 2010 March – 2013 May |
| Scan mode | OTF | OTF |
| Mapping size [deg2] | 0.4 | 0.4 |
| Effective beam size [] | 25.8 | 25.8 |
| Velocity resolution [km s-1] | 0.3 | 0.3 |
| Typical noise level in [K] | 0.7 | 0.2 |
This paper is organized as follows: In Sect. 2, the Nobeyama 45 m observations are described. In Sect. 3, we present the 13CO and C18O maps of the Orion-A GMC and estimate the optical depths of the 13CO and C18O gas and the column densities of these molecules. In Sect. 4, we discuss the variation of the ratio of the 13CO to C18O fractional abundance in terms of the FUV radiation. In Sect. 5, we summarize our results. Detailed distributions of the filaments and dense cores and their velocity structure and mass will be reported in a forthcoming paper.
2 NRO 45m observations & data reduction
In 2010 and 2013, we carried out 13CO (=1–0) and C18O (=1–0) mapping observations toward a 0.4 deg2 region in the northern part of the Orion-A GMC with the 25-element focal plane receiver BEARS installed in the 45 m telescope at the Nobeyama Radio Observatory (NRO). The 13CO (=1–0) and C18O (=1–0) data were obtained separately. Figure 1 shows the 13CO and C18O observing areas. At 110 GHz, the telescope has a beam size of 16 (HPBW) and a main beam efficiency, , of 38 % in the 2010 season and 36 % in 2013, which are from observatory measurements at 110 GHz using the S100 receiver. The beam separation of the BEARS is 41.1 on the sky plane (Sunada et al., 2000). As the back end, we used 25 sets of 1024 channel auto-correlators (ACs) which have a 32 MHz bandwidth and a frequency resolution of 37.8 kHz (Sorai et al., 2000). The frequency resolution corresponds to a velocity resolution of 0.1 km s-1 at 110 GHz. During the observations, the system noise temperatures were in a range from 270 K to 470 K in the double sideband (DSB). The standard chopper wheel method was used to convert the observed signal to the antenna temperature, , in units of K, corrected for the atmospheric attenuation. The data are given in terms of the main-beam brightness temperature, . The telescope pointing was checked every 1.5 hours by observing the SiO maser source Ori KL, and was better than 3 throughout the entire observation. The intensity scales of the BEARS 25 beams are different from each other owing to the varying sideband ratios of the beams since the BEARS receiver is operated in DSB mode. To calibrate the different intensity scales, we used calibration data obtained from the observations toward W3 and Orion IRC 2 using another SIS receiver, S100, with a single sideband (SSB) filter and acousto-optical spectrometers (AOSs). The intensity scales between the S100 receiver and the BEARS 25 beams were estimated to be 1.96 – 3.96 for 13CO and 1.57 - 2.77 for C18O.
Our mapping observations were made with the on-the-fly (OTF) mapping technique (Sawada et al., 2008). We used an emission-free area 2∘ away from the mapping area as the off positions. We obtained OTF maps with two different scanning directions along the RA or Dec axes covering the 20 20 or the 20 10 regions, and combined them into a single map to reduce the scanning effects as much as possible. We adopted a spheroidal function111Schwab (1984) is a convolution kernel and Sawada et al. (2008) described the details of the spheroidal function. We applied the parameters = 6 and = 1, which define the shape of the function. (Sawada et al., 2008) to calculate the intensity at each grid point of the final cube data with a spatial grid size of 10, resulting in the final effective resolution of 25.8. The 1 noise level of the final data is 0.5 K for 13CO and 0.14 K for C18O in at a velocity resolution of 0.8 km s-1. By combining scans along the R.A. and Dec. directions, we minimized the so-called scanning effect using the Emerson & Graeve (1988) PLAIT algorithm. We summarize the parameters for the 13CO (=1–0) and C18O (=1–0) line observations in Table 1.
3 Results
3.1 Distributions of the 13CO (=1–0) and C18O (=1–0) emission lines
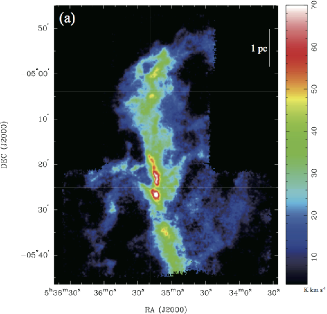
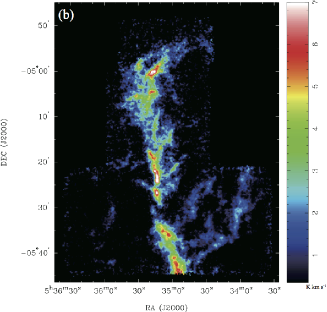
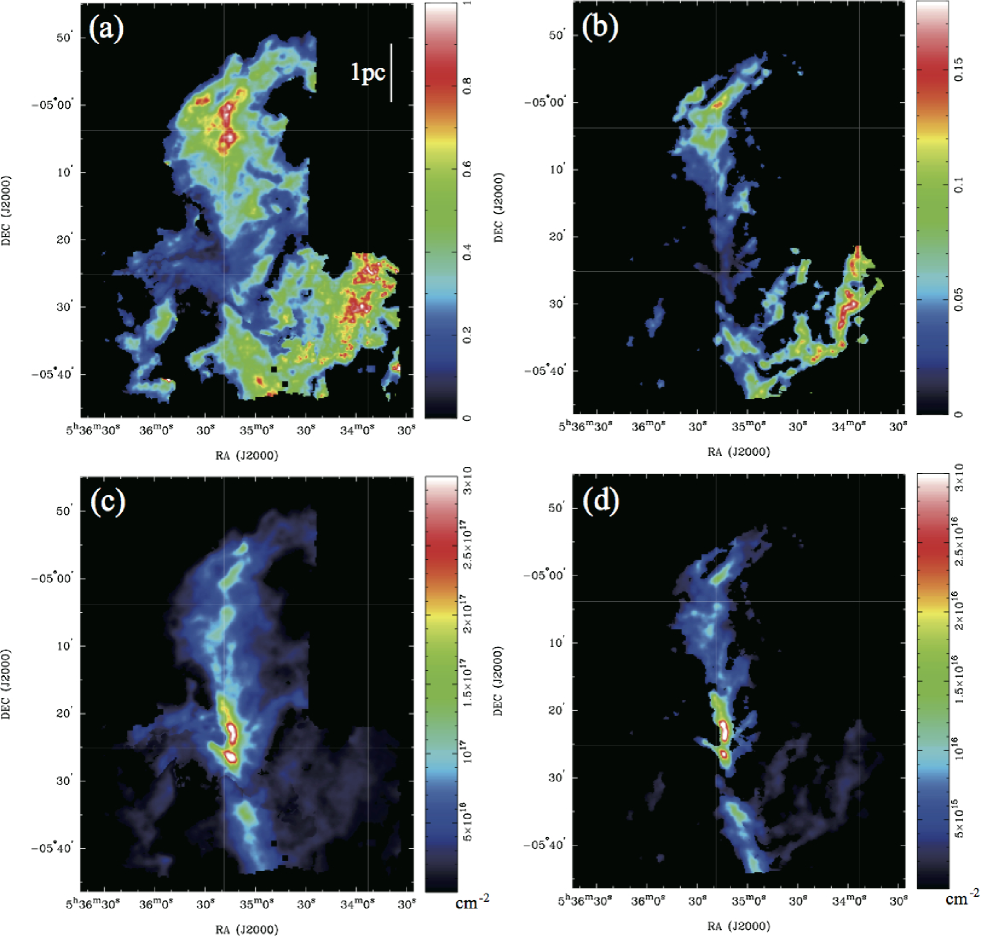
Figures 2 (a) and (b) show the total intensity maps of the 13CO (=1–0) and C18O (=1–0) emission lines, respectively, integrated over a velocity range 4.25 14.25 km s-1 in the northern part of the Orion-A GMC. The overall distributions of the 13CO and C18O emission lines are found to be similar to that of the 12CO (=1–0) emission line by (Shimajiri et al., 2011). In the 13CO map, the brightest position is at (R.A., Dec.) = (5h35m13.s0, -5∘2648.24), which is located on the western side of the Orion bar and is close to the peak position of the [CI] emission (Shimajiri et al., 2013). On the other hand, the peak position in the C18O map is at (R.A., Dec.) = (5h35m15.s7, -5∘2200.24) and is different from the brightest position in the 13CO map. The elongated structure along the north-south direction is a part of the integral-shaped filament observed in the dust-continuum emissions at 850 m (Johnstone & Bally, 1999), 1.2 mm (Davis et al., 2009), and 1.3 mm (Chini et al., 1997) as well as in molecular lines such as 13CO (=1–0), C18O (=1–0), CS (=1–0) (Tatematsu et al., 1993), and H13CO+ (=1–0) (Ikeda et al., 2007). We note that the size of our mapping area centered at the filament is 40 in the east-west direction, wider than those of the previous observations in the 13CO and C18O (=1–0) lines by (Tatematsu et al., 1993). There is a branch of the 13CO and C18O emissions extending toward the southeast of Ori-KL. This structure, called a dark lane south filament, corresponds to one of the PDRs (Rodríguez-Franco et al., 2001; Shimajiri et al., 2011). Moreover, a bending filamentary structure with a length of 3 pc, is seen to the southwest of Ori-KL (also see Fig. 5). These features are also found in our previous observations in the 1.1 mm dust continuum and 12CO (=1–0) emissions (Shimajiri et al., 2011). Hereafter, following Shimajiri et al. (2011), we call these structures the DLSF and the bending structure.
3.2 Velocity structures of the 13CO and C18O emission lines
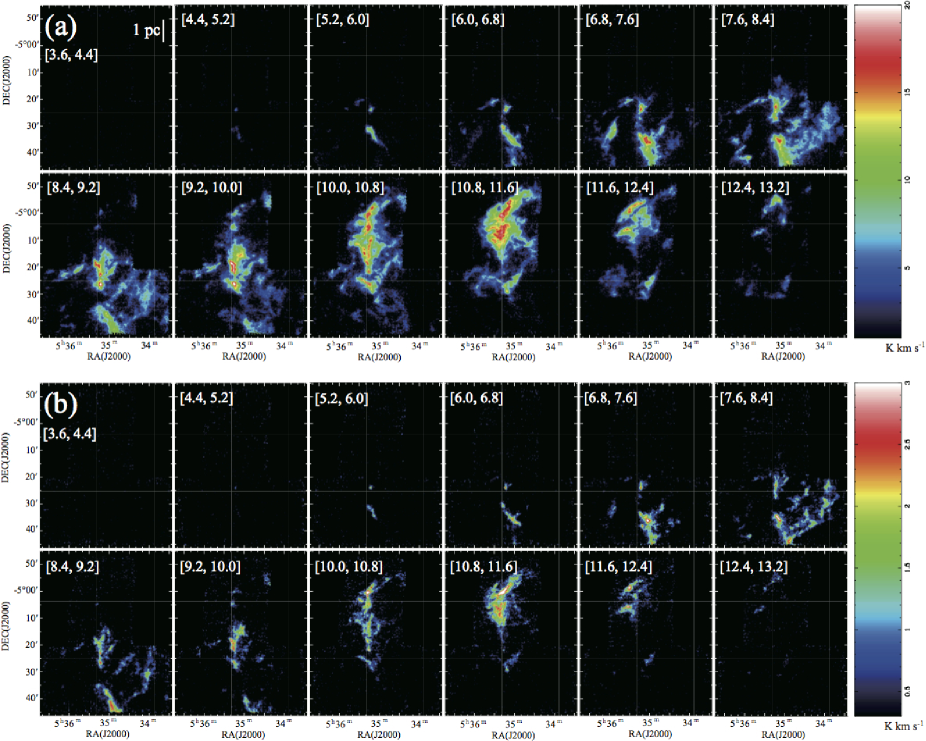
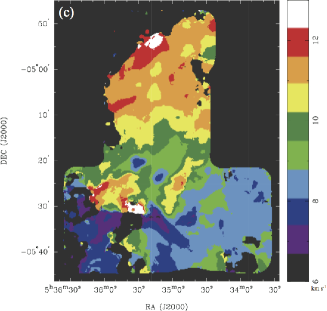
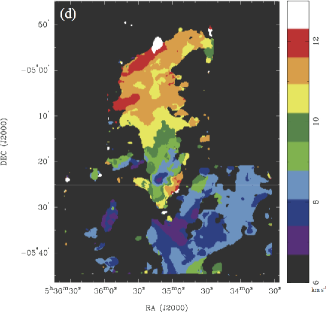
Figures 3 (a) and (b) show the 13CO (=1–0) and C18O (=1–0) velocity channel maps over the range 3.6 13.2 km s-1. In the maps for 4.4 9.2 km s-1, the 13CO and C18O emission lines are distributed in the southern part of the mapping area. On the other hand, in the maps for 10.0 13.2 km s-1, the emission lines are seen in the northern part. These results found the large-scale velocity gradient ( 1 km s-1 pc-1 ), which has been seen in the previous studies in the 12CO, 13CO, H13CO+, and CS lines (Bally et al., 1987; Tatematsu et al., 1993; Ikeda et al., 2007; Shimajiri et al., 2011; Buckle et al., 2012). The velocity gradient from south to north is also seen in the mean velocity maps222The mean velocity maps are produced by using the task MOMENT in MIRIAD and are calculated using the equation . We made them from the 13CO and C18O velocity channel maps with a velocity resolution of 0.3 km s-1 with a clip equal to twice the respective map rms noise level. The 1 noise levels of the 13CO and C18O velocity channel maps are 0.7 K and 0.2 K in units of . of the 13CO and C18O emission lines shown in Figs 2 (c) and 2 (d), respectively. In the maps for 10.8 13.2 km s-1, the 13CO emission line shows a shell-like structure with a size of about two pc toward the south of Ori-KL. Its velocity structure does not follow the large-scale velocity gradient from south to north. The shell can also be recognized in the 12CO map (see Fig 5 in Shimajiri et al. (2011). The overall velocity structures of 13CO and C18O are consistent with those of 12CO (Shimajiri et al., 2011). However, in one of the 13CO channel maps at =10.0 – 10.8 km s-1, a shell-like feature centered at (R.A., Dec.) = (5h34m47s, -5∘3224) can be recognized, and this feature is not obvious in the 12CO and C18O maps.
| Molecular line | Orion-A GMC | L 1551 |
|---|---|---|
| 13CO (=1–0) | 0.67 0.34 km s-1 | 0.22 0.09 km s-1 |
| C18O (=1–0) | 0.53 0.21 km s-1 | 0.13 0.05 km s-1 |
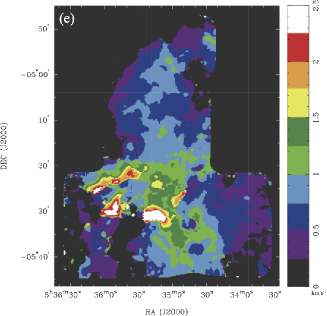
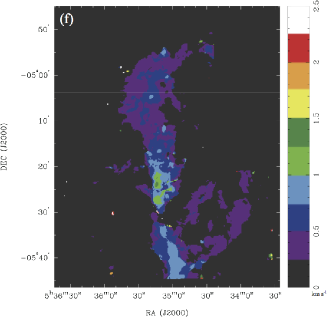
Figures 2 (e) and (f) show the velocity dispersion maps333The velocity dispersion maps are produced by using the task MOMENT in MIRIAD and are calculated using the equation . We made them from the 13CO and C18O velocity channel maps with a velocity resolution of 0.3 km s-1 with a clip equal to twice the respective map rms noise level. of the 13CO (=1–0) and C18O (=1–0) emission lines calculated over the velocity range 5.2 14.0 km s-1. The mean values of the 13CO and C18O velocity dispersions in the observed area are 0.67 0.34 km s-1 (min: 0.30 km s-1, max: 3.6 km s-1) and 0.53 0.21 km s-1 (min: 0.30 km s-1, max: 2.8 km s-1), respectively. In Table 2, we compare the velocity dispersions in the Orion-A GMC and a low-mass star-forming region, L 1551 (Yoshida et al., 2010). The velocity dispersions in the Orion-A GMC are three to four times larger than those in L 1551. Both the 13CO and C18O velocity dispersion maps show that the velocity dispersion becomes the largest in the OMC 1 region. In addition, the velocity dispersion in the integral-shaped filament is relatively high compared with that in the outer region of the filament. The 12CO velocity dispersion increases toward the east of the OMC-2/3 filament (see Fig. 7 in Shimajiri et al., 2011). However, these increments in the 13CO and C18O velocity dispersions are not recognized in our maps.
3.3 Column densities of the 13CO and C18O gas and the abundance ratio of 13CO to C18O
Previous studies in the Orion-A GMC revealed that the mean density values, , of the filaments traced in 13CO and the dense cores traced in C18O are 2 103 cm-3 and 5 103 cm-3, respectively, assuming a cylinder and sphere (Nagahama et al., 1998; Ikeda & Kitamura, 2009). These values are comparable to the critical densities of the 13CO and C18O (=1–0) lines, validating the local thermodynamic equilibrium (LTE) assumption. We estimated the column densities of 13CO and C18O on the assumption that the rotational levels of the 13CO and C18O gas are in the LTE. The optical depths and column densities of these molecules, and where X=13CO and C18O, can be derived using the equations (e.g., Kawamura et al. (1998))
| (1) |
| (2) |
| (3) |
and
| (4) |
where is the excitation temperature of these molecules in K, and = 1 / (exp[5.29/] -1) for 13CO and = 1/ (exp[5.27/] -1) for C18O. The beam filling factors of and for 13CO and C18O, respectively, are assumed to be 1.0 (also see Sect. 4.2.1). Here, Eqs. (2) and (4) assume that the line profile can be approximated by a Gaussian function. The peak brightness temperature, , and the FWHM line widths, (13CO) and (C18O) are in units of K and km s-1, respectively. We derived and by fitting a Gaussian to the observed spectrum at each pixel. We considered the peak brightness temperature of 12CO (=1–0), , at each position (Fig. 1) as the values of 13CO and C18O, assuming that the 12CO emission is optically thick and that the 12CO lines are not self-absorbed by cold foreground gas. The range of is from 12.7 K to 108.0 K and the mean value is 35.0 K.
For the pixels having signal-to-noise ratios greater than 8, we derived the optical depths and the column densities as shown in Fig. 4. The optical depths of the 13CO and C18O lines are estimated to be 0.05 1.54 and 0.01 0.18, respectively (see Figs. 4 (a) and (b)). The C18O emission is optically thin for most of the observed region. Although the column density of the Orion-A GMC is high, molecules in the =1-0 transition lines become optically thin owing to the high temperature of 20 K. In the northern and southern parts of the mapping area where the temperature is relatively low, the optical depths are relatively thick. In contrast, in the central part where the temperature is large, the optical depth becomes small. The column densities of the 13CO and C18O gas are estimated to be 0.2 1016 3.7 1017 and 0.4 1015 3.5 1016 cm-2, respectively. The column density around Ori-KL is high owing to the high temperature (above 100 K) in spite of the small optical depth. In contrast, the column density in the northern and southern parts is relatively low owing to the low temperature (below 50 K) in spite of the relatively large optical depth. We summarize these values in Table 3.
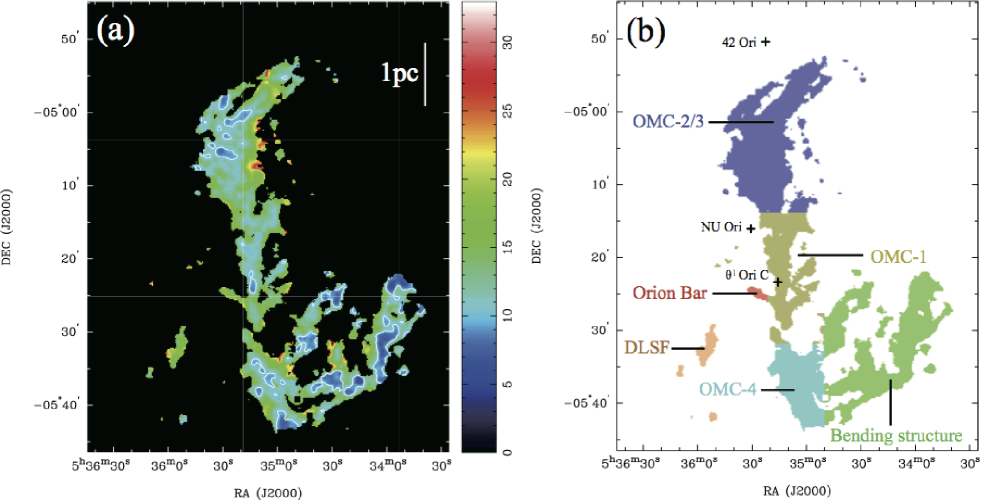
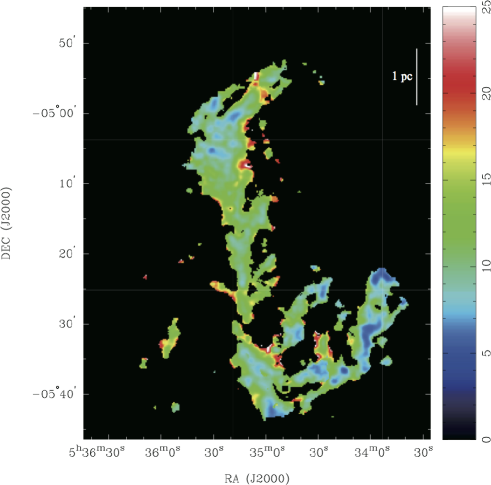
Because the fractional abundances of 13CO (=/) and C18O (=/) are proportional to their column densities, their abundance ratio can be derived as /=/. Based on the observed column densities, we found that the abundance ratio varies in the range of 5.7 / 33.0 within the observed area. The / distribution in Fig. 5 (a) clearly shows that the ratio becomes higher in the nearly edge-on PDRs and the outskirts of the cloud. In the OMC-1, OMC-2/3, bending structure, and OMC-4 regions, the mean abundance ratio is 12.29 0.02 (see also Fig. 5 (b)). On the other hand, in the nearly edge-on PDRs of the Orion-Bar, and the DLSF, and the outskirts of the cloud, the abundance ratio exceeds 15. The abundance ratio in each region is summarized in Table 4.
| Molecule | beam filling factor | Optical depth | Column density | |
|---|---|---|---|---|
| 13CO | 1.0 | 0.05– 1.54 | (0.2– 37.1) 1016 cm-2 | |
| C18O | 1.0 | 0.01– 0.18 | (0.4– 35.1) 1015 cm-2 | |
| 13CO | 0.8 | 0.06 – 4.09 | (0.3 – 48.0) 1016 cm-2 | |
| C18O | 0.8 | 0.01 – 0.23 | (0.5 – 43.9) 1015 cm-2 | |
| 13CO | 30 K | 1.0 | 0.05 – 1.53 | (0.3 – 22.1) 1016 cm-2 |
| C18O | 20 K | 1.0 | 0.02 – 0.29 | (0.5 – 9.9) 1015 cm-2 |
| 13CO | 30 K | 0.8 | 0.06 – 3.91 | (0.4 – 55.0) 1016cm-2 |
| C18O | 20 K | 0.8 | 0.03 – 0.38 | (0.6 – 12.7) 1015 cm-2 |
| Orion-Bar | DLSF | OMC-1 | OMC-2/3 | OMC-4 | Bending structure | ||||
|---|---|---|---|---|---|---|---|---|---|
| 1.0 | 1.0 | 16.58 0.17 | 15.83 0.14 | 12.14 0.04 | 12.92 0.04 | 11.64 0.05 | 11.68 0.04 | ||
| 1.0 | 0.8 | 13.25 0.14 | 12.61 0.12 | 9.68 0.03 | 10.26 0.03 | 9.25 0.04 | 9.25 0.03 | ||
| 0.8 | 0.8 | 16.90 0.18 | 16.80 0.16 | 12.53 0.04 | 14.06 0.04 | 12.46 0.05 | 12.61 0.04 | ||
| 30 K | 20 K | 1.0 | 1.0 | 27.45 0.25 | 22.82 0.21 | 20.23 0.07 | 18.78 0.06 | 16.25 0.08 | 14.12 0.05 |
| 30 K | 20 K | 1.0 | 0.8 | 21.79 0.20 | 18.09 0.17 | 15.99 0.05 | 14.76 0.05 | 12.81 0.06 | 11.18 0.04 |
| 30 K | 20 K | 0.8 | 0.8 | 30.27 0.28 | 25.14 0.25 | 24.31 0.11 | 22.17 0.07 | 18.08 0.10 | 14.59 0.06 |
| Number of pixels | 108 | 371 | 2673 | 5487 | 2150 | 5061 |
4 Discussion
4.1 Selective FUV photodissociation of C18O
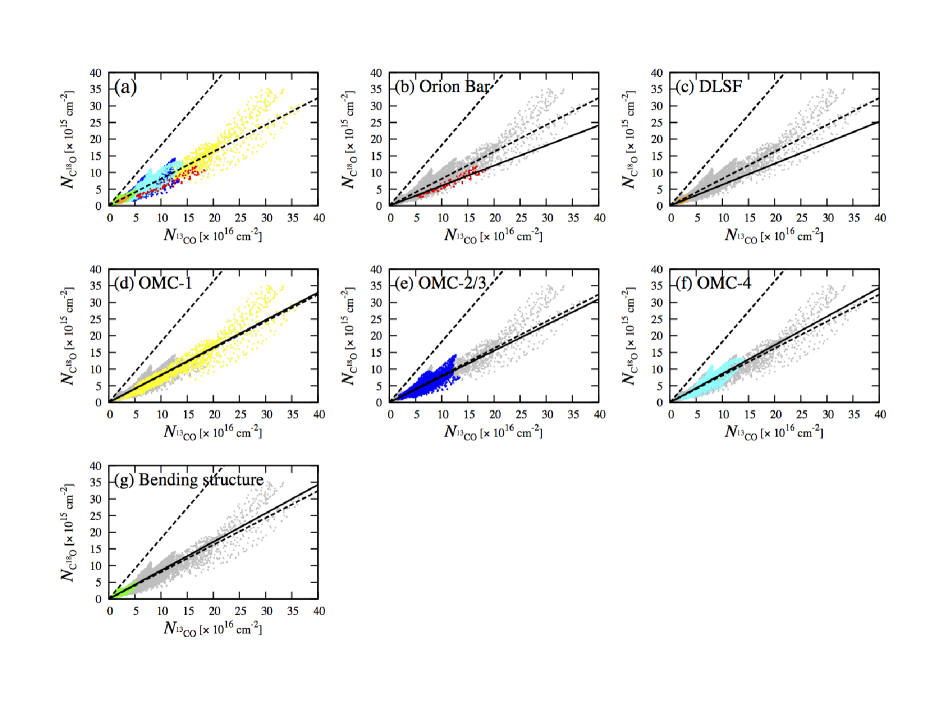
The significant difference between the abundance ratios of / in the PDRs and the other regions are clearly demonstrated in the correlation diagrams between the column densities of 13CO and C18O in Fig. 6. In OMC-1, OMC-2/3, OMC-4, and bending structure, the mean values of / are 12.14 0.04, 12.92 0.04, 11.64 0.05, and 11.68 0.04, respectively. On the other hand, in the PDR regions of the Orion bar and DLSF, the mean values of / are 16.58 0.04 and 15.83 0.14, respectively. The / values of 16 is a factor of three larger than the value of 5.5 in the solar system (Wilson & Matteucci, 1992). It should represent the chemical difference between the PDRs and the other regions. The chemical difference between the PDR and the other regions is likely to be caused by the different FUV intensities around the regions. Since the FUV intensities around the PDR regions are considerably higher than those around the other regions, the selective UV photodissociation of C18O (Yurimoto & Kuramoto, 2004; Lada et al., 1994) efficiently occurs over the entire PDR region. Thus, the / value should be higher in the PDRs.
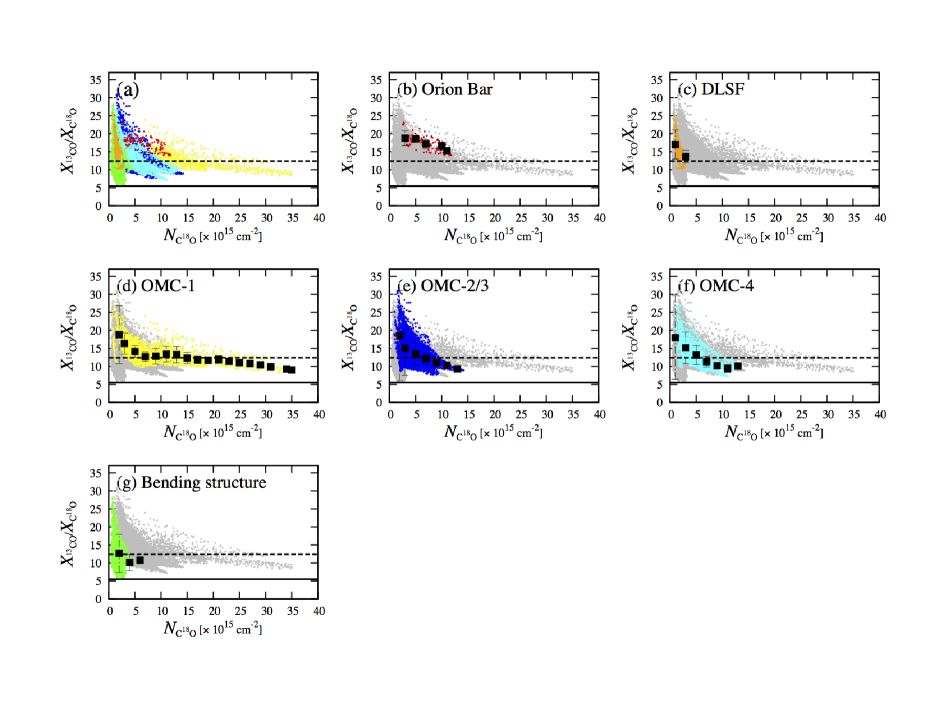
The interstellar UV radiation probably also causes the selective UV photodissociation of C18O in the outskirts of the cloud. Figures 7 (d), (e), (f), and (g) show that the / ratios at low column densities are as high as the ratios in the PDRs, while the ratios decrease with increasing column densities. The theoretical study predicts that the / ratio reaches values between f5 and 10 in regions with = 1 – 3 (Warin et al., 1996). The / values at low column densities in the OMC-1, OMC-2/3, OMC-4, and bending structure regions are, however, higher than the predicted values of 5 to 10. The reason might be that these regions are influenced by the FUV radiation from OB stars embedded in the Orion-A GMC such as the NGC 1977, M 43, and Trapezium cluster ( Ori C), as well as the interstellar UV radiation. In OMC-1, which is the closest region to the Trapezium cluster ( Ori C), the / ratios are higher than those at the same column density in OMC-2/3, OMC-4, and bending structure, although the ratios decrease with increasing column densities.
In addition, the / ratio remains high even at larger values than the theoretically predicted values of 1 to 3 mag (Warin et al., 1996). We can estimate the value from the column density by using the following relation derived in the Taurus region by Frerking et al. (1982):
| (5) |
Thus, the value of = 4.0 1014 cm-2, which is the lowest value of the C18O column density in the observed area, corresponds to the value of = 4.5 mag. We note that this value of should be the lower limit, because the C18O molecules are likely to be selectively dissociated by the FUV radiation. We conclude that the FUV radiation penetrates the innermost part of the cloud and the whole of our observed region is chemically influenced by the FUV radiation from the OB stars embedded in the Orion-A GMC.
The chemical fractionation of 13C+ + 12CO 13CO + 12C+ ( E = 35 K) is considered to occur at the cloud surface (Langer et al., 1984). The selective photodissociation of C18O is, however, thought to be more dominant than the chemical fractionation, because the temperature of the low column density areas ( 5 1015 cm-2) of the Orion-A GMC is high ( = 28.4 9.7 K).
4.2 Influence of the uncertainties in the beam filling factor and the excitation temperature on our derived abundance ratio of 13CO to C18O
4.2.1 Influence of the beam filling factor
In Sect. 3.3, we derived the optical depths and column densities of 13CO and C18O by using Eqs (1) - (4) assuming that the emitting region fills the beam, i.e., the beam filling factors, and , are 1.0. Here, we investigate the influence of the beam filling factor on the derived physical properties.
According to Nummelin et al. (1998) and Kim et al. (2006), we can estimate the beam filling factor by the equation
| (6) |
where and are the source and beam sizes, respectively. The effective beam size of the 13CO and C18O data is 25.8, which corresponds to 0.05 pc at the distance of the Orion-A GMC. The sizes of the structures traced by the 13CO and C18O emission lines in the Orion-A GMC can be estimated from previous observations. The C18O emission is thought to trace the dense cores, clumps, and/or filaments. On the other hand, the 13CO emission is likely to trace more extended components than the C18O emission as seen in the integrated intensity maps (Figures 2 (a) and (b)). Previous observations toward the Orion-A GMC in H13CO+ (1–0) using the Nobeyama 45m telescope identified 236 dense cores with the clumpfind algorithm (Ikeda et al., 2007). They estimated the size corrected for the antenna-beam size on the assumption of a Gaussian intensity profile and revealed that the typical size of dense cores traced in H13CO+ is 0.14 pc. The sizes of the dense cores traced in C18O are expected to exceed 0.14 pc, since the critical density of H13CO+ is higher than that of C18O. As a reference, previous observations toward the Taurus cloud, which is one of the nearest low-mass star forming regions ( = 140 pc, Elias (1978)), revealed that the typical size of the dense cores traced in C18O is 0.1 pc (Onishi et al., 1996). Furthermore, the Herschel observations in the 70 m, 160 m, 250 m, 350 m, and 500 m emissions revealed the omnipresence of parsec-scale filaments in molecular clouds and found that the filaments have very narrow widths: a typical FWHM value of 0.1 pc (Arzoumanian et al., 2011; Palmeirim et al., 2013). From the above, the sizes of the dense cores, clumps, and/or filaments traced in 13CO and C18O are expected to exceed 0.1 pc. In the case of our observations, the beam filling factor is expected to exceed 0.8 on the assumption that 0.1 pc and = 0.05 pc. In Tables 3 and 4, we summarize the optical depths, the column densities, and the abundance ratios of 13CO to C18O. The values on the assumption of = 1.0 and = 0.8 decrease compared with those of = = 1.0. Nevertheless, the values in the nearly edge-on PDRs of Orion Bar and DLSF are (2.3-2.4) times larger than the solar system value. Furthermore, the values even in the OMC-1, OMC-2/3, OMC-4, and bending structure are also (1.7-1.9) times larger than the solar system value. Even after taking into consideration of uncertainties in the beam filling factors of 13CO and C18O, we safely conclude that the abundance ratio of 13CO to C18O is significantly high toward the nearly edge-on PDRs in the Orion-A GMC.
4.2.2 Influence of the excitation temperature
To estimate the optical depths and the column densities, we considered the 12CO (=1–0) peak temperature in as the excitation temperatures of 13CO (=1–0) and C18O (=1–0). There is, however, a possibility that the 13CO and C18O lines trace colder areas than the 12CO line, because the 13CO and C18O lines are optically thinner than the 12CO line and probably trace the inner parts of the cloud. Castets et al. (1990) found that the 13CO and C18O line emissions trace the regions with a temperature of 20 – 30 K and 20 K, respectively, from the observations toward the Orion-A GMC in the 13CO (2–1, 1–0) and C18O (2–1, 1–0) line emissions with low angular resolutions of 100 – 140. Therefore, in order to investigate the influence of the uncertainties in excitation temperature on the derived physical properties, we also derived the physical properties on the assumption of = 30 K and = 20 K. These values are summarized in Tables 3 and 4.
The optical depths obtained with the assumption of = 30 K and = 20 K are similar to those for = . In contrast, the column densities derived on the assumption of = are overestimated by a factor of 1.5-3.0. The values are, however, estimated to be a factor of 1.2 – 1.9 larger than the values obtained with the assumption of = . Thus, the values in the Orion-A GMC are (2.5 – 5.0) times larger than the solar system value, even after taking into consideration the uncertainties in the 13CO and C18O (=1–0) excitation temperatures.
4.2.3 Robustness of the high abundance ratio of 13CO to C18O
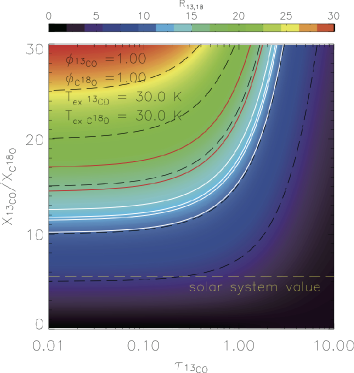
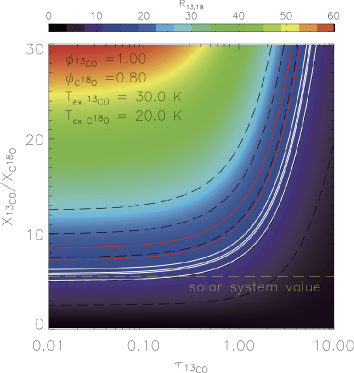
Finally, we demonstrate that the high abundance ratio of 13CO to C18O is most likely to be a direct consequence of the high intensity ratio of 13CO to C18O in the Orion-A GMC. Figure 8 shows the distribution of the integrated intensity ratio of 13CO (=1–0) to C18O (=1–0), = /. The mean value within the observed area is found to be 11.4 3.2 (min: 4.9, max:32.3). The values in the six distinct regions are summarized in Table 5. The values in the nearly edge-on PDRs of the Orion Bar and DLSF seem larger than those in the other regions. The observed intensity ratio, , is related with the six parameters of , , , , , and (=) as follows:
| (7) |
Figure 9 shows contour maps of in the - / plane for the minimum and maximum values of the coefficient of / / in equation (7). The value increases with the increasing abundance ratio, if 1. To explain the mean value of 11.4 within the observed area, the lower limits of the abundance ratio, , are 11.5 for the maximum case in the left panel and 5.8 for the minimum case in the right panel. Furthermore, the lower limits of the values in the nearly edge-on PDRs of the Orion Bar and DLSF are 17.1 and 14.6 for the maximum case and 14.6 and 7.3 for the minimum case. In addition, the lower limits of the values in the OMC-1, OMC-2/3, OMC-4, and bending structure are 12.6, 11.8, 11.5, and 10.1 for the maximum case and 6.3, 5.9, 5.8, and 5.4 for the minimum case. In spite of the uncertainties in our adopted parameters in equation (7), we conclude that the the lower limits of values in the nearly edge-on PDRs tend to be larger than those in the other regions and the values within the observed area are (1.3 - 3.1) times larger than the solar system value of 5.5. .5.
| Region | |
|---|---|
| Orion-Bar | 17.0 1.9 |
| DLSF | 14.5 2.7 |
| OMC-1 | 12.5 2.5 |
| OMC-2/3 | 11.7 3.1 |
| OMC-4 | 11.4 3.4 |
| Bending structure | 10.1 3.0 |
| entire region | 11.4 3.2 |
5 Conclusions
We have carried out wide-field (0.4 deg2) observations with an angular resolution of 25.8 ( 0.05 pc) in the 13CO (=1–0) and C18O (=1–0) emission lines toward the Orion-A GMC. The main results are summarized as follows:
-
1.
The overall distributions and velocity structures of the 13CO and C18O emission lines are similar to those of the 12CO (=1–0) emission line. The 13CO velocity channel maps show a new shell-like structure, which is not obvious in the 12CO and C18O maps.
-
2.
We estimated the optical depths and column densities of the 13CO and C18O emission lines. The optical depths of 13CO and C18O are estimated to be 0.05 1.54 and 0.01 0.18, respectively. The column densities of the 13CO and C18O gas are estimated to be 0.2 1016 3.7 1017 and 0.4 1015 3.5 1016 cm-2, respectively.
-
3.
The abundance ratio between 13CO and C18O, /, is found to be 5.7 – 33.0. The mean value of / of the the nearly edge-on PDRs such as the Orion Bar and DLSF are 16.5, which is a factor of three larger than the solar system value of 5.5. On the other hand, the mean value of / in the other regions is 12.3. The difference between the abundance ratios in nearly edge-on PDRs and the other regions are likely due to the different intensities of the FUV radiation that cause the selective photodissociation of C18O.
-
4.
In the low column density regions ( 5 1015 cm-2), we found that the abundance ratio exceeds 10. These regions are thought to be influenced by the FUV radiation from the OB stars embedded in the Orion-A GMC such as the NGC 1977, M 43, and Trapezium cluster as well as the interstellar UV radiation.
-
5.
To examine the influence of the beam filling factor in our observations on the abundance ratio of 13CO to C18O, we estimated the beam filling factors for the 13CO and C18O gas to exceed 0.8. After taking into consideration the uncertainties in the beam filling factor, we also found the high abundance ratio / over the Orion-A cloud, particularly toward the nearly edge-on PDRs.
-
6.
Even if we consider the lower excitation temperatures of = 30 K and = 20 K, we come to the same conclusion that the abundance ratio / becomes high toward the nearly edge-on PDRs.
-
7.
We checked the robustness of our conclusions in the Orion-A GMC by varying , , , , , and /. To explain the mean value of 11.4 for the intensity ratio in our observed region, the lower limit of the / value should be (5.8 – 11.5) times larger than the solar system value of 5.5. In addition, the / values in the nearly edge-on PDRs are most likely larger than those in the other regions.
-
8.
When studying the range of possible values of the beam filling factors and of the excitation temperatures, the conclusion remains valid that the / values are higher than solar throughout Orion A, and larger in the PDRs than in the diffuse medium.
Acknowledgements.
We acknowledge the anonymous referee for providing helpful suggestions to improve this paper. The 45-m radio telescope is operated by Nobeyama Radio Observatory, a branch of National Astronomical Observatory of Japan. This work was supported by JSPS KAKENHI Grant Number 90610551. Part of this work was supported by the ANR-11-BS56-010 project “STARFICH”.References
- Arzoumanian et al. (2011) Arzoumanian, D., André, P., Didelon, P., et al. 2011, A&A, 529, L6
- Bally et al. (1987) Bally, J., Langer, W. D., Stark, A. A., & Wilson, R. W. 1987, ApJ, 312, L45
- Berné et al. (2010) Berné, O., Marcelino, N., & Cernicharo, J. 2010, Nature, 466, 947
- Buckle et al. (2012) Buckle, J. V., Davis, C. J., Francesco, J. D., et al. 2012, MNRAS, 422, 521
- Castets et al. (1990) Castets, A., Duvert, G., Dutrey, A., et al. 1990, A&A, 234, 469
- Chini et al. (1997) Chini, R., Reipurth, B., Ward-Thompson, D., et al. 1997, ApJ, 474, L135
- Davis et al. (2009) Davis, C. J., Froebrich, D., Stanke, T., et al. 2009, A&A, 496, 153
- Dutrey et al. (1993) Dutrey, A., Duvert, G., Castets, A., et al. 1993, A&A, 270, 468
- Elias (1978) Elias, J. H. 1978, ApJ, 224, 857
- Emerson & Graeve (1988) Emerson, D. T. & Graeve, R. 1988, A&A, 190, 353
- Frerking et al. (1982) Frerking, M. A., Langer, W. D., & Wilson, R. W. 1982, ApJ, 262, 590
- Glassgold et al. (1985) Glassgold, A. E., Huggins, P. J., & Langer, W. D. 1985, ApJ, 290, 615
- Goudis (1982) Goudis, C., ed. 1982, Astrophysics and Space Science Library, Vol. 90, The Orion complex: A case study of interstellar matter
- Hirota et al. (2008) Hirota, T., Ando, K., Bushimata, T., et al. 2008, PASJ, 60, 961
- Hollenbach & Tielens (1997) Hollenbach, D. J. & Tielens, A. G. G. M. 1997, ARA&A, 35, 179
- Hollenbach & Tielens (1999) Hollenbach, D. J. & Tielens, A. G. G. M. 1999, Reviews of Modern Physics, 71, 173
- Ikeda & Kitamura (2009) Ikeda, N. & Kitamura, Y. 2009, ApJ, 705, L95
- Ikeda et al. (2007) Ikeda, N., Sunada, K., & Kitamura, Y. 2007, ApJ, 665, 1194
- Johnstone & Bally (1999) Johnstone, D. & Bally, J. 1999, ApJ, 510, L49
- Kawamura et al. (1998) Kawamura, A., Onishi, T., Yonekura, Y., et al. 1998, ApJS, 117, 387
- Kim et al. (2006) Kim, S.-J., Kim, H.-D., Lee, Y., et al. 2006, ApJS, 162, 161
- Lada et al. (1994) Lada, C. J., Lada, E. A., Clemens, D. P., & Bally, J. 1994, ApJ, 429, 694
- Langer et al. (1984) Langer, W. D., Graedel, T. E., Frerking, M. A., & Armentrout, P. B. 1984, ApJ, 277, 581
- Lee et al. (2013) Lee, K., Looney, L. W., Schnee, S., & Li, Z.-Y. 2013, ApJ, 772, 100
- Liszt (2007) Liszt, H. S. 2007, A&A, 476, 291
- Menten et al. (2007) Menten, K. M., Reid, M. J., Forbrich, J., & Brunthaler, A. 2007, A&A, 474, 515
- Nagahama et al. (1998) Nagahama, T., Mizuno, A., Ogawa, H., & Fukui, Y. 1998, AJ, 116, 336
- Nakamura et al. (2012) Nakamura, F., Miura, T., Kitamura, Y., et al. 2012, The Astrophysical Journal, 746, 25
- Nummelin et al. (1998) Nummelin, A., Dickens, J. E., Bergman, P., et al. 1998, A&A, 337, 275
- Onishi et al. (1996) Onishi, T., Mizuno, A., Kawamura, A., Ogawa, H., & Fukui, Y. 1996, ApJ, 465, 815
- Palmeirim et al. (2013) Palmeirim, P., André, P., Kirk, J., et al. 2013, A&A, 550, A38
- Rodríguez-Franco et al. (2001) Rodríguez-Franco, A., Wilson, T. L., Martín-Pintado, J., & Fuente, A. 2001, ApJ, 559, 985
- Röllig & Ossenkopf (2013) Röllig, M. & Ossenkopf, V. 2013, A&A, 550, A56
- Sandstrom et al. (2007) Sandstrom, K. M., Peek, J. E. G., Bower, G. C., Bolatto, A. D., & Plambeck, R. L. 2007, ApJ, 667, 1161
- Sawada et al. (2008) Sawada, T., Ikeda, N., Sunada, K., et al. 2008, PASJ, 60, 445
- Schwab (1984) Schwab, F. R. 1984, in Indirect Imaging. Measurement and Processing for Indirect Imaging, ed. J. A. Roberts, 333
- Shimajiri et al. (2011) Shimajiri, Y., Kawabe, R., Takakuwa, S., et al. 2011, PASJ, 63, 105
- Shimajiri et al. (2013) Shimajiri, Y., Sakai, T., Tsukagoshi, T., et al. 2013, The Astrophysical Journal Letters, 774, L20
- Shimajiri et al. (2008) Shimajiri, Y., Takahashi, S., Takakuwa, S., Saito, M., & Kawabe, R. 2008, The Astrophysical Journal, 683, 255
- Shimajiri et al. (2009) Shimajiri, Y., Takahashi, S., Takakuwa, S., Saito, M., & Kawabe, R. 2009, PASJ, 61, 1055
- Sorai et al. (2000) Sorai, K., Sunada, K., Okumura, S. K., et al. 2000, in Society of Photo-Optical Instrumentation Engineers (SPIE) Conference Series, Vol. 4015, Radio Telescopes, ed. H. R. Butcher, 86–95
- Sunada et al. (2000) Sunada, K., Yamaguchi, C., Nakai, N., et al. 2000, in Society of Photo-Optical Instrumentation Engineers (SPIE) Conference Series, Vol. 4015, Radio Telescopes, ed. H. R. Butcher, 237–246
- Takahashi et al. (2013) Takahashi, S., Ho, P. T. P., Teixeira, P. S., Zapata, L. A., & Su, Y.-N. 2013, ApJ, 763, 57
- Takahashi et al. (2008) Takahashi, S., Saito, M., Ohashi, N., et al. 2008, ApJ, 688, 344
- Tatematsu et al. (1999) Tatematsu, K., Jaffe, D. T., Plume, R., Evans, II, N. J., & Keene, J. 1999, ApJ, 526, 295
- Tatematsu et al. (1993) Tatematsu, K., Umemoto, T., Kameya, O., et al. 1993, ApJ, 404, 643
- Wang et al. (2009) Wang, M., Chin, Y.-N., Henkel, C., Whiteoak, J. B., & Cunningham, M. 2009, ApJ, 690, 580
- Warin et al. (1996) Warin, S., Benayoun, J. J., & Viala, Y. P. 1996, A&A, 308, 535
- Wilson (1999) Wilson, T. L. 1999, Reports on Progress in Physics, 62, 143
- Wilson & Matteucci (1992) Wilson, T. L. & Matteucci, F. 1992, A&A Rev., 4, 1
- Yoshida et al. (2010) Yoshida, A., Kitamura, Y., Shimajiri, Y., & Kawabe, R. 2010, ApJ, 718, 1019
- Yurimoto & Kuramoto (2004) Yurimoto, H. & Kuramoto, K. 2004, Science, 305, 1763