The Herschel Planetary Nebula Survey (HerPlaNS)††thanks: Herschel is an ESA space observatory with science instruments provided by European-led Principal Investigator consortia and with important participation from NASA.
Abstract
Context. This is the first of a series of investigations into far-IR characteristics of 11 planetary nebulae (PNs) under the Herschel Space Observatory Open Time 1 program, Herschel Planetary Nebula Survey (HerPlaNS).
Aims. Using the HerPlaNS data set, we look into the PN energetics and variations of the physical conditions within the target nebulae. In the present work, we provide an overview of the survey, data acquisition and processing, and resulting data products.
Methods. We perform (1) PACS/SPIRE broadband imaging to determine the spatial distribution of the cold dust component in the target PNs and (2) PACS/SPIRE spectral-energy-distribution (SED) and line spectroscopy to determine the spatial distribution of the gas component in the target PNs.
Results. For the case of NGC 6781, the broadband maps confirm the nearly pole-on barrel structure of the amorphous carbon-richdust shell and the surrounding halo having temperatures of 26–40 K. The PACS/SPIRE multi-position spectra show spatial variations of far-IR lines that reflect the physical stratification of the nebula. We demonstrate that spatially-resolved far-IR line diagnostics yield the (, ) profiles, from which distributions of ionized, atomic, and molecular gases can be determined. Direct comparison of the dust and gas column mass maps constrained by the HerPlaNS data allows to construct an empirical gas-to-dust mass ratio map, which shows a range of ratios with the median of . The present analysis yields estimates of the total mass of the shell to be 0.86 M⊙, consisting of 0.54 M⊙ of ionized gas, 0.12 M⊙ of atomic gas, 0.2 M⊙ of molecular gas, and M⊙ of dust grains. These estimates also suggest that the central star of about 1.5 M⊙ initial mass is terminating its PN evolution onto the white dwarf cooling track.
Conclusions. The HerPlaNS data provide various diagnostics for both the dust and gas components in a spatially-resolved manner. In the forthcoming papers of the HerPlaNS series we will explore the HerPlaNS data set fully for the entire sample of 11 PNs.
Key Words.:
Circumstellar matter – Infrared: stars – Planetary nebulae: general – Planetary nebulae: individual: NGC 40, NGC 2392, NGC 3242, NGC 6445, NGC 6543, NGC 6720, NGC 6781, NGC 6826, NGC 7009, NGC 7026, & PN Mz 3 – Stars: mass-loss – Stars: winds, outflows1 Introduction
The planetary nebula (PN) phase marks the last throes of stellar evolution for low to intermediate initial mass stars (of about 0.8–8 M⊙, Kwok 2000). During this phase, the circumstellar envelope of gas and dust, which is created by mass loss in the preceding asymptotic giant branch (AGB) and post-AGB phases, undergoes a dramatic transformation (i.e., ionization, photo-dissociation, and dynamical shaping) caused by the fast wind and the intense radiation from the central star and by the less powerful but often significant interstellar radiation field coming from the surrounding interstellar space. As a consequence, a wide variety of underlying physical conditions are showcased within PNs, from fully ionized hot plasma to dusty cold atomic/molecular clouds, which exist (at least to first order) in a stratified manner around the central star. Therefore, PNs provide excellent astrophysical laboratories to test theories of stellar evolution as well as theories of gas-dust dynamical processes in interacting stellar winds that can also interact with the surrounding interstellar medium (ISM).
While PN investigations have been traditionally done through diagnostics of optical emission lines, PNs are bright sources at a wide range of wavelengths from the radio through the UV, and in some cases, even in the X-ray (e.g., Pottasch et al. 1984; Zijlstra, Pottasch, & Bignell 1989; Siódmiak & Tylenda 2001; Corradi et al. 2003; Schönberner et al. 2005; Sandin et al. 2008; Sahai et al. 2011; Kastner et al. 2012; Guerrero & De Marco 2013). Investigations using far-infrared (far-IR) radiation are especially critical to comprehend PNs as complex physical systems in their entirety, because a large fraction of the nebula mass may reside outside the central ionized region (e.g., Villaver, Manchado, & García-Segura 2002). For example, up to about 4 M⊙ of matter has been found in the far-IR halo of NGC 650 (Ueta, 2006; van Hoof et al., 2013). However, according to the recent mass budget estimates based on the UV to mid-IR photometric survey of the Magellanic Clouds, the amount of circumstellar dust grains has been severely underestimated: only about 3% of the ISM dust grains is accounted for in the warm component of the circumstellar envelopes (Matsuura et al., 2009; Boyer et al., 2012). What this implies is that the most extended cold regions of the circumstellar envelope could contain this “missing mass” component, which can only be detected in the wavelength ranges in the far-IR and longer.
Recent opportunities provided by the Spitzer Space Telescope (Spitzer; Werner et al. 2004), AKARI Infrared Astronomy Satellite (AKARI; Murakami et al. 2007), and Herschel Space Observatory (Herschel; Pilbratt et al. 2010) have made it possible to probe the very extended, coldest parts of PN haloes at the highest spatial resolutions in the far-IR to date (the beam size of several to a few tens of arcsec; e.g., Ueta 2006; Su et al. 2007; van Hoof et al. 2010, 2013; Cox et al. 2011). The new far-IR window has not only given access to the bulk of the matter in the farthest reaches of PNs, but also permitted us to probe the interacting boundary regions between the PN haloes and ISM, spawning new insights into the processing of the mass loss ejecta as they merge into the ISM (e.g., Wareing et al. 2006; Sabin et al. 2010; Zhang et al. 2012).
Among these recent far-IR opportunities, those provided by Herschel are unique: Herschel allows simultaneous probing of the multiple phases of the gaseous components in PNs via far-IR ionic, atomic, and molecular line emission. The Infrared Space Observatory (ISO; Kessler et al. 1996) made detections of far-IR lines from about two dozen PNs (Liu et al., 2001) and another two dozen PN progenitors and other evolved stars (Fong et al., 2001; Castro-Carrizo et al., 2001). However, the ISO apertures typically covered most of the optically-bright regions of the target objects,111The aperture size of the ISO LWS detector in the spatial dimension is about , while the beam size is about radius (Gry et al., 2003). and therefore, the previous ISO spectroscopic analyses were usually performed in a spatially-integrated manner.
Herschel’s spectral mapping capabilities allow us to look for variations of line/continuum strengths as a function of location in the target nebulae, so that the spatially resolved energetics of the circumstellar envelope can be unveiled. Far-IR line maps would help to trace the spatial variations of the electron density, electron temperature, and relative elemental abundance, which may suggest how much of which material was ejected at what time over the course of the progenitor star’s mass loss history. Also revealed is how PNs are influenced by the passage of the ionization front. While such line diagnostics have been routinely performed in the optical line diagnostics in the far-IR can offer an alternative perspective, because (1) far-IR line ratios are relatively insensitive to the electron temperature due to smaller excitation energies of fine-structure transitions in the far-IR, and (2) far-IR line and continuum measurements are often extinction-independent, permitting probes into dusty PNs. Hence, PN investigations in the far-IR with Herschel should have a bearing on abundance determinations and elemental column densities, and therefore can heavily impact analyses in other wavelength regimes.
With the foregoing as motivation, we have conducted a comprehensive far-IR imaging and spectroscopic survey of PNs, dubbed the Herschel Planetary Nebula Survey (HerPlaNS), using nearly 200 hrs of Herschel time by taking advantage of its mapping capabilities – broadband and spectral imaging as well as spatio-spectroscopy – at spatial resolutions made possible by its 3.3 m effective aperture diameter. Our chief objective is to examine both the dust and gas components of the target PNs simultaneously in the far-IR at high spatial resolutions and investigate the energetics of the entire gas-dust system as a function of location in the nebula. In this first installment of the forthcoming HerPlaNS series of papers, we present an overview of the HerPlaNS survey by focusing on the data products and their potential. Below we will describe the schemes of observations and data reduction (§ 2), showcase the basic data characteristics using the PN NGC 6781 as a representative sample (§ 3), and summarize the potential of the data set (§ 4) to pave the way for more comprehensive and detailed analyses of the broadband mapping and spectroscopy data that will be presented in the forthcoming papers of the series.
2 The Herschel Planetary Nebula Survey (HerPlaNS)
| D | R | Dyn. Age | T∗ | X-Ray | |||||
|---|---|---|---|---|---|---|---|---|---|
| Name | PN G | Morpha𝑎aa𝑎aAccording to the classification scheme by Sahai et al. (2011); B: bipolar, E: elongated, L: collimated lobe pair, M: multipolar, R: round, a: ansae, b: bright (barrel-shaped) central region, c: closed outer lobes, h: halo; i: inner bubble, p: point symmetry, s: CSPN apparent, t: bright central toroidal structure; | (kpc) | (pc) | (103 yr) | (103 K) | Sp. Type | H2 | Results |
| NGC 40 | 120.009.8 | Bbsh | 1.0 | 0.11 | 4 | 48 | [WC8] | Y | D |
| NGC 2392 | 197.817.3 | Rsai | 1.3 | 0.14 | 3 | 47 | Of(H) | N | D, P |
| NGC 3242 | 261.032.0 | Ecspaih | 1.0 | 0.10 | 4 | 89 | O(H) | N | D |
| NGC 6445 | 008.003.9 | Mpi | 1.4 | 0.14 | 3 | 170 | … | Y | P |
| NGC 6543 | 096.429.9 | Mcspa | 1.5 | 0.09 | 5 | 48 | Of-WR(H) | N | D, P |
| NGC 6720 | 063.113.9 | Ecsh | 0.7 | 0.13 | 6 | 148 | hgO(H) | Y | N |
| NGC 6781 | 041.802.9 | Bth | 1.0 | 0.32 | 38 | 110 | DAO | Y | N |
| NGC 6826 | 083.512.7 | Ecsah | 1.3 | 0.08 | 5 | 50 | O3f(H) | N | D, P |
| NGC 7009 | 037.734.5 | Lbspa | 1.5 | 0.09 | 3 | 87 | O(H) | N | D, P |
| NGC 7026b𝑏bb𝑏bNot a ChanPlaNS target PN; NGC 7026 from Gruendl et al. (2006), and Mz 3 from Kastner et al. (2003). The point spread function of XMM-Newton does not allow us to determine whether or not a point source is present. | 089.000.3 | Bs | 1.7 | 0.16 | ¡1 | 80 | [WC] | Y | D |
| Mz 3c𝑐cc𝑐cNot a ChanPlaNS target PN; may be a symbiotic/PN mimic (Frew, 2008); data from Kastner et al. (2003). | 331.701.0 | Bps | 1–3 | 0.1–0.2 | 0.6–2 | 32: | … | N | D, P |
2.1 Target Selection
Our aim with HerPlaNS is to generate a comprehensive spatially-resolved far-IR PN data resource which carries a rich and lasting legacy in the follow-up investigations. As HerPlaNS was motivated partly by the Chandra Planetary Nebula Survey (ChanPlaNS; Kastner et al. 2012) conducted with the Chandra X-ray Observatory (Weisskopf et al., 2002), our target list is a subset of the initial ChanPlaNS sample (Cycle 12 plus archival). This sample is volume-limited, with an approximate cutoff distance of 1.5 kpc, and is dominated by relatively high-excitation nebulae (see Kastner et al. 2012 for details). Then, we took into account the far-IR detectability of the target candidates based on the previous observations made with IRAS, ISO, Spitzer, and AKARI. Through this exercise, we selected 11 PNs for comprehensive suites of observations with Herschel, aiming to investigate the potential effects of X-rays on the physics and chemistry of the nebular gas and their manifestations in far-IR PN characteristics. Table 1 lists the whole HerPlaNS sample and its basic characteristics.
2.2 Observing Modes and Strategies
In executing the HerPlaNS survey, we used all observing modes available with the photodetector array camera and spectrometer (PACS; Poglitsch et al. 2010) and the spectral and photometric imaging receiver (SPIRE; Griffin et al. 2010). The log of observations is given in Table LABEL:log.
With PACS, we performed (1) dual-band imaging at 70 m (Blue band) and 160 m (Red band) with oversampling of the telescope point spread function (PSF; diffraction/wavefront error limited) and (2) integral-field-unit (IFU) spectroscopy by spaxels (spectral-pixels), over 51–220 m. For two targets (NGC 40 and NGC 6720), an additional IFU spectroscopy was done at a higher spectral resolution with a raster mapping (i.e., at higher spatial sampling) for specific far-IR fine-structure lines. With SPIRE, we carried out (1) triple-band imaging at 250 m (PSW band), 350 m (PMW band), and 500 m (PLW band), and (2) Fourier-transform spectrometer (FTS) spectroscopy in two overlapping bands to cover 194–672 m (SSW band over 194–313 m with 35 detectors and SLW band over 303–672 m with 19 detectors).
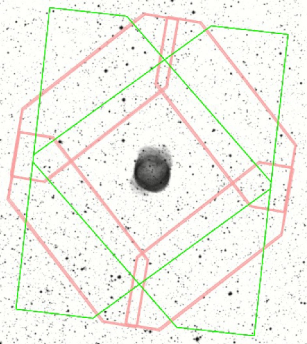
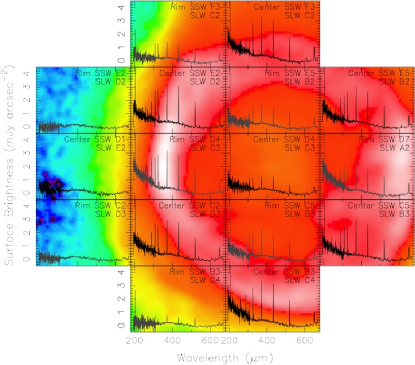
Using these capabilities, we obtained (1) broadband images in the above five bands and (2) IFU spectral cubes in the PACS band, FTS sparsely-sampled spectral array in the SPIRE SSW and SLW bands, and at multiple locations in the target nebulae (“pointings” hereafter). From these IFU spectra it is also possible to extract spectral images over a certain wavelength range (e.g., over a particular line or a continuum) to recover the spatial extent of a specific emission. Fig. 1 shows footprints of detector apertures for NGC 6781, the target PN we consider in detail in this paper, to illustrate how each of these data sets was obtained. In the forthcoming papers of the HerPlaNS series, we will discuss the broadband mapping and spectroscopic data separately for the entire HerPlaNS sample of 11 PNs plus others in the archive.
| Object | OD | Pointing | RA (2000) | DEC (2000) | AOT | Duration | Start Date & Time | Obs. Id |
|---|---|---|---|---|---|---|---|---|
| (h m s) | (d m s) | (Sec) | (UTC) | |||||
| NGC 40 | 788 | Center | 00 13 01.010 | 72 31 19.10 | PacsPhoto | 15038 | 2011-07-10T18:34:30Z | 1342223905 |
| 788 | Center | 00 13 01.010 | 72 31 19.10 | PacsPhoto | 15038 | 2011-07-10T22:46:11Z | 1342223906 | |
| 970 | Center | 00 13 01.010 | 72 31 19.10 | PacsRangeSpec | 13435 | 2012-01-08T14:30:35Z | 1342236879 | |
| 970 | Center | 00 13 01.010 | 72 31 19.10 | PacsRangeSpec | 6673 | 2012-01-08T18:16:42Z | 1342236880 | |
| 1118 | Center | 00 13 01.010 | 72 31 19.10 | PacsLineSpec | 21733 | 2012-06-04T19:48:53Z | 1342246640 | |
| 1118 | Center | 00 13 01.010 | 72 31 19.10 | PacsLineSpec | 33903 | 2012-06-05T01:53:19Z | 1342246641 | |
| 862 | Center | 00 13 01.010 | 72 31 19.10 | SpirePhoto | 721 | 2011-09-23T08:38:43Z | 1342229623 | |
| 1054 | Center | 00 13 01.010 | 72 31 19.10 | SpireSpectrometer | 2936 | 2012-04-02T19:10:28Z | 1342243640 | |
| 1079 | West Rim | 00 12 57.580 | 72 31 26.70 | SpireSpectrometer | 2936 | 2012-04-27T13:26:53Z | 1342245122 | |
| 1054 | Off Sky | 00 12 55.200 | 72 25 30.00 | SpireSpectrometer | 502 | 2012-04-02T19:59:50Z | 1342243641 | |
| NGC 2392 | 888 | Center | 07 29 10.770 | 20 54 42.50 | PacsPhoto | 12486 | 2011-10-18T20:07:55Z | 1342231154 |
| 888 | Center | 07 29 10.770 | 20 54 42.50 | PacsPhoto | 12486 | 2011-10-18T23:37:04Z | 1342231155 | |
| 866 | Center | 07 29 10.770 | 20 54 42.50 | PacsRangeSpec | 16685 | 2011-09-26T16:04:42Z | 1342229792 | |
| 867 | Center | 07 29 10.770 | 20 54 42.50 | PacsRangeSpec | 17895 | 2011-09-27T15:04:58Z | 1342229816 | |
| 862 | Center | 07 29 10.770 | 20 54 42.50 | SpirePhoto | 721 | 2011-09-22T15:32:21Z | 1342229466 | |
| 1079 | Center | 07 29 10.770 | 20 54 42.50 | SpireSpectrometer | 4288 | 2012-04-27T12:02:25Z | 1342245121 | |
| 1079 | South Rim | 07 29 10.500 | 20 54 27.00 | SpireSpectrometer | 3070 | 2012-04-27T11:11:02Z | 1342245120 | |
| 1079 | Off Sky | 07 29 12.900 | 20 57 31.60 | SpireSpectrometer | 502 | 2012-04-27T11:02:19Z | 1342245119 | |
| NGC 3242 | 782 | Center | 10 24 46.090 | 18 38 28.30 | PacsPhoto | 15038 | 2011-07-04T17:56:50Z | 1342223696 |
| 782 | Center | 10 24 46.090 | 18 38 28.30 | PacsPhoto | 15038 | 2011-07-04T22:08:31Z | 1342223697 | |
| 912 | Center | 10 24 46.090 | 18 38 28.30 | PacsRangeSpec | 6673 | 2011-11-12T10:42:02Z | 1342232278 | |
| 912 | Center | 10 24 46.090 | 18 38 28.30 | PacsRangeSpec | 8963 | 2011-11-12T12:35:24Z | 1342232279 | |
| 948 | Center | 10 24 46.090 | 18 38 28.30 | SpirePhoto | 1135 | 2011-12-18T00:36:09Z | 1342234839 | |
| 1098 | Center | 10 24 46.090 | 18 38 28.30 | SpireSpectrometer | 2936 | 2012-05-16T01:00:55Z | 1342245847 | |
| 1098 | South Rim | 10 24 46.520 | 18 38 47.30 | SpireSpectrometer | 2936 | 2012-05-16T00:11:43Z | 1342245846 | |
| 1098 | Off Sky | 10 24 55.510 | 18 33 04.90 | SpireSpectrometer | 502 | 2012-05-16T00:02:55Z | 1342245845 | |
| NGC 6445 | 889 | Center | 17 49 15.210 | 20 00 34.50 | PacsPhoto | 10076 | 2011-10-19T19:20:14Z | 1342231253 |
| 889 | Center | 17 49 15.210 | 20 00 34.50 | PacsPhoto | 10076 | 2011-10-19T22:09:13Z | 1342231254 | |
| 1047 | Center | 17 49 15.210 | 20 00 34.50 | PacsRangeSpec | 6731 | 2012-03-26T02:12:26Z | 1342242440 | |
| 1047 | Center | 17 49 15.210 | 20 00 34.50 | PacsRangeSpec | 3351 | 2012-03-26T04:06:49Z | 1342242441 | |
| 861 | Center | 17 49 15.210 | 20 00 34.50 | SpirePhoto | 307 | 2011-09-22T08:54:34Z | 1342229195 | |
| 1054 | Center | 17 49 15.210 | 20 00 34.50 | SpireSpectrometer | 2800 | 2012-04-02T03:33:34Z | 1342243630 | |
| 1054 | West Lobe | 17 49 14.290 | 20 00 21.80 | SpireSpectrometer | 2800 | 2012-04-02T02:46:41Z | 1342243629 | |
| 1054 | Off Sky | 17 49 14.400 | 20 06 39.60 | SpireSpectrometer | 502 | 2012-04-02T02:37:53Z | 1342243628 | |
| NGC 6543 | 991 | Center | 17 58 33.240 | 66 37 58.80 | PacsRangeSpec | 6731 | 2012-01-29T14:25:29Z | 1342238388 |
| 991 | Center | 17 58 33.240 | 66 37 58.80 | PacsRangeSpec | 3351 | 2012-01-29T16:19:52Z | 1342238389 | |
| 837 | Center | 17 58 33.240 | 66 37 58.80 | SpireSpectrometera𝑎aa𝑎aThese SPIRE spectral-mapping were done originally with full-spatial-sampling, resulting in an insufficient signal: hence the observations were executed again with sparse-spatial-sampling. The rest of the “SpireSpectrometer” observations were done with sparse-spatial-sampling after an AOT revision. | 7027 | 2011-08-29T06:52:20Z | 1342227789 | |
| 972 | Center | 17 58 33.240 | 66 37 58.80 | SpireSpectrometer | 2664 | 2012-01-11T07:28:42Z | 1342237028 | |
| 958 | West Knot | 17 58 17.350 | 66 38 08.30 | PacsRangeSpec | 6731 | 2011-12-27T14:58:17Z | 1342235679 | |
| 958 | West Knot | 17 58 17.350 | 66 38 08.30 | PacsRangeSpec | 3351 | 2011-12-27T16:52:40Z | 1342235680 | |
| 837 | West Knot | 17 58 17.350 | 66 38 08.30 | SpireSpectrometera𝑎aa𝑎aThese SPIRE spectral-mapping were done originally with full-spatial-sampling, resulting in an insufficient signal: hence the observations were executed again with sparse-spatial-sampling. The rest of the “SpireSpectrometer” observations were done with sparse-spatial-sampling after an AOT revision. | 7027 | 2011-08-29T04:43:45Z | 1342227787 | |
| 972 | West Knot | 17 58 17.350 | 66 38 08.30 | SpireSpectrometer | 2664 | 2012-01-11T06:43:58Z | 1342237027 | |
| 837 | Off Sky | 17 58 30.710 | 66 43 49.70 | SpireSpectrometer | 636 | 2011-08-29T06:41:18Z | 1342227788 | |
| NGC 6720 | 938 | Off Center | 18 53 34.500 | 33 01 57.40 | PacsRangeSpec | 6731 | 2011-12-07T12:57:48Z | 1342233716 |
| 938 | Off Center | 18 53 34.500 | 33 01 57.40 | PacsRangeSpec | 8893 | 2011-12-07T14:52:11Z | 1342233717 | |
| 920 | Center | 18 53 35.100 | 33 01 44.90 | PacsLineSpec | 33903 | 2011-11-19T15:41:38Z | 1342232561 | |
| 920 | Center | 18 53 35.100 | 33 01 44.90 | PacsLineSpec | 36925 | 2011-11-20T01:08:48Z | 1342232562 | |
| 1053 | Center | 18 53 35.080 | 33 01 45.00 | SpireSpectrometer | 4288 | 2012-04-01T14:40:15Z | 1342243616 | |
| 1053 | North Rim | 18 53 34.280 | 33 02 09.00 | SpireSpectrometer | 3070 | 2012-04-01T15:52:02Z | 1342243617 | |
| 1053 | Off Sky | 18 53 34.200 | 32 56 04.00 | SpireSpectrometer | 502 | 2012-04-01T16:43:38Z | 1342243618 | |
| NGC 6781 | 887 | Center | 19 18 28.090 | 6 32 19.30 | PacsPhoto | 12681 | 2011-10-17T21:52:48Z | 1342231099 |
| 887 | Center | 19 18 28.090 | 6 32 19.30 | PacsPhoto | 12681 | 2011-10-18T01:25:12Z | 1342231100 | |
| 884 | Center | 19 18 28.090 | 6 32 19.30 | PacsRangeSpec | 13435 | 2011-10-14T20:01:18Z | 1342230999 | |
| 884 | Center | 19 18 28.090 | 6 32 19.30 | PacsRangeSpec | 9995 | 2011-10-14T23:47:25Z | 1342231000 | |
| 884 | Rim | 19 18 31.520 | 6 32 19.80 | PacsRangeSpec | 17899 | 2011-10-15T02:36:09Z | 1342231001 | |
| 884 | Rim | 19 18 31.520 | 6 32 19.80 | PacsRangeSpec | 9995 | 2011-10-15T07:36:40Z | 1342231002 | |
| 880 | Center | 19 18 28.090 | 6 32 19.30 | SpirePhoto | 583 | 2011-10-11T06:57:06Z | 1342230841 | |
| 1053 | Center | 19 18 28.090 | 6 32 19.30 | SpireSpectrometer | 2800 | 2012-04-01T12:21:55Z | 1342243612 | |
| 1053 | Rim | 19 18 31.520 | 6 32 19.80 | SpireSpectrometer | 2800 | 2012-04-01T11:34:58Z | 1342243611 | |
| 1053 | Off Sky | 19 18 32.390 | 6 26 32.10 | SpireSpectrometer | 502 | 2012-04-01T11:26:11Z | 1342243610 | |
| NGC 6826 | 771 | Center | 19 44 48.150 | 50 31 30.30 | PacsPhoto | 10076 | 2011-06-23T22:08:04Z | 1342223188 |
| 771 | Center | 19 44 48.150 | 50 31 30.30 | PacsPhoto | 10076 | 2011-06-24T00:57:03Z | 1342223189 | |
| 1003 | Center | 19 44 48.150 | 50 31 30.30 | PacsRangeSpec | 8963 | 2012-02-10T15:02:19Z | 1342238926 | |
| 1003 | Center | 19 44 48.150 | 50 31 30.30 | PacsRangeSpec | 13338 | 2012-02-10T17:33:54Z | 1342238927 | |
| 962 | Rim | 19 44 52.990 | 50 31 44.60 | PacsRangeSpec | 17899 | 2011-12-31T16:28:58Z | 1342235850 | |
| 962 | Rim | 19 44 52.990 | 50 31 44.60 | PacsRangeSpec | 23333 | 2011-12-31T21:29:29Z | 1342235851 | |
| 862 | Center | 19 44 48.150 | 50 31 30.30 | SpirePhoto | 997 | 2011-09-23T07:04:09Z | 1342229608 | |
| 941 | Center | 19 44 48.150 | 50 31 30.30 | SpireSpectrometerb𝑏bb𝑏bData failure: observation repeated. | 2936 | 2011-12-10T13:12:34Z | 1342233822 | |
| 971 | Center | 19 44 48.150 | 50 31 30.30 | SpireSpectrometer | 2936 | 2012-01-10T09:38:19Z | 1342237006 | |
| 741 | Rim | 19 44 51.230 | 50 31 39.20 | SpireSpectrometera𝑎aa𝑎aThese SPIRE spectral-mapping were done originally with full-spatial-sampling, resulting in an insufficient signal: hence the observations were executed again with sparse-spatial-sampling. The rest of the “SpireSpectrometer” observations were done with sparse-spatial-sampling after an AOT revision. | 8611 | 2011-05-25T16:39:54Z | 1342221687 | |
| 741 | Off Sky | 19 44 27.380 | 50 37 08.90 | SpireSpectrometer | 735 | 2011-05-25T16:27:12Z | 1342221686 | |
| NGC 7009 | 894 | Center | 21 04 10.820 | 11 21 48.60 | PacsPhoto | 14900 | 2011-10-24T18:05:45Z | 1342231400 |
| 894 | Center | 21 04 10.820 | 11 21 48.60 | PacsPhoto | 14900 | 2011-10-24T22:15:08Z | 1342231401 | |
| 913 | Center | 21 04 10.820 | 11 21 48.60 | PacsRangeSpec | 4499 | 2011-11-13T07:27:59Z | 1342232300 | |
| 913 | Center | 21 04 10.820 | 11 21 48.60 | PacsRangeSpec | 5571 | 2011-11-13T08:45:10Z | 1342232301 | |
| 1064 | Center | 21 04 10.820 | 11 21 48.60 | SpirePhoto | 583 | 2012-04-11T23:12:25Z | 1342244153 | |
| 741 | Center | 21 04 10.820 | 11 21 48.60 | SpireSpectrometera𝑎aa𝑎aThese SPIRE spectral-mapping were done originally with full-spatial-sampling, resulting in an insufficient signal: hence the observations were executed again with sparse-spatial-sampling. The rest of the “SpireSpectrometer” observations were done with sparse-spatial-sampling after an AOT revision. | 7651 | 2011-05-25T11:41:29Z | 1342221681 | |
| 1080 | Center | 21 04 10.820 | 11 21 48.20 | SpireSpectrometer | 4288 | 2012-04-27T22:17:32Z | 1342245079 | |
| 1080 | East Flier | 21 04 12.440 | 11 21 43.90 | SpireSpectrometer | 2936 | 2012-04-27T21:28:22Z | 1342245078 | |
| 741 | Off Sky | 21 04 04.280 | 11 16 13.80 | SpireSpectrometer | 675 | 2011-05-25T11:29:48Z | 1342221680 | |
| NGC 7026 | 788 | Center | 21 06 18.570 | 47 51 06.90 | PacsPhoto | 12486 | 2011-07-11T06:43:28Z | 1342223919 |
| 788 | Center | 21 06 18.570 | 47 51 06.90 | PacsPhoto | 12486 | 2011-07-11T10:12:37Z | 1342223920 | |
| 936 | Center | 21 06 18.570 | 47 51 06.90 | PacsRangeSpec | 8959 | 2011-12-06T07:53:03Z | 1342234268 | |
| 936 | Center | 21 06 18.570 | 47 51 06.90 | PacsRangeSpec | 6669 | 2011-12-06T10:24:34Z | 1342234269 | |
| 722 | Center | 21 06 18.570 | 47 51 06.90 | SpirePhoto | 445 | 2011-05-06T00:55:57Z | 1342219975 | |
| 1011 | Center | 21 06 18.570 | 47 51 06.90 | SpireSpectrometer | 2936 | 2012-02-19T02:50:17Z | 1342239347 | |
| 1011 | North Lobe | 21 06 18.520 | 47 51 19.70 | SpireSpectrometer | 2936 | 2012-02-19T02:01:01Z | 1342239346 | |
| 1011 | Off Sky | 21 06 05.180 | 47 52 59.50 | SpireSpectrometer | 502 | 2012-02-19T01:52:18Z | 1342239345 | |
| PN Mz 3 | 1042 | Center | 16 17 13.400 | 51 59 10.60 | PacsRangeSpec | 5567 | 2012-03-21T17:58:45Z | 1342243109 |
| 1042 | Center | 16 17 13.400 | 51 59 10.60 | PacsRangeSpec | 4495 | 2012-03-21T19:33:41Z | 1342243110 | |
| 1229 | Center | 16 17 13.400 | 51 59 10.60 | SpireSpectrometer | 2800 | 2012-09-24T02:21:17Z | 1342251318 | |
| 1229 | South Lobe | 16 17 13.240 | 51 59 25.50 | SpireSpectrometer | 2800 | 2012-09-24T01:34:21Z | 1342251317 | |
| 1229 | Off Sky | 16 17 08.620 | 52 01 59.80 | SpireSpectrometer | 502 | 2012-09-24T01:25:36Z | 1342251316 |
2.3 Data Reduction
| Observing Mode | Instrument/Band | Data Characteristics | ||
|---|---|---|---|---|
| (m) | ||||
| Imaging | PACS/Blue | 70 (25) | scan map (56 beam at 1′′ pix-1) | to field of view |
| PACS/Green | 110 (45) | scan map (68 beam at 1′′ pix-1) | by 2 orthogonal scans | |
| PACS/Red | 160 (85) | scan map (114 beam at 2′′ pix-1) | ||
| SPIRE/PSW | 250 (76) | scan map (182 beam at 6′′ pix-1) | field of view | |
| SPIRE/PMW | 350 (103) | scan map (249 beam at 9′′ pix-1) | by 2 orthogonal scans | |
| SPIRE/PLW | 500 (200) | scan map (363 beam at 14′′ pix-1) | ||
| Spectroscopy | PACS/B2A | 51–72 | spectral cube ( at 96 spaxel-1) | field of view |
| PACS/B2B | 70–105 | spectral cube ( at spaxel-1) | by IFU spaxels | |
| PACS/R1 | 103–145 | spectral cube ( at 116 spaxel-1) | ||
| PACS/R1 | 140–220 | spectral cube ( at 132 spaxel-1) | ||
| SPIRE/SSW | 194–342 | spectral array ( at – beam-1) | diameter field of view | |
| by a 35-bolometer array | ||||
| SPIRE/SLW | 316–672 | spectral array ( at – beam-1) | diameter field of view | |
| by a 19-bolometer array | ||||
Here, we briefly summarize the data reduction steps we adopted. Complete accounts of reduction processes will be presented in the forthcoming papers of the series (D. Ladjal et al. in prep; K. M. Exter et al. in prep). A summary of the HerPlaNS data products and their characteristics is given in Table 3.
2.3.1 Broadband Imaging
To generate broadband images, we used the Herschel interactive processing environment (HIPE, version 11; Ott 2010) and Scanamorphos data reduction tool (Scanamorphos, version 21; Roussel 2013). First, the raw scan map data were processed with HIPE from level 0 to level 1. During this stage, basic pipeline reduction steps were applied while the data were corrected for instrumental effects. The level 1 data were then ingested into Scanamorphos, which corrects for brightness drifts and signal jumps caused by electronic instabilities and performs deglitching, flux calibration, and map projection. Scanamorphos was chosen as our map-making engine over other choices – photoproject (the default HIPE mapper) and MADmap (Cantalupo et al., 2010) – because it reconstructs surface brightness maps of extended sources with the lowest noise, which is of great importance for our purposes. After processing with HIPE and Scanamorphos, we obtained far-IR surface brightness maps at 5 bands (70, 160, 250, 350, and 500 m) for 11 PNs, each covering at most unvignetted field centered at the target source.
2.3.2 PACS Spectroscopy
We used HIPE track 11 with the calibration release version 44 to reduce all of the PACS spectroscopy data of HerPlaNS. Within HIPE, we selected the background normalization PACS spectroscopy pipeline script for long range and SEDs to reduce the range scan data and the same pipeline script for line scans to reduce the line scan data. Our reduction steps follow those described in the PACS Data Reduction Guide: Spectroscopy.555http://herschel.esac.esa.int/hcss-doc-9.0/load/pacs_spec/html/pacs_spec.html (Version 1, Aug. 2012)
In the range scan mode, we used the blue bands B2A (51–72 m) and B2B (70–105 m) and each time we also got simultaneous spectra in the R1 band (103–145 m and 140–220 m), achieving the full spectral coverage from 51–220 m. Each observation results in simultaneous spatial coverage of a field by a set of spaxels of the IFU (each spaxel covering roughly a field). The PACS IFU data cubes can also be integrated over a specific wavelength range to generate a 2-D line map. This process can be done for any line detected at a reasonable S/N.
2.3.3 SPIRE Spectroscopy
We used the standard HIPE-SPIRE spectroscopy data reduction pipeline for the single-pointing mode (version 11 with SPIRE calibration tree version 11) to reduce all of the SPIRE spectroscopy data of HerPlaNS, but with the following three major modifications; (1) we extracted and reduced signal from each bolometer individually instead of signal from only the central bolometer as nominally done for single-pointing observations; (2) we applied the extended source flux calibration correction to our data; and (3) we used our own dedicated off-target sky observations for the background subtraction (Fig. 1). Besides these extra steps, our reduction steps basically copy those described in the SPIRE Data Reduction Guide.666http://herschel.esac.esa.int/hcss-doc-9.0/load/spire_drg/html/spire_drg.html (version 2.1, Document Number: SPIRE-RAL-DOC 003248, 06 July 2012) The standard apodization function was applied to the data to minimize the ringing in the instrument line shape wings at the expense of spectral resolution.
At the end of these processes, each of the on-source (center and off-center) and off-sky pointings would yield 35 short-band spectra777In the SLW band, 2 bolometers out of the total of 37 are blind. from individual hexagonal bolometer positions ( spacing between bolometers) for 194–342 m and 19 long-band spectra from individual hexagonal bolometer positions ( spacing between bolometers) for 316–672 m. The bolometer beams for the short and long band arrays overlap spatially at about a dozen positions, from which the full range spectrum (194–672 m) can be constructed.
We created an off-sky spectrum by taking a median of spectra taken from the detectors located within the unvignetted field (i.e., all but the outermost bolometers) of each off-sky position and subtracting the off-sky spectrum from each on-source spectrum taken from the unvignetted field of the bolometer array. Data from the vignetted outermost bolometers are not included for the present science analyses because these bolometers are not sufficiently calibrated for their uncertainties and long term stabilities by the instrument team. Because of the large data volume collected and redundant spatial coverage by center and off-center pointings for some of the target sources, it is possible to self-calibrate data from the outermost bolometers. However, this is beyond the scope of the present overview and hence will be discussed in the forthcoming papers of the series.
3 HerPlaNS Data: A Case Study of NGC 6781
In the following, we showcase the wealth of the HerPlaNS data set by revealing the far-IR characteristics of NGC 6781. NGC 6781 is an evolved PN888Here, this PN is described as “evolved” to mean that its central star has started descending along the white dwarf cooling track in the Hertzsprung-Russell (H-R) diagram (e.g., Vassiliadis & Wood 1994). whose central star has an effective temperature of 110 kK (DAO spectral type; Frew 2008) and a luminosity of 385 L⊙ for our adopted distance of pc (based on iterative photo-ionization model fitting constrained by various optical line maps; Schwarz & Monteiro 2006).999In the present work, all distance-dependent quantities are derived from the adopted distance of pc (Schwarz & Monteiro, 2006), and hence, its uncertainty propagates in subsequent calculations. The initial and present masses of the central star are estimated to be and M⊙, respectively, via comparison between evolutionary tracks of Vassiliadis & Wood (1994) with photo-ionization model parameters (Fig. 6 of Schwarz & Monteiro 2006). This comparison with evolutionary tracks also suggests that the age of the PN since the AGB turn-off is (2–4) yr (Vassiliadis & Wood, 1994).
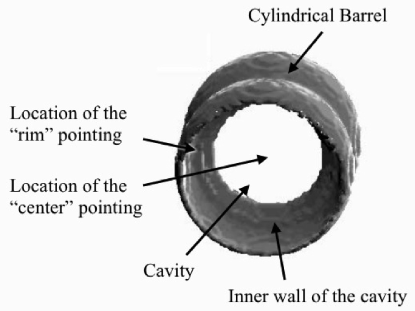
The surface brightness of NGC 6781 in the optical is known to be very low and rather uniform, indicative of its relatively evolved state (i.e., the stellar ejecta have been expanding for (2–4) yr). Previous optical imaging revealed the object’s signature appearance of a bright ring of about diameter, which consists of two separate rings in some parts. The ring emission is embedded in faint extended lobes that are elongated along the NNW-SSE direction (Mavromatakis et al., 2001; Phillips et al., 2011). Morpho-kinematic observations in molecular lines (Zuckerman et al., 1990; Bachiller et al., 1993; Hiriart, 2005) and photo-ionization models (Schwarz & Monteiro, 2006) indicated that the density distribution in the nebula was cylindrical with an equatorial enhancement (i.e., a cylindrical barrel) oriented at nearly pole-on.
The axis of the cylindrical barrel is thought to be inclined roughly at to the line of sight, with its south side pointed to us (Fig. 2). Optical emission line diagnostics yielded a relatively low electron density of about 130–210 cm-3 and an electron temperature of about K (Liu et al., 2004a, b). The dynamical age of the object is at least yr, based on the observed extent of the faintest optical nebula (; Mavromatakis et al. 2001) and the shell expansion velocity of 15 km s-1 (the average of expansion velocities measured from optical lines and molecular radio emission; e.g., Weinberger 1989; Bachiller et al. 1993) at the adopted 950 pc (Schwarz & Monteiro, 2006). This age is consistent with the theoretical estimates mentioned above.
NGC 6781 is representative of the class of axisymmetric, dusty, and molecule-rich PNs (such as NGC 6720 and NGC 6445 in the HerPlaNS sample). These nebulae appear to be distinct from H2-poor objects (such as NGC 2392, NGC 6543, and others in the HerPlaNS sample; Table 1) in terms of progenitor mass, structure, and evolutionary history. It is therefore our aim in the forthcoming papers in the HerPlaNS series to shed light on similarities and differences of the far-IR PN characteristics in the HerPlaNS sample to enhance our understanding of the physical properties of PNs.
3.1 Broadband Imaging
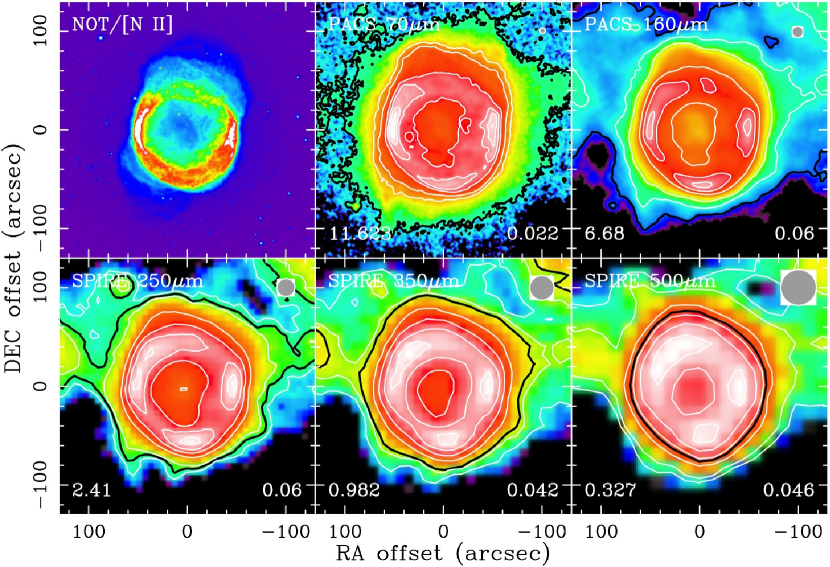
PACS/SPIRE broadband images of NGC 6781 are presented in Fig. 3, along with an optical image in the [N II] 6584 band taken at the Nordic Optical Telescope (NOT) for comparison (Phillips et al., 2011). These images reveal the far-IR structures of NGC 6781, which are comparable to those in the optical. The signature “ring” appearance of the near pole-on cylindrical barrel structure is clearly resolved in all five far-IR bands, even at 500 m.
The detected far-IR emission is dominated by thermal dust continuum: the degree of line contamination is determined to be at most 8–20% based on the HerPlaNS PACS/SPIRE spectroscopy data (see below). The strength of the surface brightness is indicated by the color scale and contours in Fig. 3 (the band-specific values are indicated at the bottom corners of each frame). The background root-mean-square (rms) noise (), determined using the off-source background sky regions, is measured to be between 0.023 and 0.18 mJy arcsec-2 (0.97 and 7.66 MJy sr-1, respectively) in these bands (the band-specific value is indicated at the bottom right in each frame). The black contour is drawn to mark the 3- detection level.
In the continuum maps, far-IR emission from NGC 6781 is detected from the region encompassing the entire optical ring structure. While the optical ring appears somewhat incomplete due to a relatively smaller surface brightness in the north side, the far-IR ring looks more complete with a smoother surface brightness distribution, especially in bands at longer wavelengths ( m). This difference is most likely due to extinction of the optical line emission emanating from the inner surface of the northern cylindrical barrel by the dusty column of the inclined barrel wall that lies in front of the optical emission regions along the line of sight. Our interpretation is consistent with the optical extinction map presented by Mavromatakis et al. (2001) (their Fig. 3). We show below that the dust column mass density is roughly constant all around the ring structure ( M⊙ pix-1 at the 2′′ pix-1 scale; Fig. 5).
The total extent of the far-IR emission (especially at 70 m) encompasses that of the deep exposure [N II] image (about 100′′ radius at five-; Fig. 2 of Mavromatakis et al. 2001): hence, we infer that the diffuse extended line emission is most likely caused by scattering of line emission emanating from the central ionized region by dust grains in the dusty extended part of the nebula. Given that the highly-ionized region is restricted within the ring structure (e.g., Mavromatakis et al. 2001), we can conclude that the total extent of the nebula (both in the optical and far-IR) is sensitivity limited. Adopting the constant expansion velocity of km s-1 as above, we confirm that the dynamical age of the observed far-IR nebula is at least (3–4) yr.
At 70 m, the distribution of thermal dust continuum is very similar to what is seen in the [N II] 6584 image (Phillips et al., 2011). This indicates that the lateral density gradient in the barrel wall along the equatorial plane is very steep101010Mavromatakis et al. (2001) reported about a offset along the E-W direction between the [N II] and [O III] profile peaks in the optical, which is barely resolvable at the Herschel bands. and that the temperature stratification along this direction occurs in a physically very restricted region, i.e., on scales smaller than Herschel’s far-IR spatial resolution. Hence, the surface brightness peaks on the eastern and western rims represent the pivot points of the inclined barrel about 20∘ tilted to the south with respect to the line of sight (Bachiller et al., 1993; Hiriart, 2005; Schwarz & Monteiro, 2006). By the same token, the southern rim of the ring represents the interior wall of the cylindrical barrel on the far side seen through the cavity, while the northern rim is the exterior wall of the barrel on the near side.
At longer wavelengths, the locations of the surface brightness peaks change: the surface brightness becomes brighter on the NW and SE sides of the ring structure. Similar surface brightness characteristics were seen in the radio emission map in the CO J=2–1 line (Bachiller et al., 1993). The overall appearance of the far-IR emission regions is more circular at longer wavelengths. This is partly due to spatial resolution, but is also due to the fact that the redder far-IR images in the SPIRE bands probe the colder part of the shell which gives about the same column density around the ring structure.
| Band | |||||
|---|---|---|---|---|---|
| (m) | (m) | (mJy arcsec-2) | (mJy arcsec-2) | (Jy) | |
| PACS Blue | 70 | 25 | 11.623 | 0.022 | |
| PACS Red | 160 | 85 | 6.68 | 0.06 | |
| SPIRE PSW | 250 | 76 | 2.41 | 0.06 | |
| SPIRE PMW | 350 | 103 | 0.982 | 0.042 | |
| SPIRE PLW | 500 | 200 | 0.327 | 0.046 |
The total fluxes of the target at the PACS/SPIRE wavebands () are computed by aperture photometry: we adopted the three- detection contour (the black contour in Fig. 3) of the 70 m map (of the best S/N among all) as the photometry aperture and summed up pixel values within the aperture in all five bands. Upon running the aperture photometry routine, we first subtracted background point sources using the IRAF daophot routine built into HIPE to make background-point-source-free maps. The uncertainty of the total flux is set to be the combined uncertainties of the sky scatter/variation () and the absolute flux calibration error (which is as high as 5% for PACS and 15% for SPIRE maps according to the Herschel PACS/SPIRE documentation). Color correction was applied using correction factors derived for the appropriate temperature of the SED based on the color correction tables provided in Table 3 of the PACS release note PICC-ME-TN-038 and Table 5.3 of the SPIRE Observing Manual v2.4. Table 4 summarizes photometric measurements for NGC 6781 made from the broadband images.
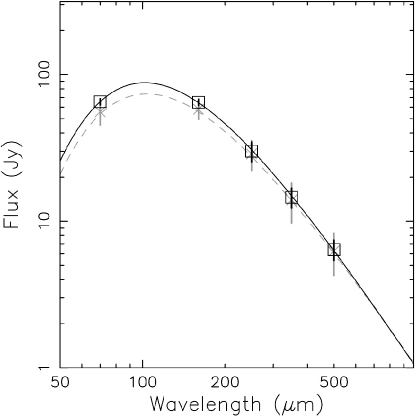
As seen from the photometry (Table 4), the present Herschel observations cover the Rayleigh-Jeans shoulder of the thermal dust emission component of the spectral energy distribution (SED) of NGC 6781. The dust temperature, , therefore, can be estimated by fitting the far-IR SED with a power-law dust emissivity, , where defines the emissivity characteristics of the far-IR emitting dust grains. Typically, the value of is roughly 2 for silicate dust grains and graphite grains and close to 1 for amorphous carbon grains (e.g., Bohren & Huffman 1983; Draine & Lee 1984; Rouleau & Martin 1991; Mennella et al. 1995 for theoretical/lab studies, and Knapp et al. 1993, 1994; Gledhill et al. 2002 for observational studies).
Using the integrated fluxes in Table 4, we obtain K and (Fig. 4). Note, however, that these broadband fluxes include some line emission. Thus, we assessed the amount of line contamination in the broadband fluxes using spectra taken by individual spaxels. While the amount of line emission is spatially variable, we found the level of line contamination to be 9–20% at 70 m and 8–16% at 160 m. As demonstrated by Fig. 4, the line contamination contributes negligibly to the uncertainties in fitting and . Therefore, we concluded that for dust-rich objects direct fitting of broadband fluxes with the modified blackbody yielded acceptable and other derivatives.
From spatially resolved PACS/SPIRE maps (Fig. 3), we can recover and maps at the spatial resolution of the 160 m map. First, we performed five-point fitting of the modified blackbody curve at the spatial resolution of the SPIRE 500 m map (FWHM of ). The derived map was fed back into the surface brightness ratio map to solve for the dust temperature at the spatial resolution of the 160 m map (FWHM of ) via the relation
| (1) |
Upon being fed into the above relation, the map was re-gridded at the pixel scale of the 160 m map ( pix-1) by 2-D linear interpolation. We consider this approximation reasonable and better than the brute-force five-point SED fitting at the pixel scale of the 70 m map, which involves a substantial amount of interpolation, because the range of is not large (between -0.5 and 2.5) and so there were no strong gradients over which values had to be spatially resampled.
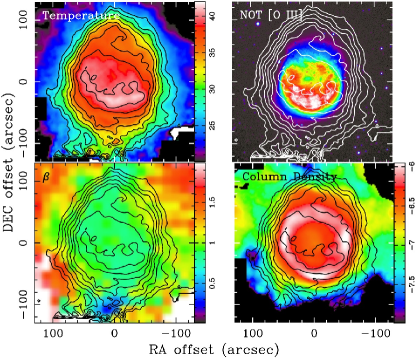
The derived and maps, along with the dust column density () map, are presented in Fig. 5, together with the [O III] 5007 map taken at the NOT for comparison (Phillips et al., 2011). As shown in the top frames of Fig. 5, the highest dust temperature region ( K within the dust ring of K) is spatially coincident with the region of highly-ionized optical line emission (e.g., [O III] 5007 and H; Mavromatakis et al. 2001; Phillips et al. 2011), delineating the interior walls of the barrel cavity directly visible to us through the polar opening. While the median uncertainties of and in fitting pixel-wise surface brightnesses are as large as those in fitting integrated fluxes ( for and K for ), these pixel-wise uncertainties are not completely independent because of the nature of dust heating (i.e., the radiative equilibrium is achieved in an optically-thin medium) and the differential spatial resolution over one decade of wavelengths. Hence, the and distributions are as continuous as the dust distribution.
Therefore, we conclude that the five-point SED fitting of dust temperature was successful and that the gradient of dust temperature within the dust ring is real. The value of is close to unity around the central ionized region (Fig. 5, bottom-left), suggesting that the major component of the far-IR emitting dust is likely carbon-based (Volk & Kwok, 1988). This is consistent with previous chemical abundance analyses performed with optical line measurements (Liu et al., 2004b; Milanova & Kholtygin, 2009) as well as with the absence of silicate dust features in mid-IR spectra taken by the Spitzer IRS (e.g., Phillips et al. 2011).
The map can be derived from the observed surface brightness maps and the derived map via
| (2) |
where is the distance to the object and is the opacity of the dust grains. Based on the 160 m map and adopting the dust opacity of cm2 g-1 at 160 m121212We computed the dust opacity following the Mie formulation with the optical constants of amorphous carbon grains determined by Rouleau & Martin (1991), assuming spherical grains having the size distribution of the “MRN” type (Mathis, Rumpl, & Nordsieck, 1977), from 0.01–1 m., the map yields up to M⊙ per pixel (Fig. 5, bottom right). As mentioned above, the map delineates the relatively uniform distribution of dust grains in the cylindrical barrel. Because the far-IR thermal dust continuum is optically thin all around the ring structure (– on the ring), the dust column mass density map probes the whole depth of the inclined nebula along the line of sight, corroborating the pole-on cylindrical barrel structure that was previously only inferred from optical images. By integrating over the entire nebula, we determined that the total amount of far-IR emitting dust is M⊙, of which roughly 50% appears to be contained in the cylindrical barrel (defined to be the region where is more than 40% of the peak).
Fig. 5 shows that there is still a substantial amount of dust column along lines of sight toward the inner cavity of the barrel, even though this region is expected to be filled with highly-ionized gas as seen from emission maps in high-excitation optical lines such as He II4846 and [O III] 5007 (Mavromatakis et al., 2001), and in mid-IR lines such as [O IV] 25.8 m and He II 24.3/25.2 m (which dominate most of the emission detected in the archived WISE 24 m map of the object). Moreover, the relatively high dust continuum emission detected toward the inner cavity in the SPIRE range (both in images and spectra; see below) suggests the presence of colder material toward this direction, as has been implied by the previous detection of H2 emission in v=0–0 S(2) to S(7) transitions in the bipolar lobes (Phillips et al., 2011). These pieces of evidence indicate that there are distributions of cold dust (and gas) in front of and behind the highly-ionized central cavity along the inclined polar axis (i.e., polar caps).
While a high degree of symmetry is exhibited by the map by the cylindrical barrel structure, a highly lopsided structure – warmer dust grains are concentrated along the surface of the S side of the barrel wall – is presented by the map (Fig. 2, bottom right and top left, respectively). Given that the dusty cylindrical barrel is optically thin in the far-IR, the distribution is not caused by the inclination of the cylindrical barrel (i.e., the inner surface of the S side of the barrel is directly seen from us, while the inner surface of the N side is obscured from our direct view by the barrel wall itself). Hence, we conclude that the barrel is not completely symmetric and its S side is somewhat closer than the N side (both the gas and dust components; Fig. 5, top frames).
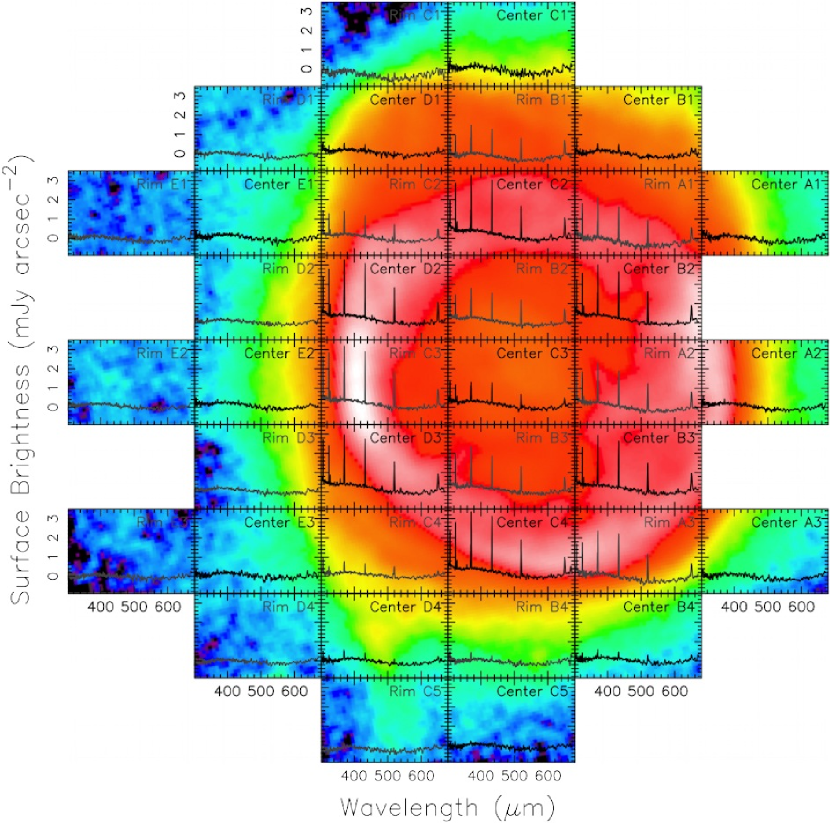
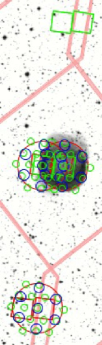
3.2 Spatio-Spectroscopy
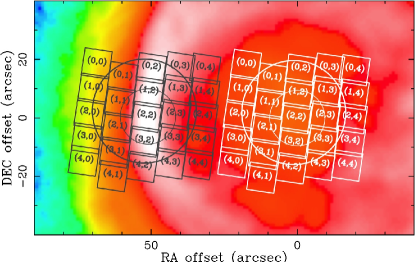
To investigate the spatial variations of the spectral characteristics in NGC 6781, we extracted individual spectra from each of the PACS spaxels and SPIRE bolometers at two distinct pointings within the target nebula. While the center pointing was directed toward the middle of the cavity of the ring structure, the rim pointing was aimed at the continuum surface brightness peak in the eastern rim of the ring structure. Fig. 6 displays the complete two-pointing footprints of the PACS spaxels and SPIRE bolometers with respect to the structures of NGC 6781 seen at 70 m (see also Fig. 2). With these pointings, we obtained 50, 70, and 38 separate PACS, SPIRE/SSW, and SPIRE/SLW spectra, respectively, each probing a specific line of sight in each band. In the HerPlaNS data set, the spectroscopic flux units are set to be those of surface brightness (mJy arcsec-2 per wavelength bin, whose size is optimized roughly to 0.013 m for PACS and 0.037–0.45 m for SPIRE). The flux density in Jy for an emitting region can be obtained by integrating the surface brightness within the area of that region.131313To compute practically the flux for extended sources, the spectroscopic surface brightness at each wavelength bin must be multiplied by the apparent area of the aperture or the region of interest (cf. the spaxel/bolometer aperture size varies with wavelength from – side for PACS, from 17–21′′ diameter for SPIRE/SSW, and from 29–42′′ diameter for SPIRE/SLW).
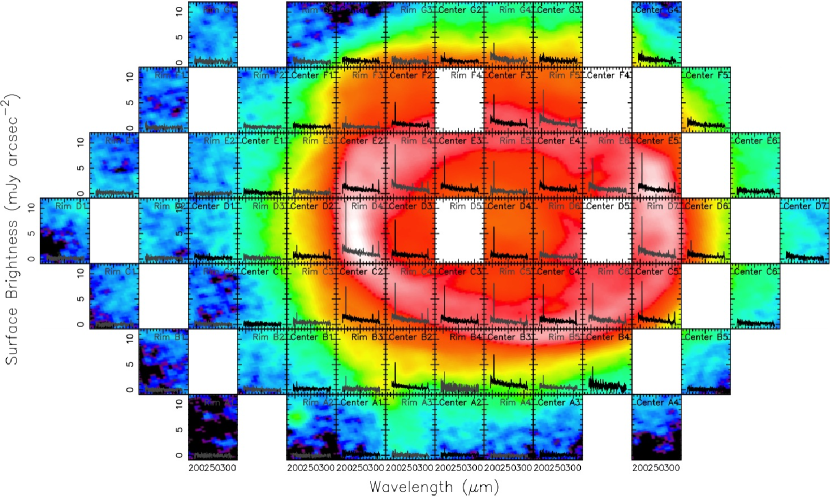
Far-IR spectra of NGC 6781 for the complete PACS/SPIRE spectral range (51–672 m) at each of the two pointings are presented in Fig. 7: the black (gray) spectrum is taken at the center (rim) pointing. These spectra are constructed by combining a PACS spectrum from the central (2,2) spaxel and SPIRE SSW/SLW spectra from the central C3/D4 bolometers, respectively (see Fig. 6 for their spatial relationship). For the present analysis, we did not take into account the difference in the actual area of the sky subtended by the central PACS spaxel and SPIRE bolometers as well as the beam dilution effect). The peak (median) sensitivities in the PACS B2A/B2B and R1 bands and in the SPIRE SSW and SLW bands are 0.56 (3.74) mJy arcsec-2, 0.24 (1.53) mJy arcsec-2, 0.004 (0.101) mJy arcsec-2, and 0.001 (0.023) mJy arcsec-2, respectively.
In Table 5, flux measurements for the presently confirmed lines are summarized. Note that these measurements are based on the total PACS spectrum (i.e., all 25 spaxels integrated) and SPIRE spectra from the central D4/C3 bolometers. In general, the measured fluxes appear to be consistent with those obtained with ISO LWS (Liu et al., 2001), given the different aperture size of ISO LWS (about radius). However, calibration of the [O III] 51.8 m line flux at the PACS B2A band edge may be uncertain due to known spectral leakage (see Sect. 3.3.2).
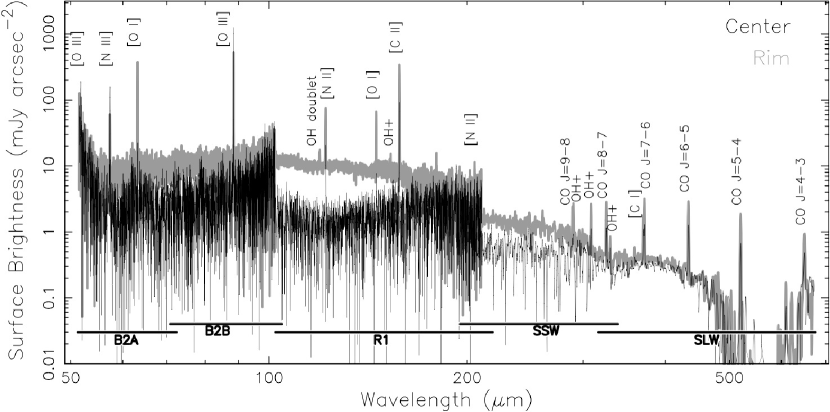
At both pointings, we detected continuum emission ranging from a few to 10 mJy arcsec-2 in the PACS bands (m) and from a few tenths to a few mJy arcsec-2 in the SPIRE bands (m). Thermal dust emission in the PACS bands and the SPIRE SSW band is stronger at the eastern rim than at the nebula center, while it is about the same at both pointings in the SPIRE SLW band. This indicates that (1) dust grains having temperatures less than about 10 K (corresponding to those emitting at m) are distributed uniformly in the nebula, and (2) dust grains having temperatures more than about 10 K (corresponding to those emitting at m) are more abundant along the columns toward the rim. Hence, the dust component emitting at 300 m probably represents the part of the nebula surrounding the central highly-ionized regions, corroborating the presence of the polar caps as suggested by the analysis of the broadband images. The equation of thermal balance between radiation and the cold dust component in the polar caps under the dust emissivity assumption suggests that dust grains of 10 K would be located at 50′′ away from the star at 950 pc. As the radius of the dust barrel is about 40′′, this simple calculation suggests that the inner cavity of NGC 6781 is slightly elongated along the polar axis.
| Line | Flux (10-16 W/m2) | ||
|---|---|---|---|
| (m) | Center | Rim | |
| [O III] | 51.8 | 24810 | 11213 |
| [N III] | 57.3 | 2372 | 1031 |
| [O I] | 63.2 | 48.70.9 | 1041 |
| [O III] | 88.4 | 5731 | 2521 |
| OH | 119.2 | 0.910.16 | 1.640.17 |
| OH | 119.4 | 0.990.18 | 1.840.18 |
| [N II] | 121.9 | 15.60.3 | 18.80.4 |
| [O I] | 145.6 | 4.120.15 | 9.500.17 |
| OH+ | 153.0 | 0.490.12 | 0.790.14 |
| [C II] | 157.8 | 36.80.17 | 48.10.1 |
| [N II] | 205.2 | 1.080.05 | 1.840.06 |
| CO J=9–8 | 289.1 | 0.250.12 | 0.710.11 |
| OH+ | 290.2 | 0.260.12 | 0.720.11 |
| OH+ | 308.4 | 0.470.04 | 0.430.01 |
| CO J=8–7 | 325.3 | 0.400.04 | 0.460.02 |
| OH+ | 329.7 | 0.100.05 | 0.050.04 |
| [C I] | 370.3 | 0.860.03 | 0.670.02 |
| CO J=7–6 | 371.6 | 0.860.03 | 0.900.01 |
| CO J=6–5 | 433.5 | 0.530.03 | 0.510.01 |
| CO J=5–4 | 520.3 | 0.300.03 | 0.380.13 |
| CO J=4–3 | 650.3 | 0.160.03 | 0.170.01 |
Besides the continuum, detected are a number of ionic and atomic emission lines such as [O III] 52, 88 m, [N III] 57 m, [O I] 63, 146 m, [N II] 122, 205 m, and [C II] 158 m in the PACS bands and a number of CO rotational lines in the SPIRE bands. In the center pointing spectra, high-excitation ionic lines are stronger whereas low-excitation ionic, atomic, and molecular lines are weaker. In the rim spectra, however, we observe the opposite. The different relative strengths of these lines at the two positions suggest that the central cavity is more strongly ionized than the eastern rim, as expected.
While thorough line identification and analysis will be deferred to forthcoming spectroscopy papers in the series, we point out here that a fair number of weaker lines are also detected in addition to the lines mentioned above, such as those thought to be the OH 119 m J=5/2+–3/2- -doublet transitions at 119.2 and 119.4 m (Melnick et al., 1987), OH+ lines at 153.0, 290.2, 308.4, and 329.7 m, and [C I] at 370.4 m. Line flux measurements made for these lines are summarized in Table 5. Among these weaker lines, detection of OH+ in emission is particularly rare. In fact, the detection of OH+ in emission was made in two other PNs of the HerPlaNS sample, and is the subject of a stand-alone HerPlaNS paper (Aleman et al., 2013). In addition, the detection of OH+ in emission was also made in two other PNs independently by Etxaluze et al. (2013) as part of the Herschel MESS (Mass Loss of Evolved Stars) key program (Groenewegen et al., 2011). As we have already demonstrated, these emission lines contribute negligibly to broadband flux measurements, and hence, to the SED fitting analysis of the dust temperature.
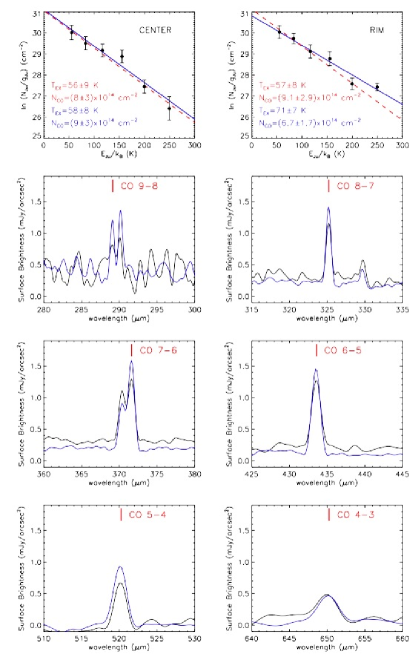
Using measured fluxes of CO lines from J=9–8 to 4–3 transitions detected above the 2- signal-to-noise limit (and ignoring the effects of beam dilution, which has not been fully calibrated in HIPE), we calculated the CO excitation temperature, , and column density, , by least-squares fitting, following the formalism of Goldsmith & Langer (1999) under the optically thin assumption. Bachiller et al. (1993) reported a 12CO column density of cm-2 towards NGC 6781 based on 12CO J=2–1 and 1–0 maps. Assuming this column density for the upper levels of the transitions that we detected the optical depth in each line would still be much less than unity (Goldsmith & Langer, 1999). Hence, our assumption of optically thin CO emission is reasonable.
Fig. 8 shows the CO excitation diagrams for the center (top left) and rim (top right) pointings, as well as individual CO spectra from J=9–8 to 4–3 (the rest of the frames, from top left to bottom right). These calculations yielded K and cm-2 for the center pointing and K and cm-2 for the rim pointing (blue lines in the top frames of Fig. 8). Neglecting two lines at J=9–8 (marginal detection at -) and J=7–6 (blending with the [C I] line at 370.3 m), fitting instead resulted in K and cm-2 for the center pointing and K and cm-2 for the rim pointing (dashed red lines in the top two frames in Fig. 8). In this excitation diagram fitting, the uncertainties are obtained by standard error propagation from the uncertainties of the line intensity measurements. The values of E(Ju) and Einstein coefficients are taken from the HITRAN database.151515http://www.cfa.harvard.edu/hitran/, version 2012.
The present measurements from higher-J transitions suggest that the bulk of CO gas remains at low temperature and preferentially detected at the lowest-J transitions. However, the spatial distribution of the CO gas component is very much restricted to where we see thermal dust continuum emission, indicating that most of the CO gas is contained within the cylindrical barrel structure most likely temperature-stratified in the polar directions.


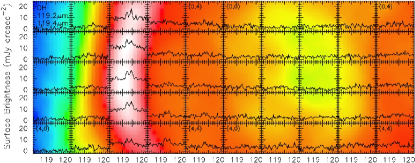
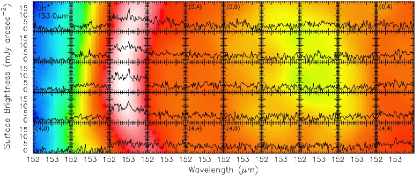
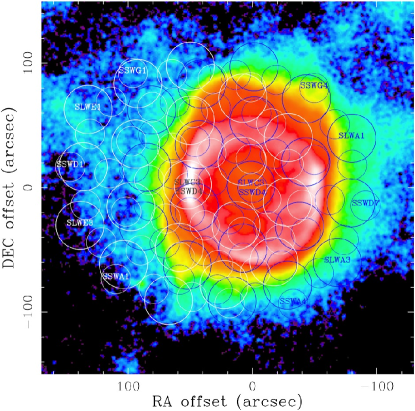
Spatial variations of the line strength can be investigated by comparing individual spectra taken from each PACS spaxel and SPIRE bolometer. For example, Fig. 9 displays 16 spectra covering the whole SPIRE range (194–672 m) that are recovered from locations within the nebula at which the SPIRE SSW and SLW bolometers overlap (Fig. 6). These spectra, presented with the 70 m image in the background, indicate that both thermal dust continuum and CO line emission are more prominent along the barrel wall, hinting at generally colder and denser conditions within the barrel wall.
Meanwhile, Fig. 10 shows spatial variations of the excitation conditions within the nebula. The [N III] line strength distribution (Fig. 10, top) reveals uniformly high excitation conditions in the central cavity, which gradually decreases as the column density increases toward the rim over three spaxels (). The opposite trend is seen in the lower-excitation [N II] line strength distribution (Fig. 10, second from top). On the other hand, the molecular OH and OH+ lines (Fig. 10, bottom two) appear exclusively in the barrel wall, suggesting that the presence of molecular gas is spatially very much restricted. The line strength distribution maps for other lines can be found in the Appendix (Figs. 15, 16, 17, and 18).
3.3 Spectral Mapping
3.3.1 Spatially-Resolved Far-IR Emission Line Maps
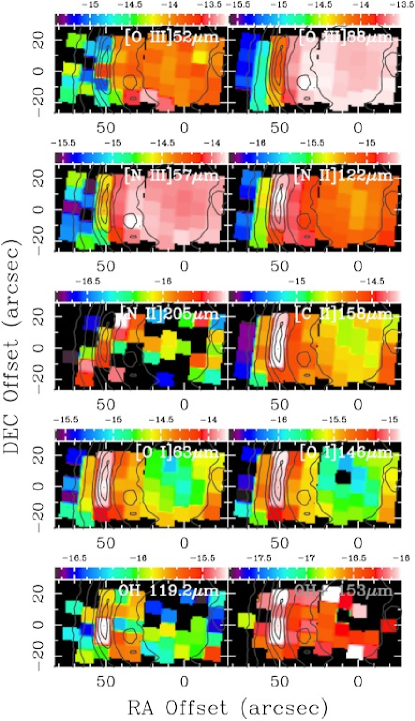
The PACS line strength distribution maps introduced in the previous section (Fig. 10, as well as Figs. 15 and 16) are not spatially accurate, as spaxels are not exactly aligned on a square grid due to internal misalignment. Therefore, the PACS IFU data cube was rendered into spectral maps by taking into account the internal offsets among spaxels. In the case of NGC 6781, the fields of view of two pointings are adjacent to each other, and hence, cover roughly two-thirds of the radius of the nebula along the equatorial plane. Fig. 11 shows such mosaicked line emission distribution maps of the central region in [O III] 52, 88 m, [N III] 57 m, [N II] 122, 205 m, [C II] 158 m, [O I] 63, 146 m, OH doublet at 119.2, 119.4 m, and OH+ at 153 m, respectively, from top left to bottom right.
These line maps of NGC 6781 intuitively show that the distribution of line emission is fairly uniform within the barrel cavity and tends to vary over a roughly 30′′-wide region across the barrel wall. The high-excitation line maps at [O III] 52, 88 m and [N III] 57 m show stronger emission from within the barrel cavity, with the strongest emission tending toward the inner wall of the cavity, about 40′′ to the east from the nebula center. On the other hand, the low-excitation and atomic line maps at [N II] 122, 205 m, [C II] 158 m, and [O I] 63, 146 m exhibit concentrations of surface brightness along the barrel wall, about 50′′ to the east from the center.
Hence, the barrel wall region is where the gradient of the line emission strengths tends to become large. The spatial coincidence of various emission lines of ionic, neutral, and molecular nature revealed here shows that (1) the temperature gradient is fairly steep across the inner barrel wall, and (2) the barrel wall is stratified with physically distinct layers. The line maps in Fig. 11 also indicate that the line ratios for a given ionic or atomic species (such as [O III] 52 m/88 m and [O I] 63 m/146 m) vary significantly within the nebula. Therefore, we stress that single-valued line ratios obtained by treating PNs as point sources are inadequate for purposes of line diagnostic investigations to understand their structures.
Based on the present data augmented with the previous results in the literature, we propose the following picture of stratification across the nebula volume of NGC 6781. The inner cavity is highly ionized and the surface of the barrel wall is mostly ionized, while the wall itself is dense enough to maintain a large amount of column of molecular species. Between the dense molecular/neutral barrel wall and the ionized cavity, there should be a layer of photo-dissociation region (PDR) shielding the barrel from the UV field of the central star. There is also another PDR layer on the outer surface of the barrel wall, which shields the barrel against the UV field of the interstellar radiation field. These PDRs are likely the origins of various neutral and molecular lines detected in the far-IR and elsewhere. Dense PDR clumps embedded in an otherwise ionized gas in the central cavity could also provide sites for production of various emission lines as in NGC 7293 (e.g., Speck et al. 2002) and NGC 650 (e.g., van Hoof et al. 2013). This complex cylindrical barrel region (up to about 50′′ radius from the star) is surrounded by a region of cold dust extending to roughly 100′′ radius (Fig. 3).
3.3.2 Electron Temperature/Density Diagnostics of the H II/Ionized Regions
| Positiona𝑎aa𝑎aPosition along the RA direction defined by integer multiples of from the nebula center, at which the surface line strength is summed over the 5-spaxel column along the DEC direction (also indicated at the top of Fig. 12). | RAb𝑏bb𝑏bRelative angular distance in the RA direction from the center spaxel of the center pointing. | [O III] | [O I] | [N II] | [O III] | [N II] |
| (arcsec) | (cm-3) | (cm-3) | (cm-3) | (K) | (K) | |
| Cen5 | -20 | 53080 | 1,520400 | 37090 | 9,67010 | 8,30080 |
| Cen4 | -10 | 32030 | 820420 | 22040 | 9,69020 | 7,99070 |
| Cen3 | 0 | 35040 | 8010 | 9,80010 | 7,92060 | |
| Cen2 | 10 | 41070 | … | 10520 | 9,73010 | 8,24060 |
| Cen1 | 20 | 35040 | 1,920670 | 22050 | 9,78010 | 8,25070 |
| Rim5 | 30 | 40060 | 650270 | 960430 | 9,92010 | 8,73050 |
| Rim4 | 40 | 27040 | 30080 | 10,00010 | 9,41040 | |
| Rim3 | 50 | 22080 | 1,27080 | 640210 | 10,94030 | 11,58060 |
| Rim2 | 60 | … | … | 450130 | 7,40060 | 6,25050 |
| Rim1 | 70 | … | … | 5,700100 | 4,780240 |
Far-IR fine-structure line ratios such as [O III] 52/88 m and [N II] 122/205 m are relatively insensitive to the electron temperature (), because the fine-structure levels of the 3P ground state are close enough in energy: one can derive the electron density () from a range of (e.g., Rubin et al. 1994; Liu et al. 2001). Meanwhile, can be inferred from, for example, optical-to-far-IR line ratios such as [O III] 5007/88 m and [N II] 6583/122 m, which are relatively insensitive to (i.e., one can derive from a range of ). By iterative application of the above processes, one can derive the optimum (, ) pair for a given set of line ratios without any prior assumption.
Now that we obtained spatially-resolved far-IR line maps, we can observationally establish the (, ) distributions from the central region to the eastern barrel wall of NGC 6781 as a function of position. Because the orientation of the PACS IFU field of view happened to be almost aligned with the (RA, DEC) coordinates (Fig. 11), we collapsed these line maps along the DEC direction to yield a 1-D surface line strength profile as a function of position in the RA direction. For the present analysis, we resampled the line maps back at the nominal spaxel size to verify internal consistencies of the line map generation procedure with individual spaxel measurements.
Using the IRAF/STSDAS nebular package171717In this analysis package, the equation of statistical equilibrium is solved for the lowest five excitation levels of a given atom Shaw & Dufour (1995). Upon using the package, we updated the atomic data following the reference list summarized by Otsuka et al. (2010; their Table 7). we first derived the radial profile from the [O III] 5007/88 m ratio profile with an assumed flat profile. Then, the radial profile was recovered from the [O III] 52/88 m ratio profile using the derived profile. These two steps were repeated until the (, ) radial profile pair converged. Unfortunately, the [O III] 52 m line flux calibration was compromised by spectral leakage between adjacent grating orders. Therefore, assuming that the relative surface line strength within the [O III] 52 m map was unaffected by the leakage, we scaled the [O III] 52 m map by a factor of 3.2 so that the [O III] 52/88 m ratio averaged over the entire RA profile equals 1.45, which is the ratio computed from the respective line strength measurements () made by Liu et al. (2001) in their previous spatially unresolved study with ISO.
We also used the [N II] 6583/122 m and [N II] 122/205 m ratio profiles in the same iterative process to derive the optimum () radial profiles for lower density regions (e.g., Rubin et al. 1994). Unfortunately, the strength of the [N II] emission at 205 m was close to the PACS R1 band detection limit, and hence, many spaxels in the [N II] 205 m map did not yield valid measurements. In fact, the integrated [N II] 205 m line strengths measured from the PACS and SPIRE spectra differed by more than a factor of two (after considering the difference in the respective aperture sizes). Thus, we adopted the more reliable SPIRE measurements and scaled the PACS [N II] 205 m line map so that the integrated line strength of the map equals with the measured SPIRE line strength. In our analyses outlined above, the [O III] 5007 and [N II] 6583 maps in the optical were augmented from the study by Phillips et al. (2011) using data obtained at the NOT.
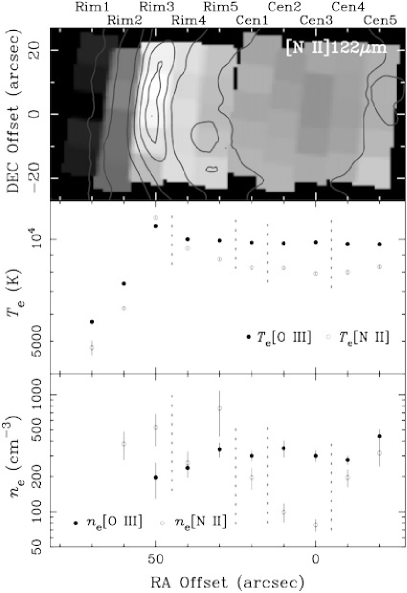
Thus, the above nebular diagnostics of the line ratio profiles across the eastern radius of NGC 6781 yielded the (, ) radial profiles, which are summarized in Table 6 and plotted in the left frames of Fig. 12. The radial profiles derived from the [O III] and [N II] line profiles are consistent with each other, revealing a highly-ionized region of almost constant (from 8,100–9,700 K) in the barrel cavity, surrounded by the barrel wall at which reaches the maximum ( K; Mavromatakis et al. 2001) and beyond which tapers off (middle frame of Fig. 12). The radial profile derived from the [O III] line profile (pluses) shows a generally constant distribution ( cm-3; cf. Mavromatakis et al. 2001), while that derived from the [N II] profile (crosses) hints at a radially increasing tendency (from 80 cm-3 at the center of the cavity to cm-3 around the barrel wall; bottom frame of Fig. 12).
Such a radially increasing trending of is expected from the line strength surface brightness map in the [N II] line (top left frame of Fig. 12). The lower [N II] is probably affected by the presence of the high excitation region in the very center of the cavity (seen in the He II4686, from which [C IV], [N IV], and [O IV] lines, which were neglected in the present analysis, probably arise). Because various diagnostic lines probe a range of excitations, determined from various indicator lines will vary depending on which indicator line is used (Rubin et al., 1994). Here, we have demonstrated this indicator-line-dependent nature of line diagnostics for the first time in the far-IR by radially resolving the ionization structure.
In previous far-IR line diagnostics performed by Liu et al. (2001), [O III] was found to be 371.5 cm-3 under the assumption of a constant at K. A follow-up study with optical data in [O III], [N II], and [O II] later verified that is between 10,200 and 10,600 K (Liu et al., 2004a). Indeed, our iterative, more self-consistent method confirmed that [O III] in the central cavity (i.e., the average of the mid-sections, Cen2, 3, and 4; Table 6) is roughly 360 cm-3, in which [O III] is about K. In the previous single-beam observations, these numbers were considered representative of the entire nebula.
However, we emphasize here that these values are representative of just the inner cavity and that details such as the peak around the barrel wall and the structured [N II] profile across the nebula would not have been discovered without spatially-resolved far-IR data. Hence, it is imperative that spatially-resolved line diagnostics are performed in future to diagnose the spatially-resolved PN energetics not only in the far-IR but also in other wavelengths at which relevant diagnostic lines exist to take full advantage of the maximum spatial resolving power possible.
3.3.3 Physical Conditions of the PDR
The low-excitation and atomic line maps at [C II] 158 m and [O I] 63, 146 m are typically used to probe the physical conditions of the PDR (Tielens, 2010). On one hand, the [O I] lines at 63 and 146 m are expected to arise exclusively from the PDR, because the ionization potential of O0 is 13.6 eV and no O0 is expected in the H II regions (H IIRs). On the other hand, the [C II] line at 158 m can arise from both the H IIRs and PDRs, because the ionization potential of C0 is 11.3 eV and C+ can exist in both H IIRs and PDRs (Malhotra et al., 2001). Therefore, there is a need to separate the H IIR and PDR components of the [C II] 158 m line strength distribution.
The intensity of the [C II] 158 m line emission arising from H IIRs along a particular line of sight should roughly scale with that of the [N II] 122 m line emission along the same line of sight. Moreover, whenever the [N II] 122 m emission is detected, the observed intensity of the [C II] 158 m emission along the same line of sight have to be the sum of contributions arising from the PDRs and H IIRs along the line of sight. This occurs simply because the ionization potential of N0, 14.5 eV, is close to but larger than that of C0, 11.3 eV.
Hence, assuming that the nebula gas is well-mixed along the line of sight, we can express the relationship between strengths of the [C II] 158 m and [N II] 122 m lines as for each spaxel, where and are the integrated strengths of the corresponding lines per spaxel, with the superscripts for the line indicating the origins of the emission. If we further assume that the H IIR component of the [C II] 158 m line emission dominates, the scaling factor can be determined by a linear fitting of the measured line strengths of the [C II] 158 m and [N II] 122 m lines. The validity of the last assumption is corroborated by excellent spatial correspondence between the [N II] 122 m and [C II] 158 m line strength distribution maps (Fig. 11, the second and third frames from the top in the right column, respectively).
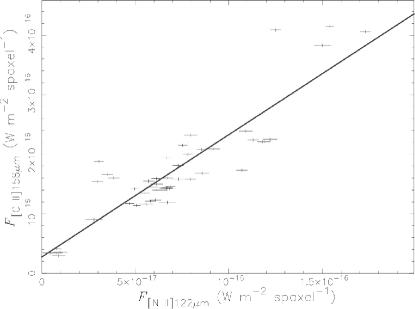
Fig. 13 shows the relationship between the integrated line strengths of the [C II] 158 m emission against those of the [N II] 122 m emission at each spaxel for both the center and rim pointings. The best-fit to the observed linear correlation is determined to be W m-2. As W m-2, we confirm that the H IIR component of the [C II] 158 m line emission indeed dominates (which is expected because the observed regions mostly cover the highly ionized inner cavity, also revealed by our analysis; Fig. 12, Table 6). By this way, we estimated the surface brightness distributions of [C II] 158 m emission arising exclusively from the H IIR by the relation, , and of [C II] 158 m arising exclusively from the PDR by the difference, .
As in the above analysis with the surface brightness maps of lines arising exclusively from the H IIR of the nebula, we can probe the (, ) profiles in the PDR of the nebula using line maps arising exclusively from the PDRs. Using the [O I] 63/146 m ratio profile and the profile, we can derive the profile for the PDR of the nebula. Unfortunately, however, there is no suitable optical surface brightness map in a neutral O line (e.g., an [O I] 6300 map) to be paired with a far-IR line map in order to derive the profile for further iteration. Hence, we simply adopted the [N II] profile for the following analysis of the PDR of the nebula. The resulting profile (Table 6) is very irregular, and even lacks a measured value at 10′′ E of the center. As one immediately sees from the individual spectra (Figs. 15 and 16), the [O I] line emission arises almost exclusively from the column density peak of the barrel wall (i.e., middle of the rim pointing). Therefore, we adopted the value cm-3 at the barrel wall in the discussion below.
Following the PDR temperature-density diagnostic scheme elucidated by Liu et al. (2001), the (, ) pair at the PDR part of the barrel wall can be estimated. According to the PDR temperature-density diagnostic diagram prepared by Vamvatira-Nakou et al. (2013) (their Fig. 10), the line strength ratios of [O I] 63 m to 146 m () and of [O I] 63 m to the PDR part of [C II] 158 m () would suggest K and cm-3. We consider these values tentative, however, as the ratios obtained from the present data are slightly beyond the edge of the parameter space explored by Vamvatira-Nakou et al. (2013). Hence, further analysis is deferred to the forthcoming spectroscopic analysis papers of the HerPlaNS series, in which a [C I] 370 m map is derived from SPIRE spectra and a custom PDR diagnostic diagram is constructed for a wider range of parameters.
3.3.4 Spatially-Resolved Abundance Analysis
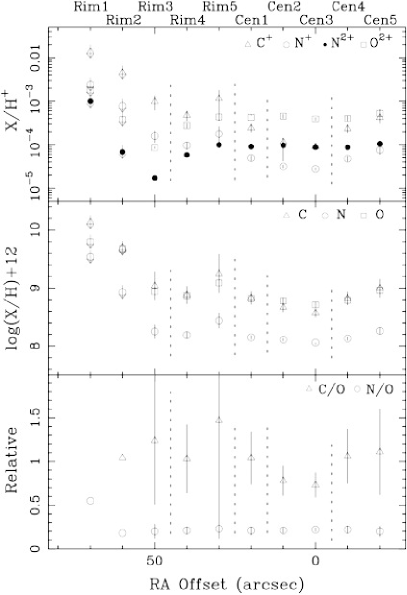
| Positiona𝑎aa𝑎aAs designated in Fig. 12 | RAb𝑏bb𝑏bRelative angular distance in the RA direction from the center spaxel of the center pointing. | C+/H+ | N+/H+ | N2+/H+ | O2+/H+ | C/O | N/O | C | N | O |
|---|---|---|---|---|---|---|---|---|---|---|
| (′′) | (x10-4) | (x10-5) | (x10-5) | (x10-4) | ||||||
| Cen5 | -20 | 4.21.1 | 7.61.5 | 10.51.3 | 5.31.1 | 1.10.5 | 0.20.1 | 9.00.2 | 8.30.1 | 9.00.1 |
| Cen4 | -10 | 2.30.5 | 4.80.6 | 8.70.6 | 4.00.5 | 1.10.3 | 0.20.1 | 8.80.1 | 8.10.1 | 8.80.1 |
| Cen3 | 0 | 0.90.1 | 2.80.2 | 8.80.3 | 3.90.3 | 0.70.1 | 0.20.1 | 8.50.1 | 8.10.1 | 8.70.1 |
| Cen2 | 10 | 1.20.2 | 3.20.2 | 9.60.4 | 4.50.4 | 0.80.2 | 0.20.1 | 8.70.1 | 8.10.1 | 8.80.1 |
| Cen1 | 20 | 2.40.5 | 5.00.6 | 9.00.6 | 4.20.5 | 1.00.3 | 0.20.1 | 8.80.1 | 8.20.1 | 8.80.1 |
| Rim5 | 30 | 11.56.2 | 17.88.2 | 9.91.1 | 4.30.8 | 1.51.3 | 0.20.1 | 9.30.3 | 8.40.1 | 9.10.2 |
| Rim4 | 40 | 4.71.2 | 9.71.8 | 5.80.4 | 2.80.3 | 1.00.4 | 0.20.1 | 8.90.2 | 8.20.1 | 8.90.1 |
| Rim3 | 50 | 9.83.4 | 15.94.7 | 1.70.1 | 0.90.1 | 1.20.8 | 0.20.1 | 9.00.2 | 8.30.1 | 8.90.1 |
| Rim2 | 60 | 46. | 78. | 6.8 | 3.8 | 1.0 | 0.2 | 9.7 | 8.9 | 9.7 |
| Rim1 | 70 | 140. | 240. | 100. | 18. | 2.2 | 0.6 | 10. | 9.5 | 9.8 |
Using the IRAF/STSDAS nebular package, we translated the (, ) profiles of the H IIR component of the object into spatially-resolved ionic abundance profiles of C+, N+, N2+/H+, and O2+ relative to H+, abundance ratio profiles of C/O and N/O, and elemental abundance profiles of C, N, and O relative to H (Fig. 12, right frames; Table 7).
To do so, the number density of N relative to H was estimated via
| (3) |
where the ’s are the integrated line strengths per spaxel of the corresponding lines in W m-2 and ’s are the volume emissivities for the corresponding lines. These ’s were computed based on the (, ) values determined for each spaxel: Te[N II] and ne[N II] were adopted to represent physical conditions of the low-excitation regions, while Te[O III] and ne[O III] were adopted to represent physical conditions of the high-excitation regions. For this formulation to work, it was assumed that there existed at most N2+ in the H IIR of the nebula close to the barrel wall.
In formulating the above N/H equation, we initially assumed that there were only insignificant number of and higher charge magnitude ions. However, the archived ISO SWS spectrum of NGC 6781 shows the [O IV] 25.9 m line with the peak flux of 64 Jy. The ionization potential of O2+ is 54.9 eV, which is higher than that of N2+, 47.4 eV. Hence, N3+ ions are expected to be present in the nebula. However, the ISO SWS aperture () is much smaller than the extended structure of NGC 6781, and there is no way for us to know the spatial distribution of the [O IV] and [N IV] emission. According to the He II4686 map (the ionization potential of He+ is 54.4 eV) presented by Mavromatakis et al. (2001), there appears to be a region of higher excitation well within the inner cavity of the cylindrical barrel. Therefore, we assumed further that (and for that matter) would be restricted to this central high excitation region and would not significantly affect the subsequent line diagnostic analysis for the bulk of the nebula beyond this centrally restricted region.
Thus, ionic abundance profiles, N2+/H+ and NH+ (Fig. 12, top-right; Table 7), were determined based on the [N III] and [N II] line strengths relative to the line strength. For the present analysis, the H map was synthesized by scaling the H map of Phillips et al. (2011) with the extinction-corrected H/H line ratio. We computed the H/H line ratio ourselves from the archival optical spectrum of the object taken with the William Herschel Telescope Intermediate dispersion Spectrograph and Imaging System, which was originally presented partially by Liu et al. (2004a). Finally, the elemental abundance profile, N/H, was obtained by combining N2+/H+ and NH+ as formulated above in units of , for which the H abundance is set to (Fig. 12, middle-right; Table 7).
As the ionization potentials of N+ and O+ are similar (29.60 and 35.1 eV, respectively) and that of O0 is 13.6 eV (i.e., no O+ remained in the H IIR of the nebula), the number density of N relative to O in the H IIR of the nebula was determined from
| (4) |
(Fig. 12, bottom-right; Table 7), and this ratio allowed us to obtain the O2+ ionic abundance profile. Similarly, the number density of C relative to N in the H IIR of the nebula was computed from
| (5) |
which followed from
| (6) |
Here, we assumed the second term of the last relation would hold because the ionization potentials of N+ and C+ are similar (29.6 and 24.4 eV, respectively) and the relative ionic abundances are similar for both N and C.
3.3.5 Physical Stratification across the Nebula Volume
The resulting ionic abundance profiles (Fig. 12, top right; Table 7) revealed the physical stratification of the nebula across the cylindrical cavity and barrel wall along the plane of the sky. Based on the relative ionic abundances obtained from the analysis, aided by the literature data of various optical line emission (e.g., Mavromatakis et al. 2001), the nebula structure was split into four stratified zones: (1) the very highly-ionized centrally-restricted region close to the center of the cavity, in which N2+, C2+, and O2+ are ionized (47.4, 47.9, and 54.9 eV, respectively), corresponding to where He II emission is detected (),191919Mavromatakis et al. (2001) states that the He II emission region is radius; however this appears to have been confused with diameter given the relative sizes of various emission regions (their Fig. 1). (2) the highly-ionized cavity roughly between and , in which the bulk of photons carry enough energy to ionize N+ and O+ (29.6 and 35.1 eV, respectively), corresponding to where [O III] emission is seen, (3) the inner surface of the barrel wall roughly between and at which photons still energetic enough to ionize N0 and C+(14.5 and 24.4 eV, respectively) impinge on the rising density gradient of the cylindrical barrel wall, corresponding to the [N II] emission region, and (4) the barrel wall density peak and beyond about , where only less energetic photons are left to produce O0 (13.6 eV), corresponding to where H emission is found.
It is worth emphasizing that these ionic abundance transitions take place at two radial locations in the cavity within the barrel wall at around and from the center. The first transition at around occurs well within the ionized cavity region. Were it not for the [O III] and [N III] profiles (Fig. 10, top; Figs. 15, top and bottom), this transition zone at around would not have been recognized.
The CNO relative elemental abundances are nearly the same within the barrel wall (; Fig. 12, middle-right; Table 7). The average elemental abundances relative to H are 8.9 for C, 8.2 for N, and 8.9 for O, while the corresponding solar values are 8.4, 7.8, and 8.7, respectively (Grevesse et al., 2010). Hence, in NGC 6781 these elements are 0.5, 0.4, and 0.2 dex more abundant, respectively, with respect to the solar values. The N/O relative abundance is especially uniform and relatively low across the entire nebula (), which lead us to conclude that NGC 6781 did not have a high enough N abundance to be of Peimbert Type I (; Peimbert & Torres-Peimbert 1983). This is consistent with the previous determination by Liu et al. (2004b) based on the nebular He abundance, which barely satisfies the Type I criterion, NHe/N (Peimbert & Torres-Peimbert 1983). The above observation of NGC 6781 not being a Peimbert Type I PN suggests an upper limit of approximately 2 M⊙ for the initial mass of the progenitor star. While the C/O relative abundance is rather uncertain due to uncertainties in separating [C II] 158m line emission into H IIR and PDR components, the median C/O is . This means that the ionized gas is marginally carbon-rich (solar ; Grevesse et al. 2010). At any rate, there is no clear indication of an increasing C/O abundance toward the center of the nebula in the present data, as one might expect if the progenitor star was massive enough to have driven carbon-rich winds in the recent past.
In previous spatially-unresolved line diagnostics by Liu et al. (2001) and Liu et al. (2004a, b), these authors determined the following ionic abundances: N (5.6–6.8) , N, and O (2.7–6.2) , assuming K and cm-3. Our spatially-resolved measurements corroborated the use of uniform and values at least in the barrel cavity for the moderately ionized gas by yielding the averaged ionic abundances of , , and , for N+, N2+, and O+, respectively.
In terms of elemental abundances, previous nebular studies reported a dichotomy between abundance determinations (e.g., Garnett & Dinerstein 2001; Liu et al. 2004b; Tsamis et al. 2004), in which heavy element abundances relative to H calculated from weak optical recombination lines (ORLs) are systematically higher than those derived from collisionally excited lines (CELs). Presently, this discrepancy between abundances derived from ORLs and CELs is suspected to be a strong function of nebular evolution. For example, Liu et al. (2004b) assessed that the discrepancy was the most prominent among large, evolved, low-excitation PNs.
The range of elemental abundances that we resolved in different parts of NGC 6781 actually overlaps with the range of abundances obtained from ORLs and CELs. In previous studies, irrespective of the wavelengths employed, elemental abundance derivations were almost always performed in a spatially-integrated manner. Therefore, the present ORL-CEL discrepancies of elemental abundances could well be due simply to spatial resolution effects, i.e., each of the ORL and CEL methods may be sensitive to a particular and distinct physical condition of the nebula along the unresolved line of sight.
The analysis outlined above is very specific to ionized H IIRs. Non-ionized PDRs can be probed similarly to investigate physical conditions in colder regions. For example, surface brightness maps in neutral N ([N I] 5199,5202) and neutral H (H I at 21 cm; e.g., Rodríguez et al. 2002) would allow investigations into neutral regions. While such spatially-resolved analyses will resolve the degeneracy in the plane of the sky, degeneracy along the line of sight will still remain. This remaining degeneracy will have to be addressed by radiation transfer modeling including all the necessary ingredients – ionized, atomic, and molecular gas components and dust grains. Such modeling will be a topic of one of the follow-up HerPlaNS papers (e.g., Otsuka et al. in prep).
3.4 Empirical Gas-to-Dust Mass Ratio Distribution
One of the goals of HerPlaNS is to empirically obtain spatially-resolved gas-to-dust mass ratio distribution maps by deriving both the dust and gas column mass distribution maps directly from observational data. As we already obtained the dust column mass map for NGC 6781 from thermal continuum emission maps in § 3.1 (Fig. 5), here we outline how the gas column map for the nebula was derived.
The H+ column mass map for NGC 6781 was obtained by equating the H emissivity of the nebula202020The coefficients of this analytic expression were interpolated from the results by Brocklehurst (1971) under the assumption of an optically thin, Case B nebula Baker & Menzel (1938)., erg s-1 cm-3, to the H image taken at the NOT (Phillips et al., 2011). Upon solving for , we determined the (, ) radial profiles up to from the central star by interpolating the profiles calculated from the [N II] line ratio profiles (Fig. 12) through polynomial fitting. Also, the H map was made background-source free by removing all point sources within the nebula with empirically-defined PSFs using the IRAF daophot package. Then, the cleaned H map was properly scaled to have the de-reddened total H flux of erg s-1 cm-2 as explained in the previous section. Moreover, we assumed a constant filling factor of 0.5 and a distance of 950 pc.
The resulting ionized H+ gas column map of a radius was determined to contain 0.37 M⊙. By scaling this map by 1.452 (, where ; Liu et al. 2004a) to account for the ionized He component, we obtained the total ionized gas column map with a total mass of 0.53 M⊙. Based on the neutral to ionized gas mass ratio of 0.23 as estimated from the H column density, the total mass of atomic gas amounts to 0.12 M⊙. The total atomic gas column map was then synthesized by scaling the total dust column mass map, assuming that the lower-temperature atomic gas was distributed as the dust component, following the physical stratification discussed in the previous section.
Moreover, we synthesized the total molecular gas column map based on the total H2 mass estimate of 0.2 M⊙ derived via rotational diagram analysis using H2 emission line measurements of v=0–0 S(2) to S(7) transitions (Phillips et al., 2011). Again, we assumed that H2 was distributed in the same way as the low-temperature dust component. Finally, the total gas column mass map was obtained by summing these different gas phase maps and resampling at the same scale as the dust column mass map. By taking the ratio between the total gas and dust column maps, we thus empirically derived the gas-to-dust mass ratio map.
These column mass maps of the gas and dust components suggest that the total mass of the observed shell of NGC 6781 is about 0.86 M⊙. Assuming the mass of the central star at present is roughly 0.6 M⊙ (the average mass of a white dwarf; e.g., Kepler et al. 2007), we conclude that the initial mass of the progenitor is approximately 1.5 M⊙. Based on theoretical evolutionary tracks by Vassiliadis & Wood (1994), the central star appears to be passing its maximum point as it evolves onto the white dwarf cooling track.
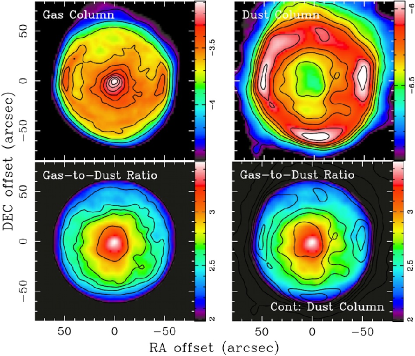
Fig. 14 shows both the synthesized total gas column map and observationally derived dust column mass map (top frames), as well as the gas-to-dust mass ratio distribution map (bottom frames with different contours). The gas column map is peaked at the center, with a slight enhancement in the dust barrel structure. The high gas column in the middle of the barrel cavity is due to low [N II] values: the gas column distribution would look more uniform if we instead adopted [O III] in this analysis. However, the gas column in the middle of the central cavity is relatively unimportant in terms of the gas-to-dust ratio, because the bulk of the dust grains resides in the barrel structure.
The gas-to-dust mass ratio map is peaked at the center (with a peak value of about 3000, owing to lack of dust grains in the cavity), with a generally radially decreasing profile reflecting the centrally-concentrated gas column mass distribution. The overall median gas-to-dust mass ratio is 335 with a standard deviation of 378. However, the gas-to-dust mass ratio over the central cavity is enhanced because the amount of dust present in the highly ionized barrel cavity is small. If we restrict ourselves to the region where the dust column registers more than 50% of the peak, the gas-to-dust ratio comes down to at most and the median gas-to-dust mass ratio is 195 with a standard deviation of 110.
These findings are in general consistent with a typical ballpark gas-to-dust mass ratio of roughly 160 for oxygen-rich and 400 for carbon-rich AGB winds (Knapp, 1985), and 100 for interstellar dust (Knapp & Kerr, 1974). However, we note that the gas-to-dust mass ratio varies radially from over 550 to 100 within the cylindrical barrel structure. Here, we have to exercise caution for the present derivation of the gas-to-dust mass ratio, especially for the lower limit, because (1) the lower temperature atomic and molecular gas components may be more preferentially distributed in the barrel than the ionized gas component and (2) there is only so much gas that can condense into dust grains. For a solar metallicity gas, the condensable mass fraction is about (5–6) , which gives a minimum gas-to-dust mass ratio of about 180.
For carbon stars, all excess carbon can potentially condense. While the gas-to-dust mass ratio depends critically on the C/O ratio, the dependence is poorly understood. The C/O ratio probably ranges from 1.1–2.0 at solar metallicity. Hence, the gas-to-dust mass ratio is expected to vary correspondingly from 220 to 100 (e.g., Matsuura et al. 2007). At any rate, we may want to reconsider the presently rampant “one-value-fits-all” approach of extrapolating the unknown amount of gas or dust component by scaling the empirically determined amount of the other component with a single gas-to-dust mass ratio. The HerPlaNS data will allow us to investigate how such variations of the gas-to-dust ratio within PNs change among the target sources or show a particular trend.
In the present analysis, the atomic and molecular gas column maps were simply scaled from the derived ionized gas column map under the assumption that all these components of various gas phases have similar spatial distributions. By performing the same line diagnostic analyses for the atomic and molecular components of the target nebulae with appropriate maps in atomic and molecular lines, it is possible to further constrain atomic and molecular gas column maps observationally so as to derive more accurate gas-to-dust mass ratio maps that are genuinely observationally-established. Such an analysis will be a topic in the forthcoming HerPlaNS papers (e.g., Exter et al. in prep).
4 Summary
Using the Herschel Space Observatory, we have collected a rich far-IR imaging and spectroscopic data set for a group of 11 PNs under the framework of the Herschel Planetary Nebula Survey (HerPlaNS). In this survey, we used all available observational modes of the PACS and SPIRE instruments aboard Herschel to investigate the far-IR characteristics of both the dust and gas components of the circumstellar nebulae of the target sources.
We obtained (1) broadband maps of the target sources at five far-IR bands, 70, 160, 250, 350, and 500 m, with rms sensitivities of 0.01–0.1 mJy arcsec-2 (0.4–4 MJy sr-1); (2) IFU spectral cubes of 51–220 m covering a field at multiple positions in the target sources, with rms sensitivities of 0.1–1 mJy arcsec-2 (4–40 MJy sr-1) per wavelength bin; and (3) sparsely sampled spectral array of 194–672 m covering a field at multiple positions in the target sources, with rms sensitivities of 0.001–0.1 mJy arcsec-2 (0.04–4 MJy sr-1) per wavelength bin.
In this first part of the HerPlaNS series, we described the data acquisition and processing and illustrated the potential of the HerPlaNS data using NGC 6781, a dusty molecular-rich bipolar PN oriented at nearly pole-on, as an example. Broadband images unveiled the surface brightness distribution of thermal continuum emission from NGC 6781. Spatially resolved was the object’s signature ring structure of a radius with a width, embedded in an extended halo of about 100′′ radius. This far-IR ring represents a nearly pole-on bipolar/cylindrical barrel structure, containing at least M⊙, at the adopted distance of pc (Schwarz & Monteiro 2006; all distance-dependent quantities were based on this value and subject to its 15% uncertainty).
Spectral fitting of the broadband images indicated that dust grains are composed mostly of amorphous-carbon based material (i.e., the power-law emissivity index of ) of the temperature between 26 and 40 K. In the past, far-IR SED fitting with broadband fluxes were performed under the assumption of negligible line contamination. With the HerPlaNS data, we verified that the degree of line contamination is approximately 8–20% and does not significantly affect the fitting results.
The Herschel spectra obtained at various locations within NGC 6781 revealed both the physical and chemical nature of the nebula. The spectra revealed a number of ionic and atomic lines such as [O III] 52, 88 m, [N III] 57 m, [N II] 122, 205 m, [C II] 158 m, and [O I] 63, 146 m, as well as various molecular lines, in particular, high-J CO rotational transitions, OH, and OH+ emission lines: see Aleman et al. (2013) and Etxaluze et al. (2013) for more details on the discovery of OH+ emission in PNs. Thermal dust continuum emission was also detected in most bands in these deep exposure spectra. Moreover, spectra taken at multiple spatial locations elucidated the spatial variations of the line and continuum emission, which reflect changes of the physical conditions within the nebula projected onto the plane of sky. On average, the relative distributions of emission lines of various nature suggested that the barrel cavity is uniformly highly ionized, with a region of lower ionization delineating the inner surface of the barrel wall, and that the least ionic and atomic gas, molecular, and dust species are concentrated in the cylindrical barrel structure.
The CO rotation diagram diagnostics yielded 60–70 K and cm-2. Compared with the previous CO measurements and diagnostics by Bachiller et al. (1993), the present observations and analysis with higher-J transitions sampled much warmer CO gas component in the cylindrical barrel structure, probably located closer to the equatorial region along the line of sight. However, the amount of this warm component was determined to be an order of magnitude smaller than the cold component.
Based on the PACS IFU spectral cube data, we derived line maps in the detected ionic and atomic fine-structure lines. Then, diagnostics of the electron temperature and density using line ratios such as [O III] 52/88 m and [N II] 122/205 m resulted in (, ) and ionic/elemental/relative abundance profiles for the first time in the far-IR for any PN. The derived profile substantiated the typical assumption of uniform K in the main ionized region, while showing an interesting increase in the barrel wall up to 11,000 K, followed by a sudden tapering off toward the halo region. The profile of high-excitation species is nearly flat at cm-3 across the inner cavity of the nebula, whereas the profile of low-excitation species exhibits a radially increasing tendency from 80 cm-3 to cm-3 with a somewhat complex variation around the barrel wall.
In fact, this [N II] profile is reflected in the physical stratification of the nebula revealed by the ionic/elemental abundance analysis. We found (1) a very highly ionized, centrally restricted H IIR within , (2) a highly ionized H IIR for 20–30′′ of the center marked by a high relative abundance of N2+ and O2+, (3) a moderately ionized H IIR within the inner surface of the barrel wall (for 30–50′′) marked by a high relative abundance of N+ and C+, and (4) a least ionized H IIR transitioning into a PDR on the barrel wall (beyond ) marked by the presence of molecular and dust species. The detected stratification is consistent with the previous inferences made from the past optical imaging observations in various emission lines of varying levels of excitation.
The derived relative elemental abundance profiles showed uniformly low N and C abundances, confirming the low initial mass ( M⊙) and marginally carbon-rich nature of the central star. However, the profiles did not appear to reveal variations reflecting the evolutionary change of the central star, such as a radially increasing carbon abundance. Nevertheless, the range of relative elemental abundances measured for spatially resolved observations of NGC 6781 overlaps with the range of abundances obtained from spatially-unresolved measurements of ORLs and CELs. This may indicate that the issue of dichotomy between abundance measurements made from ORLs and CELs is simply due to the spatial resolution effects. Therefore, it is interesting to revisit spatially-resolved diagnostics using optical line maps as performed here using far-IR line maps.
Direct comparison between the dust column mass map derived from the HerPlaNS broadband thermal dust data and the gas column mass map derived from the HerPlaNS fine-structure line mapping data augmented with literature data in other wavelengths yielded an empirical gas-to-dust mass ratio distribution map for NGC 6781. The resulting empirical gas-to-dust mass ratio map showed a range of ratios within the cylindrical barrel structure, in general radially decreasing roughly from 550 to 100. The average gas-to-dust mass ratio in the dust barrel was determined to be , and hence, is generally consistent with the typical spatially-unresolved ratio of 100–400 widely used in the literature for the case of PNs and AGB stars. The HerPlaNS data would therefore allow further investigations of the distribution of gas-to-dust mass ratios across the target PNs in a spatially resolved manner.
The derivation of column mass distribution maps for various components of NGC 6781, based on the empirically-established distribution of the ionized gas component, yielded an estimate for the total mass of the shell of 0.86 M⊙, consisting of 0.54 M⊙ of ionized gas, 0.12 M⊙ of atomic gas, 0.2 M⊙ of molecular gas, and M⊙ of dust grains. Provided that the present core mass is 0.6 M⊙, we concluded that the progenitor star had an initial mass of 1.5 M⊙. Then, theoretical evolutionary tracks of this 1.5 M⊙ star would suggest that the star is nearing to the end of its PN evolution, transitioning onto the white dwarf cooling track.
In the forthcoming papers of the HerPlaNS series, we will focus on separate analyses of the broadband maps (Ladjal et al. in prep) and spectra (Exter et al. in prep) using the wealth of the entire HerPlaNS data set to present more in-depth results of the analyses outlined above. In addition, we will report more on the energetics of the entire gas-dust system as a function of location in the nebulae, emphasizing the results’ statistical implications.
Acknowledgements.
This work is based on observations made with the Herschel Space Observatory, a European Space Agency (ESA) Cornerstone Mission with significant participation by NASA. Support for this work was provided by NASA through an award issued by Jet Propulsion Laboratory, Caltech (Ueta, Ladjal, Kastner, Sahai), the Japan Society of the Promotion of Science (JSPS) through a FY2013 long-term invitation fellowship program (Ueta), the Belgian Federal Science Policy Office via the PRODEX Programme of ESA (Exter, van Hoof), the Polish NCN through a grant 2011/01/B/ST9/02031 (Szczerba, Siódmiak), and the European Research Council via the advanced-ERC grant 246976 and the Dutch Science Agency (NWO) via the Dutch Astrochemistry Network and the Spinoza prize (Aleman, Tielens). The authors thank M. A. Guerrero for sharing the NOT optical images of NGC 6781 with us. Also, H. Monteiro’s generosity is appreciated for the reproduction of one of his figures (Fig. 3 of Schwarz & Monteiro 2006). Sahai acknowledges that his contribution to the research described here was carried out at the JPL/Caltech, under a contract with NASA. Finally, Ueta also acknowledges the hospitality of the members of the Laboratory of Infrared Astrophysics at ISAS/JAXA during his sabbatical stay as a JSPS invitation fellow.References
- Aleman et al. (2013) Aleman, I., Ueta, T., Ladjal. D., et al. 2013, A&A, submitted
- Baker & Menzel (1938) Baker, J. G., & Menzel, D. H. 1938, ApJ, 88, 52
- Bachiller et al. (1993) Bachiller, R., Huggins, P. J., Cox, P., & Forveille, T. 1993, A&A, 267, 177
- Bachiller et al. (1993) Bachiller, R., Forveille, T., Huggins, P. J., & Cox, P. 1997, A&A, 324, 1123
- Bohren & Huffman (1983) Bohren, C. F., & Huffman, D. R. 1983, Absorption and scattering of light by small particles (New York: Wiley)
- Boyer et al. (2012) Boyer, M. L., Srinivasan, S., Riebel, D., et al. 2012, ApJ, 748, 40
- Brocklehurst (1971) Brocklehurst, M. 1971, MNRAS, 153, 471
- Cantalupo et al. (2010) Cantalupo, C. M., Borill, J. D., Jaffe, A. H., & Stompor, R. 2010, ApJS, 187, 212
- Castro-Carrizo et al. (2001) Castro-Carrizo, A., Bujarrabal, V., Fong, D., et al. 2001, /aap, 367, 674
- Corradi et al. (2003) Corradi, R. L. M., Schönberner, D., Steffen, M., & Perinotto, M. 2003, MNRAS, 340, 417
- Cox et al. (2011) Cox, N. L. J., García-Hernández, D. A., García-Lario, P., & Manchado, A. 2011, AJ, 141, 111
- Draine & Lee (1984) Draine, B. T., & Lee, H. M. 1984, ApJ, 285, 89
- Etxaluze et al. (2013) Etxaluze, M., Cernicharo, J., Goicoechea, J. R., et al. 2013, A&A, submitted
- Frew (2008) Frew, D. J. 2008, Ph.D. Thesis, Macquarie Univ., NSW, Australia
- Fong et al. (2001) Fong, D., Meixner, M., Castro-Carrizo, A., et al. 2001, A&A, 367, 652
- Garnett & Dinerstein (2001) Garnett, D. R., & Dinerstein, H. L. 2001, Rev. Mex. Astron. Astrofis. Ser. Conf., 10, 13
- Gledhill et al. (2002) Gledhill, T. M., Bains, I., & Yates, J. A. 2002, MNRAS, 332, L55
- Goldsmith & Langer (1999) Goldsmith, P. F., & Langer, W. D. 1999, ApJ, 517, 209
- Grevesse et al. (2010) Grevesse, N., Asplund, M., Sauval, A. J., & Scott, P. 2010, Ap&SS, 328, 179
- Griffin et al. (2010) Griffin, M. J., Abergel, A., Abreu, A., et al. 2010, A&A, 518, L3
- Groenewegen et al. (2011) Groenewegen, M. A. T., Waelkens, C., Barlow, M. J., et al. 2011, A&A, 526, A162
- Gruendl et al. (2006) Gruendl, R. A., Guerrero, M. A., Chu, Y.-H., & Williams, R. M. 2006, ApJ, 653, 339
- Gry et al. (2003) Gry, C., Swinyard, B., Harwood, A., et al. 2003, The ISO Handbook, Volume III – LWS – The Long Wavelength Spectrometer SAI-99-077/Dc, Version 2.1 (Vilspa: ESA)
- Guerrero & De Marco (2013) Guerrero, M. A., & De Marco, O. 2013, A&A, 553, 126
- Hiriart (2005) Hiriart, D. 2005, A&A, 187, 181
- Hora, Latter, & Deutsch (1999) Hora, J. L., Latter, W. B., & Deutsch, L. K. 1999, ApJS, 124, 195
- Kastner et al. (2003) Kastner, J. H., Balick, B., Blackman, E. G., et al. 2003, ApJ, 591, L37
- Kastner et al. (2012) Kastner, J. H., Montez, R., Jr., Balick, B., et al. 2012, AJ, 144, 58
- Kepler et al. (2007) Kepler, S. O., Kleinman, S. J., Nitta, A., et al. 2007, MNRAS, 375, 1315
- Kerber et al. (2003) Kerber, F., Mignani, R. P., Guglielmetti, F., & Wicenec, A. 2003, A&A, 408, 1029
- Kessler et al. (1996) Kessler, M. F., Steinz, J. A., Anderegg, M. E., et al. 1996, A&A, 315, L27
- Knapp (1985) Knapp, G. R. 1985, ApJ, 293, 273
- Knapp et al. (1994) Knapp, G. R., Bowers, P. F., Young, K., & Phillips, T. G. 1994, ApJ, 429, 33
- Knapp & Kerr (1974) Knapp, G. R., & Kerr, F. J. 1974, ApJ, 35, 361
- Knapp et al. (1993) Knapp, G. R., Sandell, G., & Robson, E. I. 1993, ApJS, 88, 173
- Kwok (2000) Kwok, S. 2000, The Origin and Evolution of Planetary Nebulae (Campridge: CUP)
- Liu et al. (2001) Liu, X.-W., Barlow, M. J., Cohen, M., et al. 2001, MNRAS, 323, 343
- Liu et al. (2004a) Liu, Y., Liu, X.-W., Luo, S.-G., & Barlow, M. J. 2004a, MNRAS, 353, 1231
- Liu et al. (2004b) Liu, Y., Liu, X.-W., Barlow, M. J., & Luo, S.-G. 2004b, MNRAS, 353, 1251
- Malhotra et al. (2001) Malhotra, S., Kaufman, M. J., Hollenbach, D., et al. 2001, ApJ, 561, 766
- Mathis, Rumpl, & Nordsieck (1977) Mathis, J. S., Rumpl, W., & Nordsieck, K. H. 1977, ApJ, 217, 425
- Matsuura et al. (2009) Matsuura, M., Barlow, M. J., Zijlstra, A. A., et al. 2009, MNRAS, 396, 918
- Matsuura et al. (2007) Matsuura, M., Zijlstra, A. A., Bernard-Salas, J., et al. 2007, MNRAS, 382, 1889
- Mavromatakis et al. (2001) Mavromatakis, F., Papamastorakis, J., & Paleologou, E. V. 2001, A&A, 374, 280
- Melnick et al. (1987) Melnick, G. J., Genzel, R., & Lugten, J. B. 1987, ApJ, 321, 530
- Mennella et al. (1995) Mennella, V., Colangeli, L., & Bussoletti, E. 1995, A&A, 295, 165
- Milanova & Kholtygin (2009) Milanona, Y. V., & Kholtygin, A. F. 2009, Astron. Lett., 35, 518
- Murakami et al. (2007) Murakami, H., Baba, H., Barthel, P., et al. 2007, PASJ, 59, S369
- Ott (2010) Ott, S. 2010, ASP Conf. Ser. 434, Astronomical Data Analysis Software and Systems XIX, eds. Y. Mizumoto, K. Morita, & M. Ohishi (San Francisco: ASP), 139
- Peimbert & Torres-Peimbert (1983) Peimbert, M., & Torres-Peimbert, S. 1983, in Planetary nebulae: Proceedings of the Symposium (Dordrecht: D. Reidel Publishing), p.233
- Phillips et al. (2011) Phillips, J. P., Ramos-Larios, G., & Guerrero, M. A. 2011, MNRAS, 415, 513
- Pilbratt et al. (2010) Pilbratt, G. L., Riedinger, J. R., Passvogel, T., et al. 2010, A&A, 518, L1
- Poglitsch et al. (2010) Poglitsch, A., Waelkens, C., Geis, N., et al. 2010, A&A, 518, L2
- Pottasch et al. (1984) Pottasch, S. R., Baud, B., Beintema, D., et al. 1984, A&A, 138, 10
- Rodríguez et al. (2002) Rodríguez, L. F., Goss, W. M., & Williams, R. 2002, ApJ, 574, 179
- Rouleau & Martin (1991) Rouleau, F. & Martin, P. G. 1991, ApJ, 377, 526
- Roussel (2013) Roussel, H. 2013, PASP, 125, 1126
- Rubin et al. (1994) Rubin, R. H., Simpson, J. P., Lord, S. D., et al. 1994, ApJ, 420, 772
- Sabin et al. (2010) Sabin, L., Zijlstra, A. A., Wareing, C., et al. 2010, PASA, 27, 166
- Sahai et al. (2011) Sahai, R., Morris, M. R., & Villar, G. G. 2011, AJ, 141, 134
- Sandin et al. (2008) Sandin, C., Schönberner, D., Roth, M. M., et al. 2008, A&A, 486, 545
- Schönberner et al. (2005) Schönberner, D., Jacob, R., Steffen, M., et al. 2005, A&A, 431, 963
- Schwarz & Monteiro (2006) Schwarz, H. E., & Monteiro, H. 2006, ApJ, 648, 430
- Shaw & Dufour (1995) Shaw, R. A., & Dufour, R. J. 1995, PASP, 107, 896
- Siódmiak & Tylenda (2001) Siódmiak, N., & Tylenda, R. 2001, A&A, 373, 1032
- Smith (2003) Smith, N. 2003, MNRAS, 342, 383
- Speck et al. (2002) Speck, A. K., Meixner, M., Fong, D., et al. 2002, AJ, 123, 346
- Su et al. (2007) Su, K. Y. L., Chu, Y.-H., Rieke, G. H., et al. 2007, AJ, 657, L41
- Tielens (2010) Tielens, A. G. G. M. 2010, The Physics and Chemistry of the Interstellar Medium (Cambridge: CUP)
- Tsamis et al. (2004) Tsamis, Y. G., Barlow, M. J., Liu, X.-W., et al. 2004, MNRAS, 353, 953
- Ueta (2006) Ueta, T. 2006, ApJ, 650, 228
- Vamvatira-Nakou et al. (2013) Vamvatira-Nakou, C., Hutsemékers, D., Royer, P., et al. 2013, A&A, 557, A20
- van Hoof et al. (2010) van Hoof, P. A. M., van de Steene, G. C., Barlow, M. J., et al. 2010, A&A, 518, L137
- van Hoof et al. (2013) van Hoof, P. A. M., van de Steene, G. C., Exter, K. M., et al. 2013, A&A, 560, 7
- Vassiliadis & Wood (1994) Vassiliadis, E., & Wood, P. R. 1994, ApJS, 92, 125
- Villaver, Manchado, & García-Segura (2002) Villaver, E., Manchado, A., & García-Segura, G. 2002, ApJ, 581, 1204
- Volk & Kwok (1988) Volk, K., & Kwok, S. 1988, ApJ, 331, 435
- Wareing et al. (2006) Wareing, C. J., O’Brien, T. J., Zijlstra, A. A., et al. 2006, MNRAS, 366, 387
- Weinberger (1989) Weinberger, R. 1989, A&AS, 78, 301
- Weisskopf et al. (2002) Weisskopf, M. C., Brinkman, B., Canizares, C., et al. 2002,PASP. 114, 1
- Werner et al. (2004) Werner, M. W., Roellig, T. L., Low, F. J., et al. 2004, ApJS, 154, 1
- Zhang et al. (2012) Zhang, Y, Hsia, C.-H., & Kwok, S. 2012, ApJ, 755, 53
- Zijlstra, Pottasch, & Bignell (1989) Zijlstra, A. A., Pottasch, S. R., & Bignell, C. 1989, A&AS, 70, 329
- Zuckerman et al. (1990) Zuckerman, B, Kastner, J. H., Balick, B., & Gatley, I. 1990, ApJ, 356, L59
Appendix A PACS SED Range Spectroscopy Spectral Maps
Fig. 15 and 16 show spatially-varying emission lines of NGC 6781 other than those already presented in Fig. 10. Displayed are all 50 spectra extracted from each of the spaxels at each of the two spatial pointings on the eastern rim (left) and at the center (right). These spectra show that the relative strengths of these ionic, atomic, and molecular lines change depending on the spaxel position along each line of sight within the PACS IFU aperture. The approximate spatial correspondence of the 50 spaxels to the 70 m broadband map is shown by the color-scale surface brightness map in the background. Within the central ionized region, ionic lines ([O III] and [N III]) are strong (seen in the spaxels of the western half of the “rim” pointing and of the “center” pointing). While moving laterally away from the center of the nebula to outer regions along the plane of the sky via the eastern rim, the largest change of the relative strengths of lines occurs when going across the rim at which the ionic lines become weaker and atomic lines ([O I], [N II], and [C II]) become stronger. This transition region, however, is physically very restricted as the change is seen across nearly only one-spaxel width.
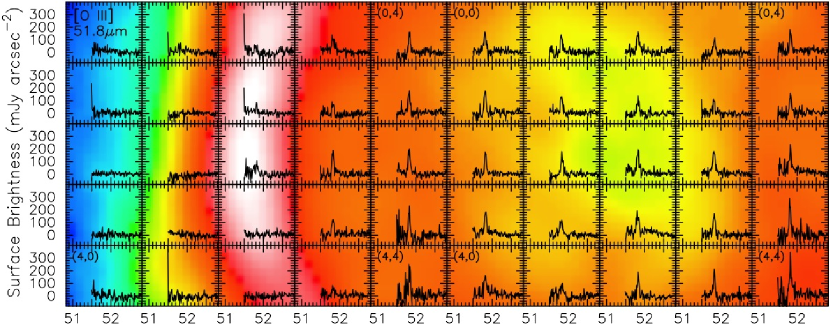

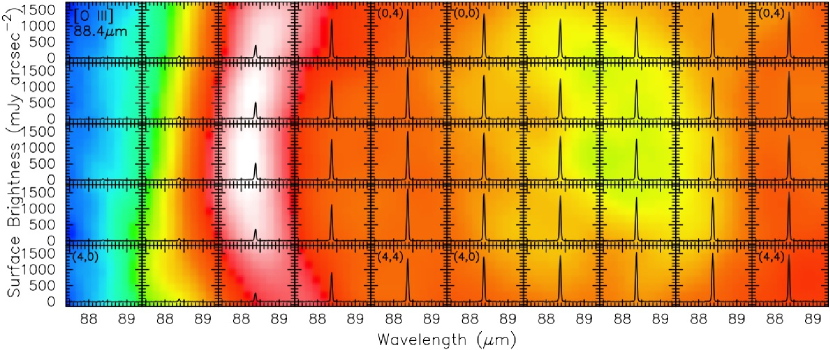


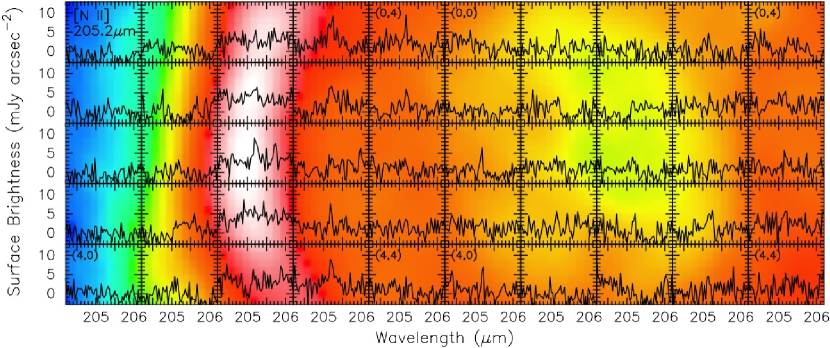
Appendix B SPIRE FTS High-Spectral Resolution Spectral Maps
Figs. 17 and 18 show all 70 spectra extracted from each of the two pointings of the 35-bolometer SSW array (2 bolometers are blind – they are left blank in the map), covering 194–342 m, and all 38 spectra extracted from each of the two pointings of the 19-bolometer SLW array, covering 316–672 m, respectively. The entire SPIRE wavelength coverage from 194–672 m is achieved in at least 16 locations (which are shown as Fig. 9 in the main text). These spectra show that the relative strengths of the ionic [N II] line in the SSW spectral range and CO rotational lines in the SLW spectral range, vary depending on the bolometer position within the target nebula. Within the central ionized region, both atomic and molecular lines are weaker than in the ring structure. In both SSW and SLW spectral ranges, however, the line strengths suddenly decrease once the line of sight goes beyond the central ionized region, suggesting that the presence of the gas component in the nebula is fairly spatially restricted – not much beyond the central ionized region and the cylindrical barrel structure.