Nanophotonic enhancement of the Förster resonance energy transfer rate on single DNA molecules
Abstract
Nanophotonics achieves accurate control over the luminescence properties of a single quantum emitter by tailoring the light-matter interaction at the nanoscale and modifying the local density of optical states (LDOS). This paradigm could also benefit to Förster resonance energy transfer (FRET) by enhancing the near-field electromagnetic interaction between two fluorescent emitters. Despite the wide applications of FRET in nanosciences, using nanophotonics to enhance FRET remains a debated and complex challenge. Here, we demonstrate enhanced energy transfer within single donor-acceptor fluorophore pairs confined in gold nanoapertures. Experiments monitoring both the donor and the acceptor emission photodynamics at the single molecule level clearly establish a linear dependence of the FRET rate on the LDOS in nanoapertures. These findings are applied to enhance the FRET rate in nanoapertures up to six times, demonstrating that nanophotonics can be used to intensify the near-field energy transfer and improve the biophotonic applications of FRET.
CNRS, Aix-Marseille Université, Centrale Marseille, Institut Fresnel, UMR 7249, 13013 Marseille, France
∗ Corresponding author: jerome.wenger@fresnel.fr
Nanoscale energy transfer between molecules is a core phenomenon in photosynthesis [1, 2, 3] and an enabling technology for photovoltaics [4, 5], organic lighting sources [6] or biosensing [7]. When the distance between the excited donor D to the ground-state acceptor molecule A is on the range of 2-20 nm, the energy transfer is adequately described by the Förster resonance energy transfer (FRET) formalism which accounts for near-field nonradiative dipole-dipole interaction [8]. As the FRET efficiency goes down with the inverse sixth power of the D-A distance, FRET provides accurate information with sub-nanometer resolution on the spatial relationship between two fluorophore-labeled sites in biological structures [9]. FRET has thus become one of the most popular tools in single molecule spectroscopy, and is largely used to study conformational changes in macromolecules as well as molecular interaction dynamics between proteins, DNA, RNA and peptide molecules [10, 11].
The interaction between molecules and light at the nanoscale is at the heart of FRET. Therefore using nanophotonics to control light at the nanoscale is appealing to enhance the near-field dipole-dipole energy transfer. Since the pioneering works of Purcell and Drexhage [12, 13], it is well established that the luminescence properties of a single quantum emitter can be engineered by its photonic environment through the local density of optical states (LDOS) [14, 15]. Successful demonstrations of this concept include cavity quantum electrodynamics [16], photonic band gap materials [17, 18], and more recently plasmonic antennas [19, 20]. However, when the discussion turns to the interaction of two emitters with their environment, the LDOS influence on the Förster energy transfer remains an open debate. Since FRET directly competes with the donor direct emission and the donor nonradiative energy losses to its environment, it is unclear whether Förster transfer can be enhanced when the LDOS is tuned to increase the donor emission. Pioneering works on ensemble measurements in microcavities suggested that the FRET rate depends linearly on the donor emission rate and the LDOS [21, 22, 23, 24]. While several theoretical works support this finding [25, 26, 27, 28, 29], it was also suggested that the FRET rate was quadratically dependent on the LDOS [30], or even independent of the LDOS [31]. A recent experimental study on molecules near a planar mirror concludes that the energy transfer rate is independent of the LDOS [32]. In this case, the FRET efficiency and characteristic distance are reduced when the LDOS is enhanced, which comes in apparent contradiction with qualitative photonic effects on FRET published earlier [33, 34, 35, 36, 37, 38, 39, 40]. Moreover, most studies consider only the donor emission photodynamics and measure ensembles of molecules.
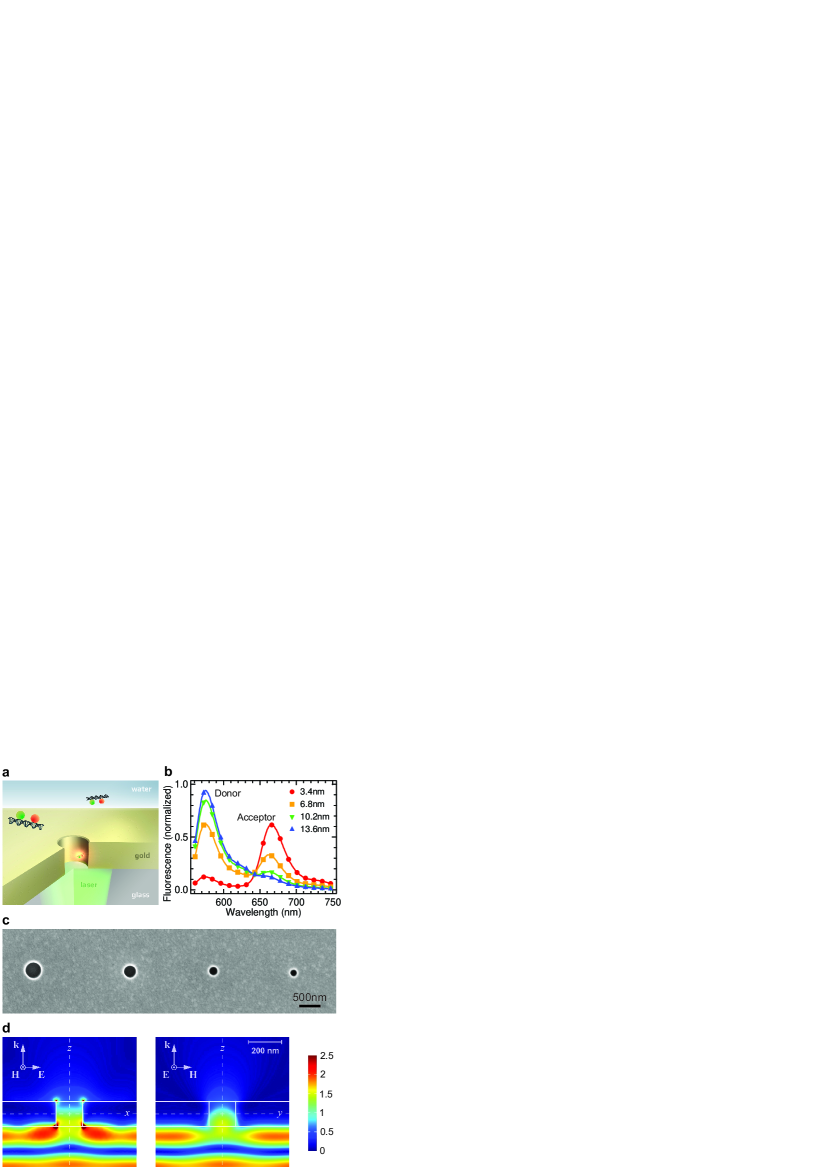
Here, we explore the LDOS influence on the FRET process using precisely defined plasmonic nanoapertures to control the LDOS and single donor-acceptor fluorophore pairs on double-stranded DNA linkers to provide a wide range of FRET rates and efficiencies (Fig. 1a). Our experiments are conducted at the single molecule level and monitor both the donor and the acceptor emission photodynamics. Two separate measurements of the FRET rate and efficiency are obtained based either on the donor lifetime reduction in the presence of the acceptor, or the acceptor fluorescence increase in presence of the donor. The FRET efficiency is defined as the probability of energy transfer over all donor transition events: , where is the total decay rate of the isolated donor (without acceptor) and is the total decay rate of the donor in the presence of the acceptor. The donor-only decay rate is proportional to the LDOS at the donor emission wavelength and is tuned by the photonic environment [14, 15].
To provide a wide range of LDOS, we use circular nanoapertures with diameters ranging from 160 to 380 nm milled in a 150 nm thick gold film on a glass coverslip by focused ion beam (Fig. 1c,d). Molecules randomly diffusing inside the apertures experience an average fluorescence lifetime reduced by a factor up to three fold. While the LDOS is expected to vary spatially inside the nanoaperture depending on the position and orientation of the emitter respective to the metal, the net fluorescence lifetime reduction observed on the decay traces averaged for all emitter positions and orientations inside the aperture demonstrates an increase of the spatially-averaged LDOS inside nanoapertures [41, 42, 43]. Nanoapertures thus realize a reproducible platform to tune the spatially-averaged LDOS. They also have a broad spectral response so that the same structure can enhance both the donor and the acceptor emission (see Supplementary Information Fig. 7 and 8).
To provide a wide range of FRET rates and efficiencies, we synthesize double stranded DNA molecules with increasing distances between the Atto550 donor and the Atto647N acceptor from 10 to 40 base pairs (3.4 to 13.6 nm). The double stranded DNA forms a rigid linker enabling accurate positioning the donor and acceptor with sub-nanometer resolution [44]. The spectral overlap between Atto550 and Atto647N ensures Förster transfer with a characteristic distance of 6.5 nm in pure water medium, that is confirmed by ensemble fluorescence spectroscopy (Fig. 1b). Hence by varying either the donor-acceptor distance or the nanoaperture diameter, we have two independent parameters to tune the FRET rate and the LDOS, and monitor the effect of the LDOS on the FRET rate.
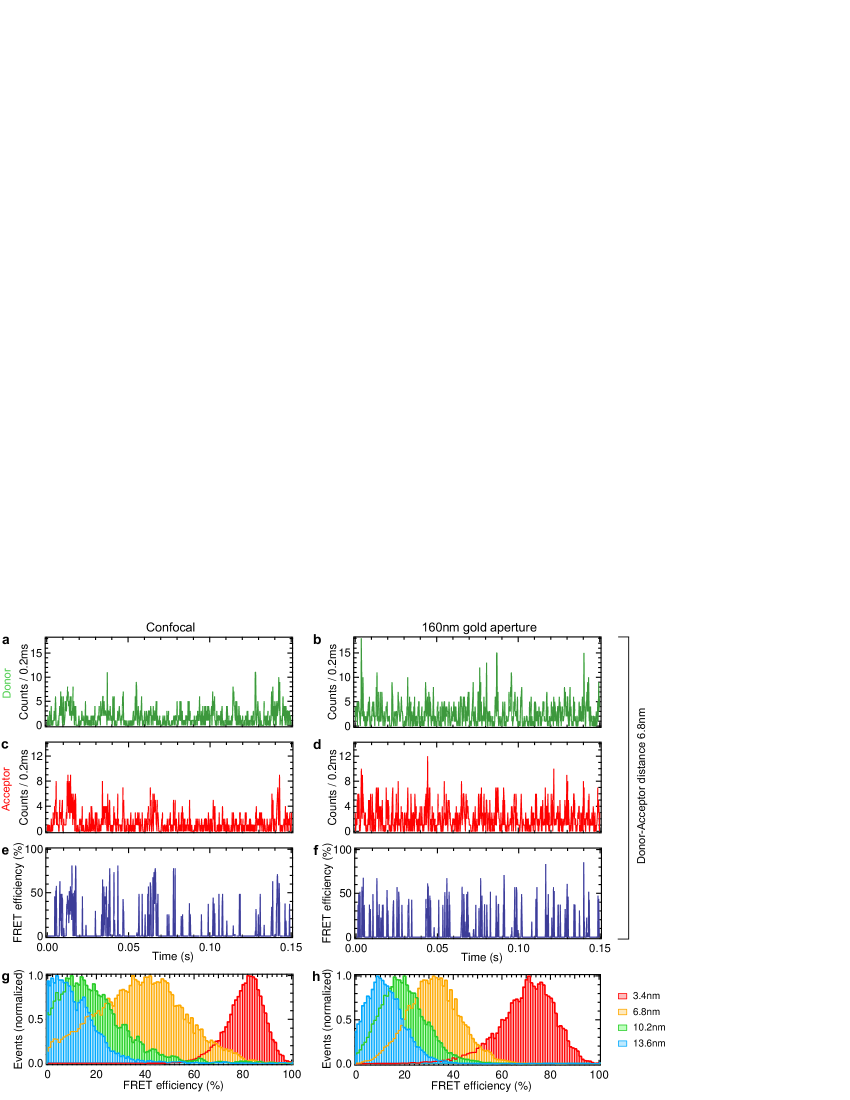
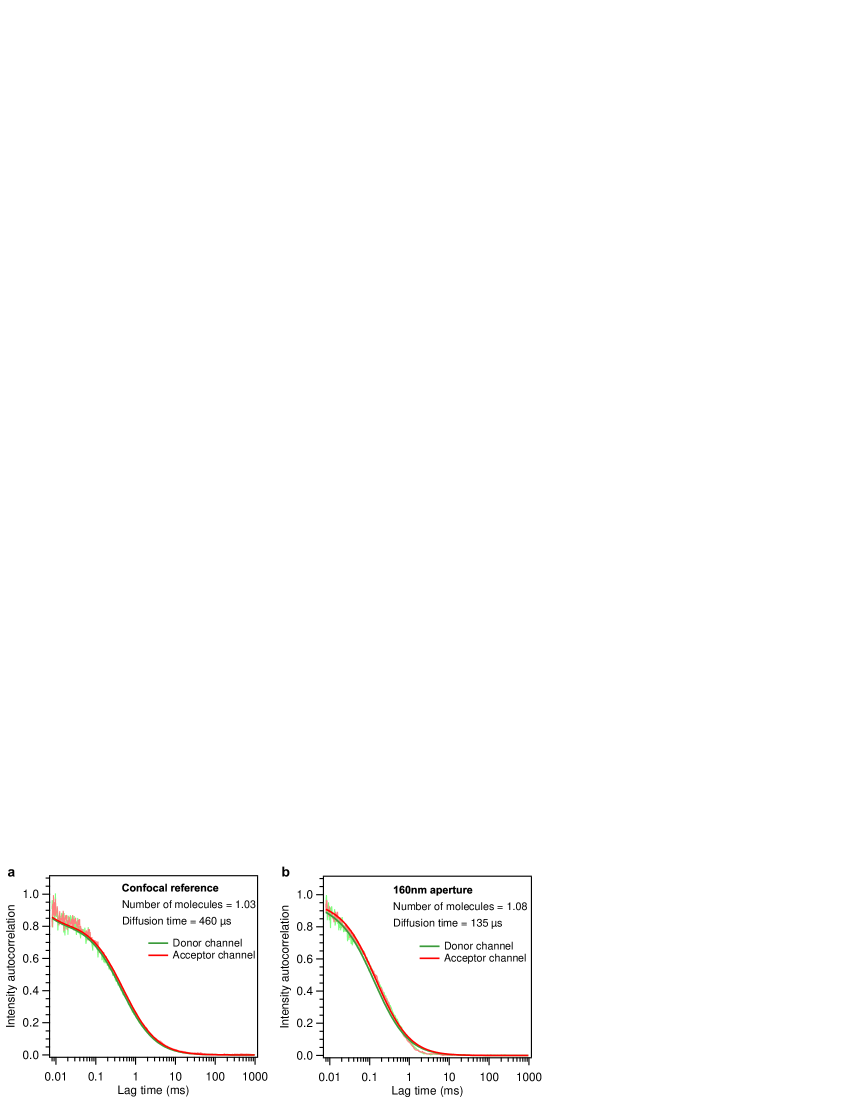
For direct observation of single molecule diffusion events, the nanoaperture sample is covered by a water solution containing the diluted DNA FRET pairs. Every time a fluorescent molecule crosses the detection volume a fluorescence burst is generated, which results in the typical time traces displayed on Fig. 2a-d. The burst duration is set by the translational diffusion time and typically amounts to 460 s for the confocal reference and 135 s for the nanoaperture of 160 nm diameter. Comparing the bursts intensity in confocal to the nanoaperture, a fluorescence enhancement of about 2 times is found for the donor and the acceptor detection channels (see Supplementary Information Fig. 6 and 7 for fluorescence correlation spectroscopy analysis and fluorescence enhancement factors). For each fluorescence photon burst, a FRET efficiency can be computed (see Methods) and collected in a histogram (Fig. 2e,f). Figures 2g,h summarize the FRET efficiency histograms for increasing donor-acceptor distances in confocal and in the 160 nm nanoaperture. Except for the 3.4 nm D-A distance, the histogram width is reduced by about 50% inside the nanoaperture as compared to confocal reference. This is primarily a consequence of the higher photon counts per emitter (fluorescence enhancement) in the nanoaperture. The average FRET efficiencies also appear marginally affected by the nanoaperture, with a different influence on the FRET efficiency depending on the D-A distance: while the FRET efficiency for the shortest D-A distance (3.4 nm) is reduced by the nanoaperture from 83 to 76%, the FRET efficiency for the longest D-A distance (13.6 nm) is increased from 4 to 10%.
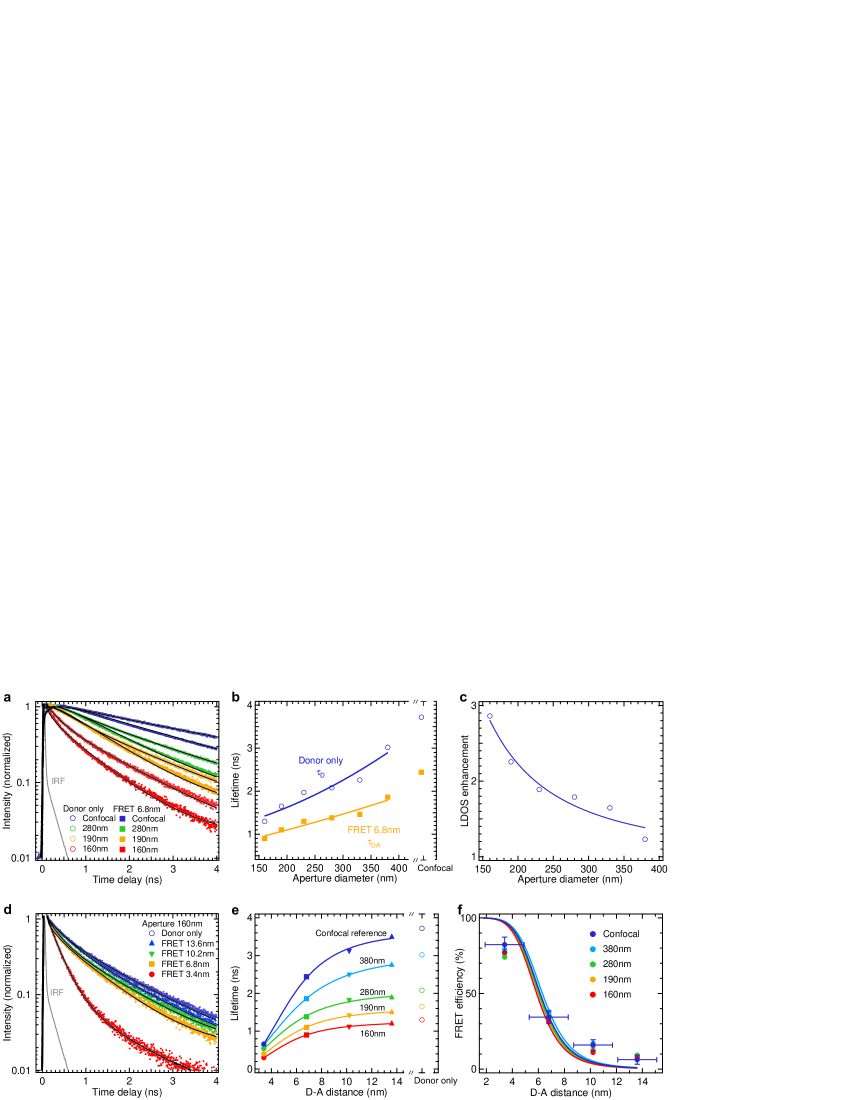
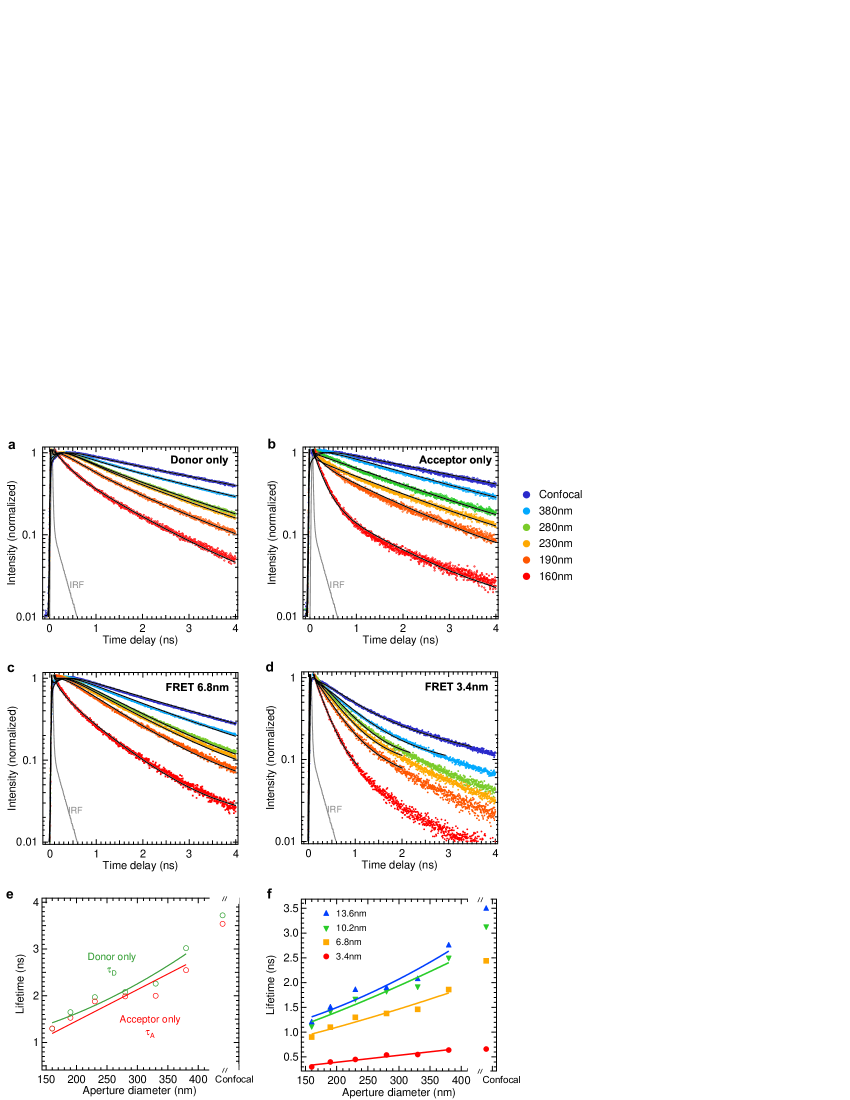
To quantify the acceleration of the fluorescence photodynamics and the LDOS enhancement in nanoapertures, we record the donor fluorescence decay traces by time-correlated single photon counting. Figures 3a-c report the influence of the nanoaperture diameter (see also Supplementary Information Fig. 8). For the isolated donor, the fluorescence lifetime decreases from 3.7 to 1.3 ns as the nanoaperture diameter is reduced to 160 nm. This data is equivalent to an increase in the donor-only total decay rate and the LDOS by a factor 2.9 (Fig. 3c). In the presence of the acceptor at a 6.8 nm separation, the donor emission dynamics are further accelerated by the additional decay channel brought by the acceptor: and the donor fluorescence lifetime is further reduced (Fig. 3b). We monitor a lifetime reduction as function of the aperture diameter similar to the case of the donor only, from 2.5 to 0.9 ns in the presence of the acceptor. Figures 3d-f then describe the influence of the donor-acceptor separation for a given nanoaperture diameter. A clear reduction of the donor emission lifetime (donor quenching) is observed as the D-A distance is reduced, with a similar trend observed for all nanoaperture diameters. The decay rates in the presence and absence of the acceptor also enable to compute the FRET efficiency as (Fig. 3f). As for the analysis based on the fluorescence bursts (Fig. 2g,h), we observe that the FRET efficiencies deduced from the decay traces appear marginally affected by the nanoaperture in the case of short D-A separations.
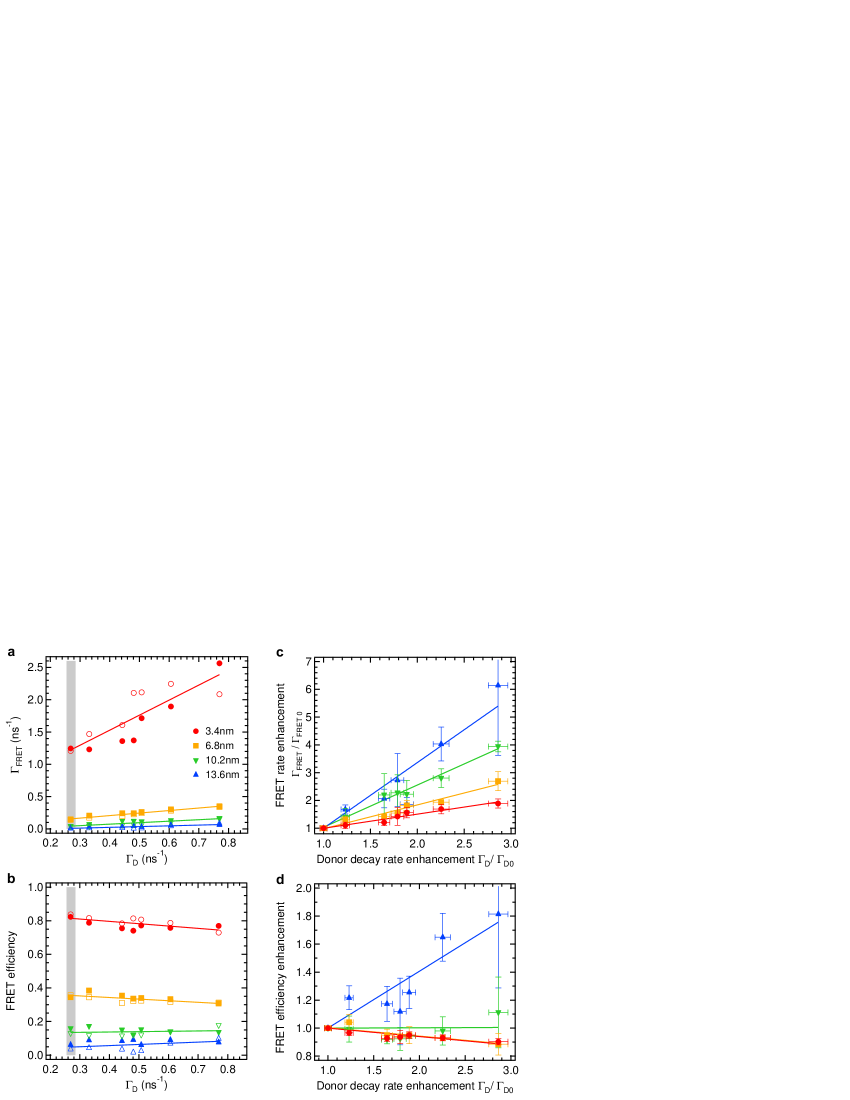
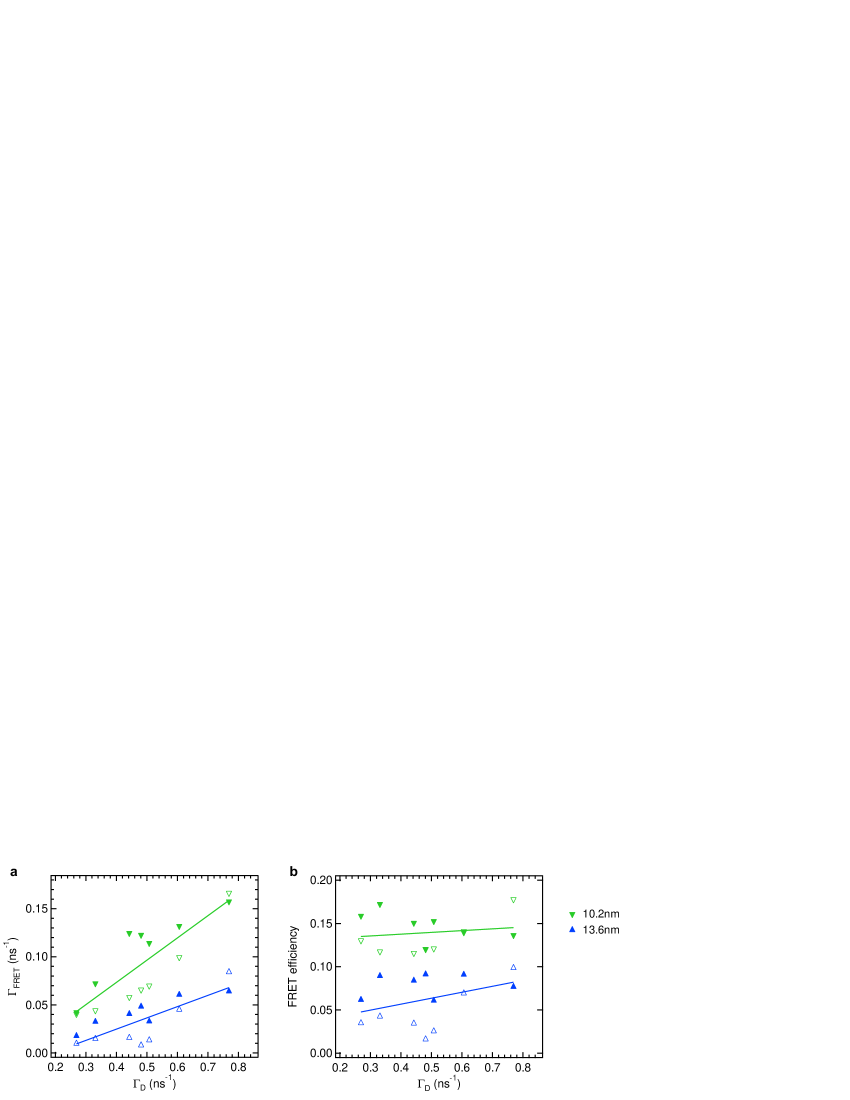
To establish the effect of the LDOS on the Förster transfer, we display in Fig. 4a,b the FRET rate and efficiency as function of the donor-only decay rate which is proportional to the LDOS at the donor emission wavelength. A strength of our study is that we use two different approaches to quantify and based either on the donor lifetime reduction, or the acceptor fluorescence bursts (see Methods). The data points in Fig. 4a,b summarize the results: filled markers are deduced from the donor lifetime reduction and empty markers are deduced from fluorescence burst analysis. Both approaches converge to similar values, confirming the general trend. As our main result, our data clearly demonstrate a linear dependence of the FRET rate on the LDOS for all four D-A separations (Fig. 4a and Supplementary Information Fig. 9). This result is further confirmed by the slight variations of the FRET efficiency as the LDOS changes (Fig. 4b), which was already observed as function of the aperture diameter in Fig. 2g,h and Fig. 3f: to maintain a similar ratio , the FRET rate must increase accordingly as increases. Our results are in agreement with the ensemble-based experimental findings on microcavities [22] and the dependence predicted theoretically [28, 29], and in contradiction with the conclusions found near a planar mirror [32]. We believe that the different D-A separations, the brighter emission rates and the larger LDOS variations in our case further ease assessing the LDOS influence on the FRET process.
To go further into the analysis, we display the FRET rate enhancement as function of the LDOS enhancement by normalizing the results in Fig. 4a,b with the values found for the confocal reference (, ). This representation reveals better the effect of the LDOS for the cases of large D-A separations and weak FRET rates and efficiencies. The global trend observed is a larger enhancement of the FRET rate as the D-A distance is increased: typically a 2x enhancement of the FRET rate is observed for a D-A distance of 3.4 nm when the LDOS is increased by x, whereas the FRET rate enhancement can be as large as 6x when the D-A distance is 13.6 nm. To explain the fact that the FRET rate enhancement and the LDOS enhancement do not necessarily coincide, it should be kept in mind that the LDOS enhancement (as we define it) amounts to the increase in the total decay rate and include both radiative and nonradiative (ohmic losses) energy decay channels, while we expect the FRET rate enhancement to be proportional to the radiative part of the LDOS enhancement [29].
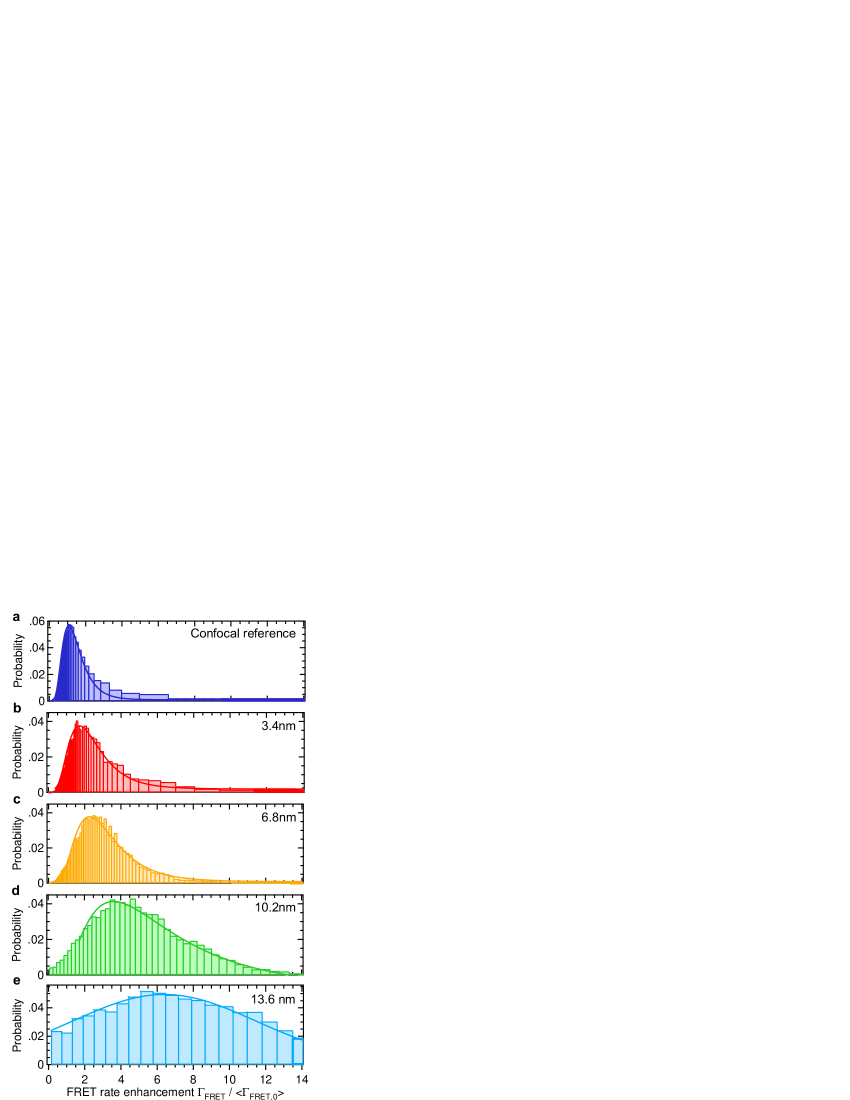
Beyond the average values of FRET rates and efficiencies, monitoring the fluorescence bursts from single molecules allows to recover the statistical distribution of the FRET rates. This is obtained by reformulating the formula defining the FRET efficiency: , and using the separate measurements of the FRET efficiency histograms (Fig. 2h) and the donor-only decay rates (Fig. 3b). Figure 5 depicts the distribution of the measured FRET rates enhancement , where is the average FRET rate found for the confocal reference. As for Fig. 4c, the global trend is a larger enhancement of the FRET rate as the D-A distance increases. Furthermore, the statistical distributions show that significant FRET rate enhancement above 5-fold are reproducibly observed, demonstrating that nanophotonics can be used to enhance the near-field energy transfer.
In summary, we report enhanced energy transfer within single donor-acceptor fluorophore pairs confined in gold nanoapertures, and demonstrate experimentally that the Förster energy transfer rate depends linearly on the LDOS. By increasing the donor dipole oscillator strength, the nanoaperture allows to efficiently transfer the energy to the acceptor dipole in the near-field. These findings are important as they unlock the potential application of the large nanophotonic toolbox for single emitter fluorescence control to further enhance the FRET process broadly used in single molecule spectroscopy applied to life sciences. An additional advantage is brought by the appealing property of nanoapertures to perform single molecule analysis at high physiological concentrations [45, 46], providing a new class of substrates for enhanced single molecule FRET analysis.
Methods
Nanoaperture sample fabrication
Nanoapertures are milled by focused ion beam (FEI Strata Dual Beam 235) on 150 nm thick gold films deposited using thermal evaporation on standard 150 m thick glass coverslips.
DNA synthesis and preparation
Double-stranded DNA constructs of 51 base pairs length are designed with a one donor label Atto550 on the forward strand, and one acceptor label Atto647N on the reverse strand, at varying distances, so that the donor and acceptor are separated by 10, 20, 30 or 40 base pairs from each other to make at 3.4, 6.8, 10.2, or 13.6 nm varying distance respectively. As 10 base pairs make a complete turn on the DNA double strand, the choice of D-A separation as multiples of 10 base pairs avoids taking into account the complex three-dimensional structure of DNA to estimate the D-A distance [44]. All constructs are purchased from IBA GmbH, Goettingen, Germany.
The forward strand sequence is
5’ CCTGAGCGTACTGCAGGATAGCCTATCGCGTGTCATATGCTGTCAGTGCG 3’.
The reverse strand sequence is
5’ CGCACTGAACAGCATAGACACGCGAAGGCTATCCGCAGTACGCCAGG 3’.
The donor-only and acceptor-only references are constructed with the same sequences by replacing either the acceptor or the donor with unlabeled complementary strand respectively. The strands are annealed at 10 M concentration in 20 mM Tris, 1 mM EDTA, 500 mM NaCl, 12 mM MgCl2 buffer, and by heating to 95∘C for 5 min followed by slow cooling to room temperature. Samples were then stored at -28∘C. For single-molecule experiments labeled double stranded DNA stocks are diluted in a 10 mM Hepes-NaOH buffer, pH 7.5 (Sigma-Aldrich).
Experimental setup
The experimental set-up is based on a confocal inverted microscope with a Zeiss C-Apochromat 63x 1.2NA water-immersion objective. The excitation source is a iChrome-TVIS laser (Toptica GmbH) delivering 3 ps pulses at 40 MHz repetition rate and 550 nm wavelength. Filtering the laser excitation is performed by a set of two bandpass filters (Chroma ET525/70M and Semrock FF01-550/88). The excitation power at the diffraction limited spot is set to 40 W for all the experiments. Positioning the nanoaperture at the laser focus spot is obtained with a multi-axis piezoelectric stage (Polytech PI P-517.3CD). Dichroic mirrors (Chroma ZT594RDC and ZT633RDC) separate the donor and acceptor fluorescence light from the epi-reflected laser and elastically scattered light. The detection is performed by two avalanche photodiodes (Micro Photon Devices MPD-5CTC with 50 m active surface and ps timing jitter) with nm (Chroma ET605/70M and ET632/60M) and nm (Semrock FF01-676/37) fluorescence bandpass filters for the donor and acceptor channels respectively. The photodiode signal is recorded by a fast time-correlated single photon counting module (Hydraharp400, Picoquant GmbH) in time-tagged time-resolved (TTTR) mode. The temporal resolution of our setup for fluorescence lifetime measurements (width of the instrument response function) is 37 ps at half-maximum.
FRET analysis based on donor lifetime
The decay traces obtained for the donor detection channel are fitted by a single exponential decay reconvoluted by the instrument response function (IRF) to extract the donor fluorescence lifetime using the commercial software Symphotime 64 (Picoquant GmbH). For the smallest aperture diameters, a background signal is detected due to the non-negligible photoluminescence from the gold film, and is accounted for in the lifetime analysis by adding a supplementary decay term with a fixed 5 ps characteristic time. For each aperture and each D-A separation, two sets of measurements are performed to determine the donor lifetime in the presence of the acceptor and the donor-only lifetime in the absence of acceptor . The FRET efficiency is then obtained as , and the FRET rate is obtained as .
FRET analysis based on acceptor fluorescence bursts
For every detected fluorescence burst above the background noise, the number of detected photons in the acceptor channel and in the donor channel are recorded. Conceptually, these numbers are used to estimate the FRET efficiency as the ratio of acceptor emission events over all acceptor and donor events. Practically, several additional effects have to be taken into account to compensate for the direct excitation of the acceptor by the laser light, donor emission crosstalk into the acceptor channel, and differences in the quantum yields and detection efficiencies of the donor and acceptor emission. Using the commercial software Symphotime 64 (Picoquant GmbH), we apply the formula:
| (1) |
is the crosstalk parameter defined as the ratio of donor-only fluorescence falling into the acceptor detection channel as compared to the donor-only signal detected in the donor channel. For all our measurements, is fixed to a value of 0.17; we verified that is not affected by the nanoaperture. is the compensation parameter for the direct excitation of the acceptor dye by the laser light. This parameter was carefully measured for every nanoaperture by recording the average number of detected photons per burst when only the acceptor dye is present, and compensating for the slight differences of concentrations between the experiments (we use fluorescence correlation spectroscopy FCS to estimate the number of detected molecules and the molecular concentration in each experimental run, see Supplementary Information). Lastly, accounts for the differences in quantum yields ( and ) and fluorescence detection efficiencies ( and ) between the acceptor and donor. For the confocal reference and the nanoapertures, we estimate in the case of our setup. From the measurement of the FRET efficiency from fluorescence bursts, we deduce the FRET rate as where is the donor-only decay rate obtained from time-correlated lifetime measurements.
Supporting Information: Fluorescence correlation spectroscopy analysis
Fluorescence correlation spectroscopy (FCS) is a versatile method to analyze the fluorescence time trace from a single molecule diffusing in solution, and quantify the number of molecules contributing to the detected fluorescence signal and their mean translational diffusion time [47, 48]. FCS is based on the statistical analysis of the temporal fluctuations affecting the fluorescence intensity by computing the second order correlation of the fluorescence intensity time trace , where is the time-dependent fluorescence signal, the delay (lag) time, and stands for time averaging. Analysis of the correlation function is based on a three dimensional Brownian diffusion model [47, 48]:
| (2) |
where is the total number of molecules, the total signal, the background noise, the amplitude of the dark state population, the dark state blinking time, the mean diffusion time and the ratio of transversal to axial dimensions of the analysis volume, which we set to for the nanoapertures and for the open solution reference.[49]. The background noise originates mainly from the back-reflected laser light and from gold autofluorescence. At 20 W excitation power, it is typically below 1 kHz, which appears negligible as compared to the fluorescence count rates per molecule in the nanoapertures. As a consequence of the stochastic nature of the FCS technique, all the presented fluorescence data are spatially averaged over all the possible molecule orientations and positions inside the detection volume.
Figure 6 presents typical FCS correlation data recorded in confocal diffraction-limited mode and in a 160 nm gold nanoaperture. The diffusion time reduction in the nanoaperture validates the absence of DNA binding to the gold surfaces in our case. The same correlation amplitude found in the donor and acceptor channel validates the fluorophore pair labeling of the DNA and the optical alignment.
Supporting Information: Fluorescence enhancement factors
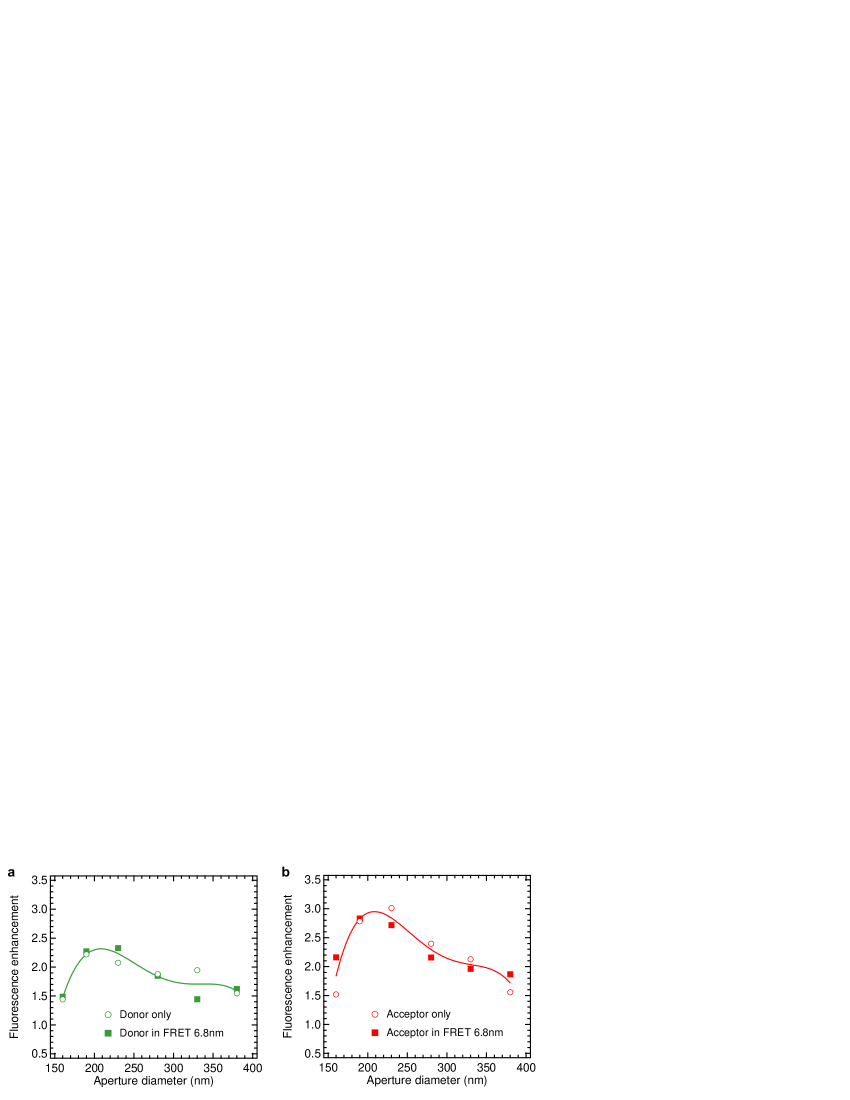
We normalize the average value of the fluorescence intensity by the average number of molecules (deduced by FCS) to compute the fluorescence count rate per molecule . This information is then used to compare to the count rate per molecule found for the confocal reference, and estimate the fluorescence enhancement factor as function of the aperture diameter (Fig. 7). Comparable fluorescence enhancement factors are found for the donor and the acceptor emission. This demonstrates the broadband spectral response of the nanoapertures.
Supporting Information: Fluorescence decay traces and lifetimes
Figure 8a-d display the time-correlated fluorescence decay traces for the different samples as function of the nanoaperture diameter. The fluorescence lifetimes extracted from the single exponential fits reconvoluted by the instrument response function are summarized in Fig. 8e,f. A similar lifetime reduction is obtained for the donor-only and the acceptor-only, showing that the nanoaperture response is broad spectrally and the LDOS is affected similarly at the donor emission and acceptor emission wavelengths. Moreover, a clear reduction of the donor fluorescence lifetime is observed for all nanoapertures as the donor-acceptor distance is reduced.
Supporting Information: FRET rates and efficiencies for large D-A separations
At large donor-acceptor separations, the relatively weak FRET rates and efficiencies are difficult to visualize on the same vertical range as the results for the short 3.4 nm D-A separations (Fig. 4a,b of the main document). Figure 9 thus focus on the FRET rates and efficiencies for 10.2 and 13.6 nm D-A separations. The data is identical to Fig. 4a,b of the main document, only the vertical range is changed.
References
- [1] Kühlbrandt W, & Wang DN. Three-dimensional structure of plant light-harvesting complex determined by electron crystallography. Nature 350, 130-134 (1991).
- [2] van Grondelle, R., Dekker, J. P., Gillbro, T., & Sundström, V. Energy transfer and trapping in photosynthesis. Biochim. Biophys. Acta Bioenerg. 1187, 1-65 (1994).
- [3] Hildner R, Brinks D, Nieder JB, Cogdell RJ & van Hulst NF. Quantum coherent energy transfer over varying pathways in single light-harvesting complexes. Science 340, 1448-1451 (2013).
- [4] Farrell, D.J. & Ekins-Daukes N.J. Photovoltaic technology: Relay dye boosts efficiency. Nat. Photon. 3, 373-374 (2009).
- [5] Shankar, K., Feng, X. & Grimes, C. A. Enhanced harvesting of red photons in nanowire solar cells: Evidence of resonance energy transfer. ACS Nano 3, 788-794 (2009).
- [6] Baldo, M.A., Thompson, M.E. & Forrest S.R. High-efficiency fluorescent organic light-emitting devices using a phosphorescent sensitizer. Nature 403, 750-753 (2000).
- [7] Medintz, I. L., Clapp, A. R., Mattoussi, H., Goldman, E. R., Fisher, B., & Mauro, J. M.. Self-assembled nanoscale biosensors based on quantum dot FRET donors. Nat. Mater. 2, 630-638 (2003).
- [8] Förster, T. Zwischenmolekulare energiewanderung und fluoreszenz. Ann. Phys. 437, 55-75 (1948).
- [9] Roy, R., Hohng, S. & Ha, T. A practical guide to single-molecule FRET. Nat. Methods 5, 507-516 (2008).
- [10] Weiss S. Measuring conformational dynamics of biomolecules by single molecule fluorescence spectroscopy. Nat. Struct. Biol.7, 724-729 (2000).
- [11] Schuler, B. & Eaton, W.A. Protein folding studied by single-molecule FRET. Curr. Opin. Struct. Biol. 18, 16-26 (2008).
- [12] Purcell, E. M. Spontaneous emission probabilities at radio frequencies. Phys. Rev. 69, 681 (1946).
- [13] Drexhage, K. H. Influence of a dielectric interface on fluorescence decay time. J. Lumin. 1, 693-701 (1970).
- [14] Novotny, L. & Hecht, B. Principles of Nano-Optics. Cambridge University Press, Cambridge (2006).
- [15] Barnes, W. L. Fluorescence near interfaces: the role of photonic mode density. J. Mod. Opt. 45, 661-699 (1998).
- [16] Goy, P., Raimond, J.M., Gross, M. & Haroche, S. Observation of Cavity-Enhanced Single-Atom Spontaneous Emission. Phys. Rev. Lett. 50, 1903-1906 (1983).
- [17] Yablonovitch, E. Inhibited spontaneous emission in solid-state physics and electronics. Phys. Rev. Lett. 58, 2059-2062 (1987).
- [18] Lodahl, P., Van Driel, A. F., Nikolaev, I. S., Irman, A., Overgaag, K., Vanmaekelbergh, D., & Vos, W. L. Controlling the dynamics of spontaneous emission from quantum dots by photonic crystals. Nature 430, 654-657 (2004).
- [19] Novotny, L. & van Hulst, N. Antennas for light. Nature Photon. 5, 83-90 (2011).
- [20] Kinkhabwala, A., Yu, Z. F., Fan, S. H., Avlasevich, Y., Mullen, K. & Moerner, W. E. Large single-molecule fluorescence enhancements produced by a bowtie nanoantenna. Nature Photon. 3, 654-657 (2009).
- [21] Hopmeier, M., Guss, W., Deussen, M., Göbel, E.O. & Mahrt, R.F. Enhanced dipole-dipole interaction in a polymer microcavity. Phys. Rev. Lett. 82, 4118-4121 (1999).
- [22] Andrew, P. & Barnes, W.L. Förster energy transfer in an optical microcavity. Science 290, 785-788 (2000).
- [23] Finlayson, C. E., Ginger, D. S. & Greenham, N. C. Enhanced Förster energy transfer in organic/inorganic bilayer optical microcavities. Chem. Phys. Lett. 338, 83-87 (2001).
- [24] Nakamura, T., Fujii, M., Imakita, K. & Hayashi, S. Modification of energy transfer from Si nanocrystals to Er3+ near a Au thin film. Phys. Rev. B 72, 235412 (2005).
- [25] Dung, H. T., Knöll, L. & Welsch, D. G. Intermolecular energy transfer in the presence of dispersing and absorbing media. Phys. Rev. A 65, 043813 (2002).
- [26] Colas des Francs, G., Girard, C. & Martin, O. J. Fluorescence resonant energy transfer in the optical near field. Phys. Rev. A 67, 053805 (2003).
- [27] Govorov, A. O., Lee, J. & Kotov, N. A. Theory of plasmon-enhanced Förster energy transfer in optically excited semiconductor and metal nanoparticles. Phys. Rev. B 76, 125308 (2007).
- [28] Vincent, R. & Carminati, R. Magneto-optical control of Förster energy transfer. Phys. Rev. B 83, 165426 (2011).
- [29] Enderlein, J. Modification of Förster resonance energy transfer efficiency at interface. Int. J. Mol. Sci. 13, 15227-15240 (2012).
- [30] Nakamura, T., Fujii, M., Miura, S., Inui, M. & Hayashi, S. Enhancement and suppression of energy transfer from Si nanocrystals to Er ions through a control of the photonic mode density. Phys. Rev. B 74, 045302 (2006).
- [31] de Dood, M. J. A., Knoester, J., Tip, A. & Polman, A. Förster transfer and the local optical density of states in erbium-doped silica. Phys. Rev. B 71, 115102 (2005).
- [32] Blum, C., Zijlstra, N., Lagendijk, A., Wubs, M., Mosk, A. P., Subramaniam, V. & Vos, W. L. Nanophotonic control of the Förster resonance energy transfer efficiency. Phys. Rev. Lett. 109, 203601 (2012).
- [33] Zhang, J., Fu, Y., Chowdhury, M. H., & Lakowicz, J. R. Enhanced Förster resonance energy transfer on single metal particle. 2. dependence on donor-acceptor separation distance, particle size, and distance from metal surface. J. Phys. Chem. C 111, 11784-11792 (2007).
- [34] Fore, S., Yuen, Y., Hesselink, L., & Huser, T. Pulsed-interleaved excitation FRET measurements on single duplex DNA molecules inside C-shaped nanoapertures. Nano Lett. 7, 1749-1756 (2007).
- [35] Kolaric, B., Baert, K., Van der Auweraer, M., Vallée, R. A., and, & Clays, K. Controlling the fluorescence resonant energy transfer by photonic crystal band gap engineering. Chem. Mater. 19, 5547-5552 (2007).
- [36] Reil, F., Hohenester, U., Krenn, J. R., & Leitner, A. Förster-type resonant energy transfer influenced by metal nanoparticles. Nano Lett. 8, 4128-4133 (2008).
- [37] Yang, Z., Zhou, X., Huang, X., Zhou, J., Yang, G., Xie, Q.,Sun, L. & Li, B. Energy transfer between fluorescent dyes in photonic crystals. Opt. Lett. 33, 1963-1965 (2008).
- [38] Komarala, V. K., Bradley, A. L., Rakovich, Y. P., Byrne, S. J., Gunko, Y. K., & Rogach, A. L. Surface plasmon enhanced Förster resonance energy transfer between the CdTe quantum dots. Appl. Phys. Lett. 93, 123102-123102 (2008).
- [39] Lunz, M., Gerard, V. A., Gun ko, Y. K., Lesnyak, V., Gaponik, N., Susha, A. S., Rogach, A.L. & Bradley, A. L. Surface plasmon enhanced energy transfer between donor and acceptor CdTe nanocrystal quantum dot monolayers. Nano Lett. 11, 3341-3345 (2011).
- [40] Zhang, X., Marocico, C. A., Lunz, M., Gerard, V. A., Gun ko, Y. K., Lesnyak, V., Gaponik, N., Susha, A.S., Rogach, A.L. & Bradley, A. L. Wavelength, Concentration, and distance dependence of nonradiative energy transfer to a plane of gold nanoparticles. ACS Nano 6, 9283-9290 (2012).
- [41] Rigneault, H., Capoulade, J., Dintinger, J., Wenger, J., Bonod, N., Popov, E., Ebbesen, T. W. & Lenne, P. F. Enhancement of single-molecule fluorescence detection in subwavelength apertures. Phys. Rev. Lett. 95, 117401 (2005).
- [42] Wenger, J., Gérard, D., Bonod, N., Popov, E., Rigneault, H., Dintinger, J., Mahboub, O. & Ebbesen, T.W. Emission and excitation contributions to enhanced single molecule fluorescence by gold nanometric apertures. Opt. Express 16, 3008-3020 (2008).
- [43] Langguth, L., Punj, D., Wenger, J. & Koenderink, A.F. Plasmonic Band Structure Controls Single-Molecule Fluorescence. ACS Nano 7, 8840-8848 (2013).
- [44] Deniz, A.A., Dahan, M., Grunwell, J.R., Ha, T., Faulhaber, A.E., Chemla, D.S., Weiss, S. & Schultz P.G. Single-pair fluorescence resonance energy transfer on freely diffusing molecules: observation of Förster distance dependence and subpopulations. Proc. Natl. Acad. Sci. USA 96, 3670-3675 (1999).
- [45] Levene, M. J., Korlach, J., Turner, S. W., Foquet, M., Craighead, H. G. & Webb, W. W. Zero-mode waveguides for single-molecule analysis at high concentrations. Science 299, 682-686 (2003).
- [46] Holzmeister, P., Acuna, G.P., Grohmann, D. & Tinnefeld, P. Breaking the concentration limit of optical single-molecule detection. Chem. Soc. Rev., DOI: 10.1039/c3cs60207a
- [47] Maiti, S., Haupts, U. & Webb, W.W. Fluorescence correlation spectroscopy: diagnostics for sparse molecules. Proc. Nat. Acad. Sci. USA 94, 11753-11757 (1997).
- [48] Zander, C., Enderlein J. & Keller, R. A. Single-Molecule Detection in Solution - Methods and Applications, VCH-Wiley, Berlin/New York, 2002.
- [49] Gérard, D.; Wenger, J.; Bonod, N.; Popov, E.; Rigneault, H.; Mahdavi, F.; Blair, S.; Dintinger, J. & Ebbesen, T.W. Nanoaperture-enhanced fluorescence: towards higher detection rates with plasmonic metals. Phys. Rev. B 77, 045413 (2008).
Acknowledgments
We thank Thomas W. Ebbesen for stimulating discussions and support and Eloïse Devaux for help with the FIB. The research leading to these results has received funding from the European Commission’s Seventh Framework Programme (FP7-ICT-2011-7) under grant agreement ERC StG 278242 (ExtendFRET). PG is on leave from Institute for Space Sciences, Bucharest-Măgurele RO-077125, Romania.