Short time scale spectral variability in the A0 supergiant HD 92207 and the importance of line profile variations for the interpretation of FORS 2 spectropolarimetric observations††thanks: Based on data obtained at the European Southern Observatory (ESO Prgs. 078.D-0330(A), 87.D-0049(A) and 088.D-0425(A)).
Abstract
Our recent search for the presence of a magnetic field in the bright early A-type supergiant HD 92207 using FORS 2 in spectropolarimetric mode indicated the presence of a longitudinal magnetic field of the order of a few hundred Gauss. Assuming the ideal case of a non-variable star, this discovery has recently been questioned in one work trying to demonstrate the importance of non-photon noise in FORS 2 observations. The assumption of non-variability of HD 92207 can, however, not be held since substantial profile variations of diverse lines on a time scale of minutes or maybe even a fraction of a minute are detected in FORS 2 spectra. The presence of short-term spectral variability in blue supergiants, which are considered as type II supernova progenitors, has not been a subject of systematic studies before and is critical for the current theoretical understanding of their physics. Given the detected short term variability, the question of the presence of a magnetic field cannot be answered without proper modeling of the impact of such a variability on the measurements of the magnetic field. Since the short-term periodicity does not fit into the currently known domain of non-radially pulsating supergiants, its confirmation is of great importance for models of stellar evolution.
keywords:
stars: early-type – techniques: polarimetric — stars: individual: HD 92207 – stars: atmospheres — stars: magnetic fields — stars: variables: general1 Introduction
Recent developments in observational techniques and theories reveal the potential significance of magnetic fields for stellar structure, evolution, and circumstellar environment. At present, the distribution of magnetic field strengths in massive stars from the zero-age main sequence to more evolved stages, which would shed light on the origin of the magnetic field, has not been systematically studied. Our recent search for the presence of a magnetic field in the visually brightest early A-type supergiant HD 92207, using FORS 2 in spectropolarimetric mode, resulted in the discovery of a rather strong mean longitudinal magnetic field of the order of a few hundred Gauss (Hubrig et al., 2012).
The photometrically and spectroscopically variable bright A0 supergiant star HD 92207 is of particular interest for spectropolarimetric studies. It has been monitored for several years in the -Strömgren system by Sterken (1983) and spectroscopically by Kaufer et al. (1996, 1997), who found cyclical changes of the brightness and substantial profile changes for metal lines and at H, and suggested that the observed photometric and H line variations are the result of a corotating structure in the wind, which they considered to be in the star’s equatorial plane. Furthermore, their study of the line profile variations revealed clear pulsation-like structures, indicating the presence of non-radial pulsations (NRPs) with a period of 27 days, while the stellar rotation period is of the order of several months.
Ignace et al. (2009) measured linear polarisation in the spectra of this star on seven different nights, spanning approximately three months in time. For the continuum polarisation, the spiral-shaped wind density enhancement in the equatorial plane of the star suggested by Kaufer et al. (1996) was explored. Importantly, the authors reported that the polarisation across the H line on any given night is typically different from the degree and position angle of the polarisation in the continuum. These night-to-night variations in the H polarisation are hard to understand in terms of the spiral structure that was considered for the continuum polarisation.
Recently, Bagnulo et al. (2013) claimed that the discovery of a longitudinal magnetic field in FORS 2 data is spurious due to non-photon noise, more specifically due to small offsets in the parallel and perpendicular beams, or non-predictable instrument instabilities or flexures, evidenced by changes in the individual spectra. In all considerations of possible culprits playing a role in the magnetic field determination, Bagnulo et al. explicitly exclude the role of intrinsic spectral variations, assuming the ideal case of a non-variable star, referring to HARPSpol observations obtained in 2013.
In this study, we present a careful inspection of the FORS 2 spectra used for the magnetic field determination in HD 92207 in our previous work. We report on the detection of short-term variability in this object, implying that the assumption of an ideal case of a non-variable star cannot be held.
2 The presence of short-term spectral variations in the A0 supergiant HD 92207
| MJD | RV | S/N | |
|---|---|---|---|
| [km/s] | |||
| 55688.168 | 38.19 | 9.50 | 2020 |
| 55936.341 | 68.86 | 9.62 | 1942 |
| 56018.224 | 12.36 | 8.07 | 1783 |
The FORS 2 spectropolarimetric observations on three different epochs discussed in this work have been used by Hubrig et al. (2012) for a search of the presence of a magnetic field in the bright A0 supergiant HD 92207. The dates of observations, the radial velocities measured in the obtained spectra, and their S/N are presented in Table 1.
Apart from magnetic field measurements, Hubrig et al. (2012) studied the spectrum variability over the last seven years, adding the seven FORS 1 observations obtained in 2007, one FEROS spectrum () observed in 2004 on La Silla (retrieved from the ESO archive), and one EBASIM spectrum () obtained in 2006 in CASLEO in Argentina. Distinct line profile variations of all spectral lines, which are caused by non-radial pulsations (NRPs) with a period of 27 days (Kaufer et al., 1997), have been detected in all observations. Furthermore, Hubrig et al. (2012) have reported that the line profiles of the elements Fe, Cr, and Si show very similar behaviour. The radial velocities determined from the \textHe i 5876 line are only slightly higher than those for the metal lines, while the Balmer line H shows a velocity that is systematically lower than the values obtained from the metal lines.
Assuming the presence of an effect of the beam-swapping technique on wavelength shifts and the possible occurrence of offsets due to a sporadic instability of the instrument, Bagnulo et al. (2013) argue that no magnetic field is present in the atmosphere of HD 92207, calling the reader’s attention to the important role of non-photon noise in the spectropolarimetric observations with FORS 2. In all considerations of possible culprits playing a role in the magnetic field determination, Bagnulo et al. assume the ideal case of a non-variable star referring to HARPSpol observations of HD 92207 obtained in 2013. These observations have exposure times between 30 and 50 min and have been used to construct LSD profiles, which combine hundreds of spectral lines of various elements under the assumption that all spectral lines are identical in shape and can be described by a scaled mean profile. So far, the published analyses (Bagnulo et al., 2013; Hubrig et al., 2012) of spectropolarimetric observations of HD 92207, either with HARPS or FORS, have not taken into account the effect of short-term line variability. Also the current analysis is not able to properly address this variability.
A detailed description of the assessment of the longitudinal magnetic field measurements using FORS 1/2 is presented in our previous work (e.g. Hubrig et al. 2004a, b, and references therein). The mean longitudinal magnetic field, , is derived using
| (1) |
where is the Stokes parameter that measures the circular polarisation, is the intensity in the unpolarised spectrum, is the effective Landé factor, is the electron charge, is the wavelength, the electron mass, the speed of light, is the derivative of Stokes , and is the mean longitudinal magnetic field.
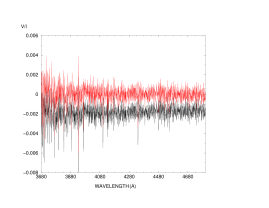
This field is usually measured in two ways: using only the absorption hydrogen Balmer lines or using the entire spectrum including all available absorption lines in spectra that were rectified. The impact of rectification is usually very weak: for HD 92207 the difference between the mean longitudinal magnetic field obtained in rectified spectra and that obtained in non-rectified spectra is only about 15 G. Even for the highly linearly polarized object Cyg X–1, Bochkarev & Karitskaya (2012) report only a difference between the rectified and the non-rectified Stokes spectra of up to 20 G in the FORS 1 observations. The rectified and non-rectified spectra of HD 92207 observed on the first epoch in May 2011 are presented in Fig. 1.
Two spectral regions were excluded from the measurements of Hubrig et al. (2012): one is related to the spectral region containing the H line because the high-resolution spectra of this star show a contamination of this line by emission. The second spectral region excluded from the measurements is the region 3957–3975 Å, where H is blended with the \textCa ii H line. In addition, an inspection of the spectra obtained with the blue optimised chip reveals the presence of instrumental artifacts at wavelengths close to the \textCa ii K and H lines.
To minimise the cross-talk effect, a sequence of subexposures at the retarder position angles , , , etc. is usually executed during observations and the values are calculated using:
| (2) |
where and indicate the position angle of the retarder waveplate and and are the ordinary and extraordinary beams, respectively. In the calculations, a Landé factor for the hydrogen lines and for the metal lines is assumed. For the first observational epoch, Hubrig et al. (2012) collected eight subexposures, each one with an exposure time of three seconds, recorded at time intervals between 1.6–2.1 minutes, while for each the second and the third epochs the collected number of subexposures was twelve.
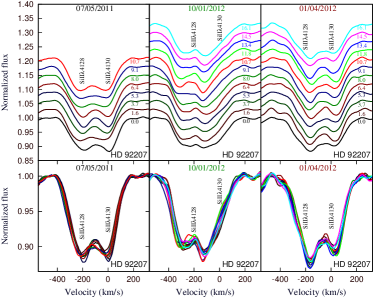
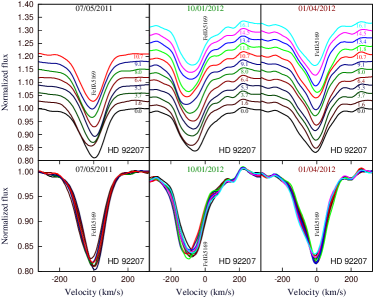
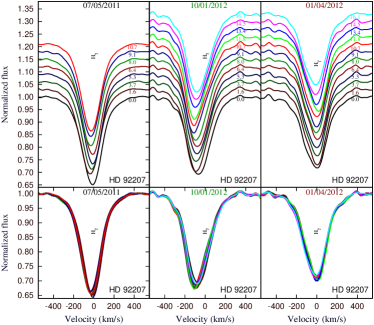
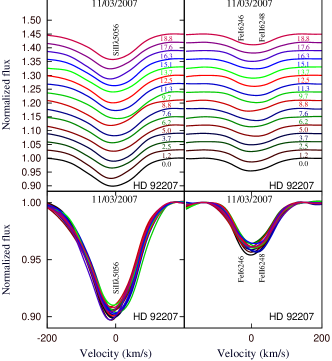
The inspection of the FORS 2 spectra obtained in each individual subexposure reveals distinct line profile variations not only between the different observation epochs, but also on a time scale of a couple of minutes. Along with different radial velocity shifts detected for lines belonging to different elements, we also detect notable changes in line intensities taking place on very short time scales. In Figs. 2, 3, and 4, we present the clearly visible variations of line profiles belonging to different elements in individual subexposures reaching up to 3% in intensities and up to 30 km s-1 in radial velocities. Notably, the H line profile presented in Fig. 4 exhibits intensity and radial velocity variations in individual subexposures at a lower level compared to the metal lines. The short-term spectral variability of HD 92207 is also detected in earlier spectropolarimetric observations carried out with FORS 1 in 2007. These observation were obtained with exposure times of about 5 s to study linear polarization across the H profile, to associate the detected changes with a corotating structure (Ignace et al., 2009). As in observations obtained with FORS 2, conspicuous line profile variations with similar amplitudes in radial velocities and line intensities are clearly visible in the FORS 1 spectra. As an example, we present in Fig. 5 the variability of the Si and Fe line profiles.
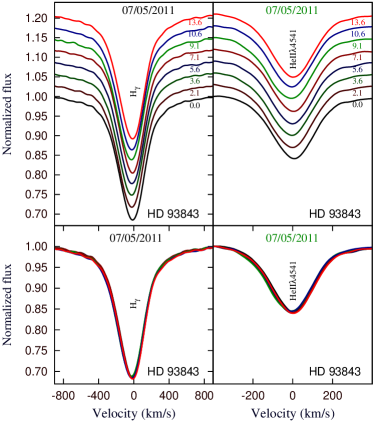
Immediately after completing the observations for HD 92207 with FORS 2 in visitor mode in 2011 May, Hubrig et al. (2012) observed close to the position of HD 92207 the hot massive star HD 93843 at the same air mass and with exposure times of 30 s. As is shown in Fig. 6, opposite to the spectral behaviour of HD 92207, no significant variability in intensity, i.e. only intensity variations below 1% and radial velocities below 10 km s-1 have been detected in the individual subexposures obtained for this star.
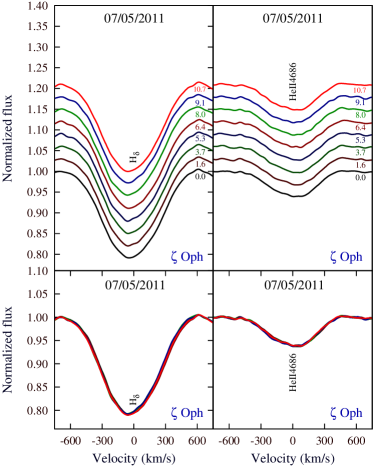
Furthermore, we inspected in addition the behaviour of line profiles in the FORS spectra of another bright star, Oph, observed with an exposure time of 0.2 s in the same night in the same weather conditions just 1.5 h after the observations of HD 92207. Also in these observations no significant variability, i.e. only intensity variations below 1% and radial velocities below 10 km s-1, have been detected in the individual subexposures. We display the behaviour of the H and \textHe ii 4686 lines in the FORS 2 spectra of Oph in each subexposure in Fig. 7.
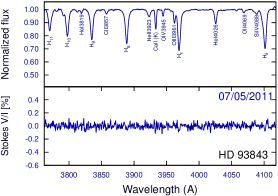
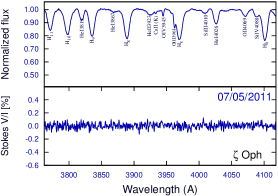
The absence of strong spectral variability in HD 93843 and Oph on similar time scales suggests that the spectral variations of HD 92207 are intrinsic and are not related to an imperfect performance of FORS 2. If non-photon noise was indeed present in the FORS 2 spectropolarimetric observations of that night and the short term variability detected in the spectral lines of HD 92207 had no effect on the measurement of the magnetic field, we would correspondingly expect the detection of a weak magnetic field in HD 93843 and Oph.
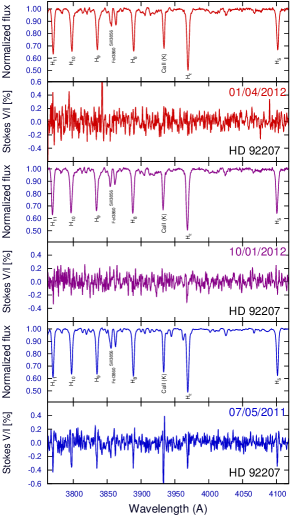
In Fig. 8, we present Stokes and spectra of HD 92207 in a spectral region containing low-number Balmer lines and the Ca doublet lines at three epochs. As can be seen, the Zeeman features corresponding to several spectral lines in the lowest panel do not exhibit the classical “S” shape, but instead show a deep negative polarization trough without the equivalent positive polarization spike. While Bagnulo et al. (2013) explain those by various offsets due to instrumental misbehaviour, they are in fact very likely resulting from the spectral variations in this object. However, as we show in Fig. 9, no similar Zeeman features are observed in the spectra of HD 93843 and Oph, with measured mean longitudinal magnetic fields G, and G, respectively (Hubrig et al., 2013). These measurements are compatible with zero. Therefore, we conclude that the effects discussed by Bagnulo et al. (2013) are of no importance for the spectropolarimetric observations of HD 92207 and that the discovered line shifts in the polarimetric spectra of HD 92207 are simply explained by the variability of this star on a short time scale and which can not be found in HD 98343 and Oph.
3 Reassessing our earlier magnetic field determination
| MJD | |||||
|---|---|---|---|---|---|
| [G] | [G] | ||||
| 55688.168 | 355 | 76 | 0.80 | 355 | 99 |
| 55936.341 | 147 | 62 | 1.17 | 147 | 62 |
| 56018.224 | 60 | 76 | 1.07 | 60 | 81 |
We have reassessed our magnetic field determinations, which we present in Table 2. The first column gives the modified Julian date at the middle of the exposure and in the second column, we list the magnetic field and its error determined by the usual linear regression method. In the following two columns we first show the value, which is an indicator for the quality of the assumed errors and the validity of Eq. 1, and the magnetic field and its error determined from our Monte Carlo bootstrapping tests. These latter two indicators are described in detail below. The longitudinal magnetic field was for all three epochs determined from data in the wavelength regions 3250–3957 Å and 3975–4855 Å, i.e. we are not using H, H, or \textCa ii H. In the measurements of Hubrig et al. (2012), we also used the wavelength region beyond H, which explains the now larger errors.
Before the linear regression, we performed a rectification of the spectra. This step was also performed in Hubrig et al. (2012), which should be obvious from Fig. 1 in that paper. For the rectification, we fit and subtract a line to the data. This is somewhat similar to one of the two methods proposed by Bagnulo et al. (2012), who fit a “smooth function”, which we assume is a low order polynomial. However, we do not see the need for a higher order than a linear fit. We also would like to note that only the slope of this line is relevant for the determination of the longitudinal magnetic field. As already discussed in Sect. 2, the influence of the rectification on the magnetic field determination is well within the error bars.
We are interpolating all FORS 2 spectra, leading to a spectral bin size of 0.1 Å, compared to the natural FORS 2 spectral bin size of 0.75 Å. This way, we are generating new data, which can not be treated as individual measurements. Thus, we have to take a factor of into account when calculating the errors both for the standard linear regression and in the Monte Carlo bootstrapping analysis. This factor is not relevant for the determination of .
In the analysis of high-resolution spectropolarimetric observations, null polarisation spectra are frequently calculated to assure that no instrumental or data-reduction effects are present in the measurements of magnetic fields. They are calculated by combining the sub-exposures in such a way that the polarisation cancels out. Our experience with the calculation of null profiles for FORS 2 polarimetric observations shows that they cannot be considered as reliable indicators for the presence or non-presence of magnetic fields since the null profiles obtained by sorting the frames in different ways are different. Also, signals in the null profile might be the result of combining data with significantly different signal-to-noise (Schöller et al., in prep.).
Bagnulo et al. (2012) suggest to calculate an “external” error bar for the magnetic field values determined in the linear regression by multiplying the internal error with the factor , where is the number of degrees of freedom of the system, i.e. the number of spectral bins minus 2, and is calculated from
| (3) |
where the sum spans over all spectral bins , and respectively are the longitudinal magnetic field and the instrumental polarisation determined from the previous linear regression, is the left hand term of Eq. 1 in spectral bin , and is the factor in front of in the right hand term of Eq. 1 in spectral bin .
For the three data sets, we calculate the factor presented in Table 2. For the first epoch the error seems to be very reasonable, while for the other two epochs we probably underestimate the errors by 17% and 7%, respectively.
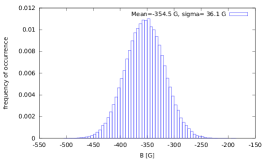
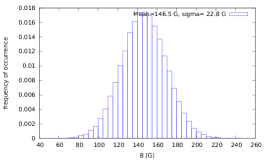
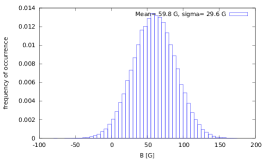
Following the suggestion by Rivinius et al. (2010), we also carried out Monte Carlo bootstrapping tests. These are most often applied with the purpose of deriving robust estimates of standard errors. In these tests, we generate 250 000 samples that have the same size as the original data set (15 866 spectral bins) and analyse the distribution of the determined from all these newly generated data sets. The resulting distributions, which we present in Fig. 10, all show smooth Gaussian profiles.
From this reassessment, we conclude that our data reduction does not show any flaw. However, given the detected short term variability, the question of the presence of a magnetic field cannot be answered without proper modeling of the impact of such a variability on the measurements of the magnetic field. High resolution spectropolarimetric observations obtained on a short time scale are urgently needed before any conclusion can be drawn.
4 Discussion
The main conclusion by Bagnulo et al. (2013) on the discrepancies between their and our earlier determination of the longitudinal magnetic field seems to be a wrong relative wavelength calibration on our side, especially due to the impact of wavelength shifts when rotating the retarder waveplate. While the assessment of a potential influence of a wrong relative wavelength calibration seems to be correct, it is not plausible that this is actually an issue for the data from the first epoch, where the longitudinal magnetic field is detected. Directly after the observations of HD 92207, we observed the hot massive star HD 93843 close to the position of HD 92207, at the same air mass and with similar short exposure times. We do not find any distinct Zeeman features for HD 93843 and the determined longitudinal magnetic field is compatible with zero. HD 93843 also does not show strong spectral variability on a short time scale, ruling out that spectral variability is introduced due to imperfections within FORS 2. The same results are obtained from observations of Oph, with an exposure time of 0.2 s. In the same night, we also observed the two Of?p stars HD 148937 and CPD 28 2561 (Hubrig et al., 2013). The measurement of a magnetic field of G in HD 148937 using the same wavelength calibration is perfectly in line with earlier measurements by ourselves (Hubrig et al., 2011a, 2013) and Wade et al. (2012), following the 7.032 d period determined by Nazé et al. (2010). For CPD 28 2561, we find a magnetic field of G, which is supported by Petit et al. (2013), who give a polar field strength larger than 1.7 kG for CPD 28 2561. All these measurements indicate that there is nothing wrong with the wavelength calibration for that night. This still leaves room for a spontaneous instability in the FORS 2 wavelength calibration that affects the observations of HD 92207 but no other object. While we can not rule this out, there is no evidence that could support this speculation in this or any other FORS 1/2 data set. Another point raised by Bagnulo et al. (2013) was that we could underestimate our magnetic field errors. We have used the mechanism to estimate the “external” error, as described by Bagnulo et al. (2012) and can conclude that there is also no issue with the data in that respect. We also used the Monte Carlo bootstrapping tests proposed by Rivinius et al. (2010), which indicate that we only slightly understimated our initial errors. We suggest that what Bagnulo et al. (2013) claim to result from non-photon noise, most probably can be traced back to spectral variability of HD 92207 on short time scales.
The available FORS 2 polarimetric spectra clearly show the presence of short-term spectral variability, which was not previously discussed in the literature for any blue supergiant and certainly needs further investigation. In particular, a careful search for periodicity and identification of pulsation modes causing the remarkable changes in the line intensity and position on time scales of the order of minutes are urgently needed. With the current data, it can not be decided, if the variations are of periodic or stochastic nature. In any case, given the size of the supergiant, it is clear that the variability can not be referred to coherent line variations across the entire surface on such short time scales. Obviously, seismic studies are of great importance to constrain physical processes in stars, e.g. differential rotation, mixing, mass loss, etc.. Despite several decades of observational efforts with ground-based photometry and spectroscopy of bright blue supergiants, it is not yet certain what portion of their variability is periodic, or how far they deviate from strict periodicity. On the other hand, in the most recent observational studies of massive stars, evidence is accumulating that some BA supergiants exhibit multiperiodic NRPs. As an example, short-term variability was already identified on a time scale of 1–3 hours (Lefever et al., 2007; Kraus et al., 2012). However, a variability on time scales of the order of minutes has not been detected so far, mostly due to the fact that telescopes with large collecting areas are needed for studies with spectral time sampling of a few minutes.
Clearly, it is not possible to use the low-resolution FORS 2 spectra to model the effect of pulsations on the magnetic field measurements, and the potential of high-resolution spectropolarimetric observations should be used in the search of short-term variations (e.g. Hubrig et al. 2011b). We need to note that due to the proprietary time of one year for ESO observations, we are not yet able to study the spectral variability of this star in the high resolution HARPSpol spectra mentioned in the work of Bagnulo et al. (2013). The question how pulsations affect the magnetic field measurements is not yet solved in spite of the fact that the number of studies of pulsating Cephei and slowly pulsating B (SPB) stars is gradually increasing. Already in 2006, Schnerr et al. discussed the influence of pulsations on the analysis of the magnetic field strength in the Cephei star Eri in MUSICOS spectra and tried to model the signatures found in Stokes and spectra. Although the authors claim that using some modeling they are able to quantitatively establish the influence of pulsations on the magnetic field determination, they still detect profiles in Stokes and that are the result of the combined effects of the pulsations and the inaccuracies in wavelength calibration that were not removed by their imperfect modeling of these effects.
Another important effect in the measurements of magnetic fields in pulsating stars, applying the LSD method to high-resolution polarimetric spectra, is that the line profiles belonging to different elements show different profile shapes and different displacements. The authors usually use essentially all metallic lines and He lines (up to several hundred lines) to calculate a ”mean” LSD line profile, although the behaviour of lines of different elements during the pulsation cycle is frequently different (e.g. Hubrig et al. 2011b).
Blue supergiants are considered as type II supernova progenitors. A careful study of their variability provides important diagnostic means for internal and atmospheric structure. The need for multiple modes to fit to the spectroscopic data sets has already been presented in several works analysing BA supergiants. According to the study of Rigel by Moravveji et al. (2012), periods shorter than about a week can only be caused by the -mechanism if other sources such as spots, variable winds, and propagating shocks can be excluded. The goal of future studies should be to search for the presence of short-term variability and periodicities in bright A0 supergiants with similar stellar parameters. Moreover, since the short-term periodicity does not fit into the currently known domain of non-radially pulsating supergiants, its confirmation is of great importance for the models of stellar evolution.
Acknowledgments
We are grateful to Helge Todt, who provided his Monte Carlo bootstrapping routines.
References
- Bagnulo et al. (2012) Bagnulo S., Landstreet J. D., Fossati L., Kochukhov O., 2012, A&A, 538, A129
- Bagnulo et al. (2013) Bagnulo S., Fossati L., Kochukhov O., Landstreet J. D., 2013, A&A, 559, A103
- Bochkarev & Karitskaya (2012) Bochkarev N. G., Karitskaya E. A., 2012, IAUS, 282, 75
- Hubrig et al. (2004a) Hubrig S., Kurtz D. W., Bagnulo S., Szeifert T., Schöller M., Mathys G., Dziembowski W. A., 2004a, A&A, 415, 661
- Hubrig et al. (2004b) Hubrig S., Szeifert T., Schöller M., Mathys G., Kurtz D. W., 2004b, A&A, 415, 685
- Hubrig et al. (2011a) Hubrig S., Schöller M., Kharchenko N. V., et al., 2011a, A&A, 528, A151
- Hubrig et al. (2011b) Hubrig S., Ilyin I., Briquet M., Schöller M., González J. F., Nuñez N., De Cat P., Morel T., 2011b, A&A, 531, L20
- Hubrig et al. (2012) Hubrig S., Schöller M., Kholtygin A. F., González J. F., Kharchenko N. V., Steffen M., 2012, A&A, 546, L6
- Hubrig et al. (2013) Hubrig S., Schöller M., Ilyin I., et al., 2013, A&A, 551, A33
- Ignace et al. (2009) Ignace R., Hubrig S., Schöller M., 2009, AJ, 137, 3339
- Kaufer et al. (1996) Kaufer A., Stahl O., Wolf B., Gaeng T., Gummersbach C. A., Kovacs J., Mandel H., Szeifert T., 1996, A&A, 305, 887
- Kaufer et al. (1997) Kaufer A., Stahl O., Wolf B., et al., 1997, A&A, 320, 273
- Kraus et al. (2012) Kraus M., Tomić S., Oksala M. E., Smole M., 2012, A&A, 542, L32
- Lefever et al. (2007) Lefever K., Puls J., Aerts C., 2007, A&A, 463, 1093
- Moravveji et al. (2012) Moravveji E., Moya A., Guinan E. F., 2012, ApJ, 749, 74
- Nazé et al. (2010) Nazé Y., Ud-Doula A., Spano M., Rauw G., De Becker M., Walborn N. R., 2010, A&A, 520, A59
- Petit et al. (2013) Petit V., Owocki S. P., Wade G. A., et al., 2013, MNRAS, 429, 398
- Rivinius et al. (2010) Rivinius T., Szeifert T., Barrera L., Townsend R. H. D., Štefl S., Baade D., 2010, MNRAS, 405, L46
- Schnerr et al. (2006) Schnerr R. S., Verdugo E., Henrichs H. F., Neiner C., 2006, A&A, 452, 969
- Sterken (1983) Sterken C., 1983, The ESO Messenger, 33, 10
- Wade et al. (2012) Wade G. A., Grunhut J., Gräfener G., et al., 2012, MNRAS, 419, 2459