Tracking the Complex Absorption in NGC 2110 with Two Suzaku Observations
Abstract
We present spectral analysis of two Suzaku observations of the Seyfert 2 galaxy, NGC 2110. This source has been known to show complex, variable absorption which we study in depth by analyzing these two observations set seven years apart and by comparing to previously analyzed observations with the XMM-Newton and Chandra observatories. We find that there is a relatively stable, full-covering absorber with a column density of cm-2, with an additional patchy absorber that is likely variable in both column density and covering fraction over timescales of years, consistent with clouds in a patchy torus or in the broad line region. We model a soft emission line complex, likely arising from ionized plasma and consistent with previous studies. We find no evidence for reflection from an accretion disk in this source with no contribution from relativistically broadened Fe K line emission nor from a Compton reflection hump.
Subject headings:
Galaxies: active – X-rays: spectra – Galaxies: Individual: NGC 21101. Introduction
X-ray spectroscopy is a valuable tool for studying the nature and geometry of material in and around active galactic nuclei (AGN). The underlying power-law continuum is believed to arise in a hot corona very near the central supermassive black hole. Measuring the slope (photon index) and cutoff energy of this continuum can constrain the temperature of the corona. The Fe K emission line at 6.4 keV is a key diagnostic that is present in nearly all Seyfert AGN. Its width can indicate the distance from the supermassive black hole of the material in which the line is produced and its energy can indicate an origin in neutral or ionized material. Hard X-ray spectra allow study of the Compton reflection hump (see e.g., George & Fabian 1991), a broad emission feature around 20–30 keV which arises only from Compton-thick material (likely the geometrically thin accretion disk or the geometrically thick infrared torus). Soft X-rays can be absorbed by material in the line of sight to the nucleus. Type 2 Seyferts in particular tend to show significant obscuration in the soft X-ray band. Knowing how much material is in the line of sight and the level of ionization can lead to quantifying how much material surrounds the central black hole and at what distance it lies.
Absorption in Seyfert AGN has been observed in a variety of forms. Absorbers can be characterized as cold or warm (ionized), and may be full- or partial-covering. Warm absorbers imprint both discrete absorption features, best observed in the X-rays via gratings, and broader absorption features due to multiple edges in the X-ray band (see e.g., Blustin et al. 2005, Behar et al. 2003). Partial-covering absorbers due to patchy material can be complicated to model since they introduce degeneracies with other modeled broadband components, and can hinder proper determination of the continuum when photon statistics are insufficient and/or the spectral bandpass is too narrow. Modeling partial-covering absorbers can even reduce the (modeled) presence of relativistically-broadened Fe K emission lines (Miller et al. 2008; Patrick et al. 2011). Only with sufficiently broad X-ray coverage can one properly model all the broadband components.
An additional complication is the observation of time-variable absorption in both Seyfert 1’s and 2’s on a wide range of time scales (e.g., hours–days: NGC 1365, Risaliti et al. 2009, Maiolino et al. 2010; months: Rivers et al. 2011; years: NGC 3516, Turner et al. 2011). In some sources this variability has been modeled as absorption by discrete clumps/clouds over a wide range of length scales (gas commensurate with BLR clouds: NGC 3227, Lamer et al. 2003; torus-scale: Cen A, Rivers et al. 2011). Such evidence suggests that accretion flows at many scales may be clumpy or filamentary, rather than uniformly smooth. Additional observational evidence is needed to further constrain the newest generation of models incorporating sub-pc scale and/or clumpy absorbers, including those where the total column density along the line of sight is a viewing-angle-dependent probability (Nenkova et al. 2008).
NGC 2110 is one of the brightest Seyferts in the hard X-ray band to exhibit evidence for partial-covering absorbers. Early observations of NGC 2110 showed significant absorption in the line of sight but with some soft emission below 2 keV, either an extra component associated with the AGN such as leaked/scattered power-law continuum emission, or contamination from spatially extended plasma. While the amount of gross absorption in NGC 2110 has shown significant variability, a factor of three in ten years as seen by HEAO 1, Ginga, and ASCA (Risaliti et al. 2002), recent high quality X-ray spectroscopy has revealed that, in all likelihood, multiple absorption regions exist in this source. Evans et al. (2007) analyzed Chandra and XMM-Newton data, which showed that a simple absorbed power law plus leaked emission was not sufficient to model their spectra. Instead they found that three partial-covering absorbers were a much better description of their data; however due to their lack of coverage above 10 keV they were unable to quantify the Compton reflection hump and therefore could not be completely certain of their continuum modeling. Additionally, detections of lines from ionized species of Fe, Si and O in this source indicated the presence of ionized plasma in the vicinity of the AGN. This could be in the form of a warm absorber, reflection off the ionized inner regions of an accretion disk, or emission from extended ionized plasma.
In order to characterize the soft emission and observe variability in the absorbing complex in NGC 2110, we have analyzed two observations with the Suzaku X-ray observatory, one from 2005 and one seven years later in 2012. In this paper we present the results of this analysis. Section 2 contains details of the data reduction and analysis; Section 3 results of the spectral fitting; and Section 4 a discussion of our conclusions.
2. Data Reduction and Analysis
Suzaku has two pointed instruments, the X-ray Imaging Spectrometer (XIS; Koyama et al. 2007) and the Hard X-ray Detector (HXD; Takahashi et al. 2007). Data were taken beginning 2005-09-16 (OBSID 100024010) and 2012-08-31 (OBSID 707034010). Data were processed with versions 2.1.6.14 (2005) and 2.8.16.34 (2012) of the Suzaku pipeline and recommended screening criteria were applied (see the Suzaku Data Reduction Guide111http://heasarc.gsfc.nasa.gov/docs/suzaku/analysis/abc/abc.html for details). All extractions and analysis were done utilizing HEASOFT v.6.13 and xspec v.12.6.0 (Arnaud et al. 1996).
2.1. XIS Reduction
The XIS is comprised of 4 CCD’s, however XIS2 has been inoperative since 2005 November, when it was likely hit with a micrometeorite (see the Suzaku Data Reduction Guide for details). Three of the CCD’s (XIS0, XIS2 and XIS3) are front-illuminated, maximizing the effective area of the detectors in the Fe K bandpass, while the fourth CCD (XIS1) is back-illuminated (BI), increasing its effective area in the soft X-ray band ( 2 keV).
The XIS events data were taken in 33 and 55 editing modes, which were cleaned and summed to create image files for each XIS. We extracted lightcurves and spectra from a 3 arcsec source region and four 1.5 arcsec background regions. After screening, the good exposure time was 101 ks per XIS for the 2005 observation and 103 ks per XIS for the 2012 observation. The lightcurves did not show significant variability over the course of either observation. We used the FTOOLS XISRMFGEN and XISSIMARFGEN to create the response matrix and ancillary response files, respectively.
Data were ignored above 10 keV where the effective area of the XIS begins to decrease significantly and below 0.5 keV due to time-dependent calibration issues of the instrumental O K edge (Ishisaki et al. 2007). Data were ignored in the ranges 1.5–2.0 keV and 2.3–2.5 keV where there are large calibration uncertainties for the Si K complex and Au M edge arising from the detector’s mirror system. These issues are not fully understood at the time of this writing.
2.2. HXD Reduction
The HXD is comprised of two detectors, the PIN diodes (12–70 keV) and the GSO scintillators (50–600 keV). The PIN and GSO are non-imaging instruments with a 34 square field of view below 100 keV and 4.5° square field of view above 100 keV. The HXD instrument team provides non-X-ray background event files using the calibrated GSO data for the particle background monitor (“tuned background”), yielding instrument backgrounds with 1.5% systematic uncertainty at the 1 level (Fukuzawa et al. 2009). We simulated the Cosmic X-ray Background in xspec using the form of Boldt (1987).
We excluded PIN data below 13 keV for the 2005 observation and 16 keV for the 2012 observation due to thermal noise (Kokubun et al. 2007). GSO data were usable for the 2005 observation only, since the background was lowest during the early parts of the mission, and were included up to 150 keV. Net spectra were extracted and deadtime-corrected for a net exposure times of 81 ks per instrument for the 2005 observation and 96 ks for the 2012 observation.
| Model | Two Absorbers | Three Absorbers | Two Absorbers + Soft Emission | Simultaneous | |||
|---|---|---|---|---|---|---|---|
| Observation | 2005 | 2012 | 2005 | 2012 | 2005 | 2012 | 2005 / 2012 |
| Power Law | |||||||
| 1.6470.005 | 1.6790.005 | 1.6390.003 | 1.6750.004 | 1.6370.003 | 1.6780.004 | 1.6580.005 | |
| F112–10 keV flux is given in units of 10-12 erg cm-2 s-1 | 143.30.3 | 177.70.4 | 143.40.2 | 177.00.3 | 143.30.3 | 177.80.4 | 143.90.2 / 175.40.7 |
| Fe K Line | |||||||
| (keV) | 6.4060.006 | 6.3790.008 | 6.4090.006 | 6.3780.008 | 6.4060.006 | 6.3780.008 | 6.3990.006 |
| (eV) | 38 | 32 (50) | 38 | 45 | 45 | 32 | 32 |
| (10-5 ph cm-2 s-1) | 7.10.4 | 9.70.6 | 7.40.5 | 9.90.7 | 7.20.6 | 9.20.6 | 7.3 |
| (eV) | 463 | 503 | 473 | 524 | 504 | 533 | |
| Absorbers | |||||||
| ( cm-2) | 4.350.05 | 5.740.07 | 4.770.11 | 5.230.08 | 4.420.05 | 5.750.06 | 4.570.06 / 5.270.08 |
| 0.7450.003 | 0.7520.003 | 0.470.01 | 0.660.01 | 0.7530.003 | 0.760.03 | 0.7850.003 / 0.8340.004 | |
| ( cm-2) | 2.990.01 | 3.220.02 | 3.960.02 | 3.910.03 | 2.970.02 | 3.23 | 2.820.02 |
| 1.0 ( 0.99) | 1.0 ( 0.99) | 0.980.01 | 0.980.01 | 1.0 ( 0.99) | 1.0 ( 0.99) | 1.0* | |
| ( cm-2) | 0.270.01 | 0.260.02 | |||||
| 1.0* | 1.0* | ||||||
| Soft Emission (Gaussian) | |||||||
| (keV) | 0.840.02 | 0.890.02 | 0.890.01 | ||||
| (eV) | 190 | 130 | 10010 | ||||
| (10-5 ph cm-2 s-1) | 12.2 | 9.2 | 4.8 0.4 | ||||
| /dof | 1299/694 | 1082/520 | 912/693 | 706/519 | 882/691 | 671/517 | 1674/1197 |
Note. — Best fit parameters for three broadband models including a power-law continuum and Gaussian Fe K line in all models. The soft emission complex is modeled with a phenomenological Gaussian in the Soft Emission Model. The power law flux is unabsorbed. Note that the width of the soft emission Gaussian () does not signify physical broadening but is rather the blend of multiple soft emission lines. The ”*” symbol indicates a frozen parameter.
| Collisionally | (eV) | Norm (10-5) | ||
|---|---|---|---|---|
| Ionized | 2005 | 2012 | 2005 | 2012 |
| APEC | 910 | 97040 | 6.6 | 11.5 |
| Photoionized | Width (/) | Norm (10-5 photons cm-2 s-1) | ||
| (keV) | (eV) | 2005 | 2012 | |
| O VII | 0.56* | 1* | 1.61.0 | 7.1 |
| O VIII | 0.65* | 1* | 1.60.4 | 2.5 |
| Fe L | 0.72* | 1* | 1.10.3 | 1.20.9 |
| O VII RRC | 0.74* | 100* | 2.70.4 | 1.30.8 |
| Fe L | 0.84* | 1* | 0.80.2 | 1.20.5 |
| O VIII RRC | 0.87* | 100* | 3.40.3 | 7.340.5 |
Note. — Best fit parameters for the two absorber fit plus a collisionally ionized plasma (APEC ) or a photoionized plasma (complex of lines and RRC features). Width corresponds to for the Gaussian lines and to for the RRC features (REDGE component in xspec). The ”*” symbol indicates a frozen parameter.
3. Spectral Fitting
All spectral fitting was done in XSPEC utilizing solar abundances of Wilms et al. (2000) and cross-sections from Verner et al. (1996). All fits included absorption by a Galactic column with = 1.62 cm-2 (Kalberla et al. 2005). Uncertainties are listed at the 90% confidence level ( = 2.71 for one interesting parameter).
3.1. The Hard X-ray Bandpass
We began by fitting our data from each observation epoch separately above 3 keV, including the XIS+PIN+GSO for the 2005 observation in the range 3–150 keV and the XIS+PIN for the 2012 observation in the range 3–70 keV. For the 2012 observation we froze the PIN normalization relative to XIS0 at 1.16, the calibrated value (Kokubun et al. 2007). For the 2005 observation, however, this led to poor fit statistics, likely because the background files were generated during the earliest phase of the mission. Therefore we left the PIN normalization as a free parameter for the 2005 observation only, generally getting values of 1.05. Normalization constants (relative to XIS0) were left free for all other XIS’s and were very close to 1.
Each observation was well-fit by a simple absorbed power law plus a narrow Gaussian line around 6.4 keV to model the Fe K emission line (for more details on the Fe K bandpass see Section 3.3). We found best fit parameters of , = 6.97 cm-2 and dof = 471/353. Fitting a reflection spectrum to this interval using the pexrav model in xspec did not yield an improvement in the fit. We found an upper limit to Compton reflection of , assuming an inclination of 60°. Testing for a high energy cutoff in the spectrum with the xspec model highecut yielded a lower limit of keV.
3.2. Broadband Modeling
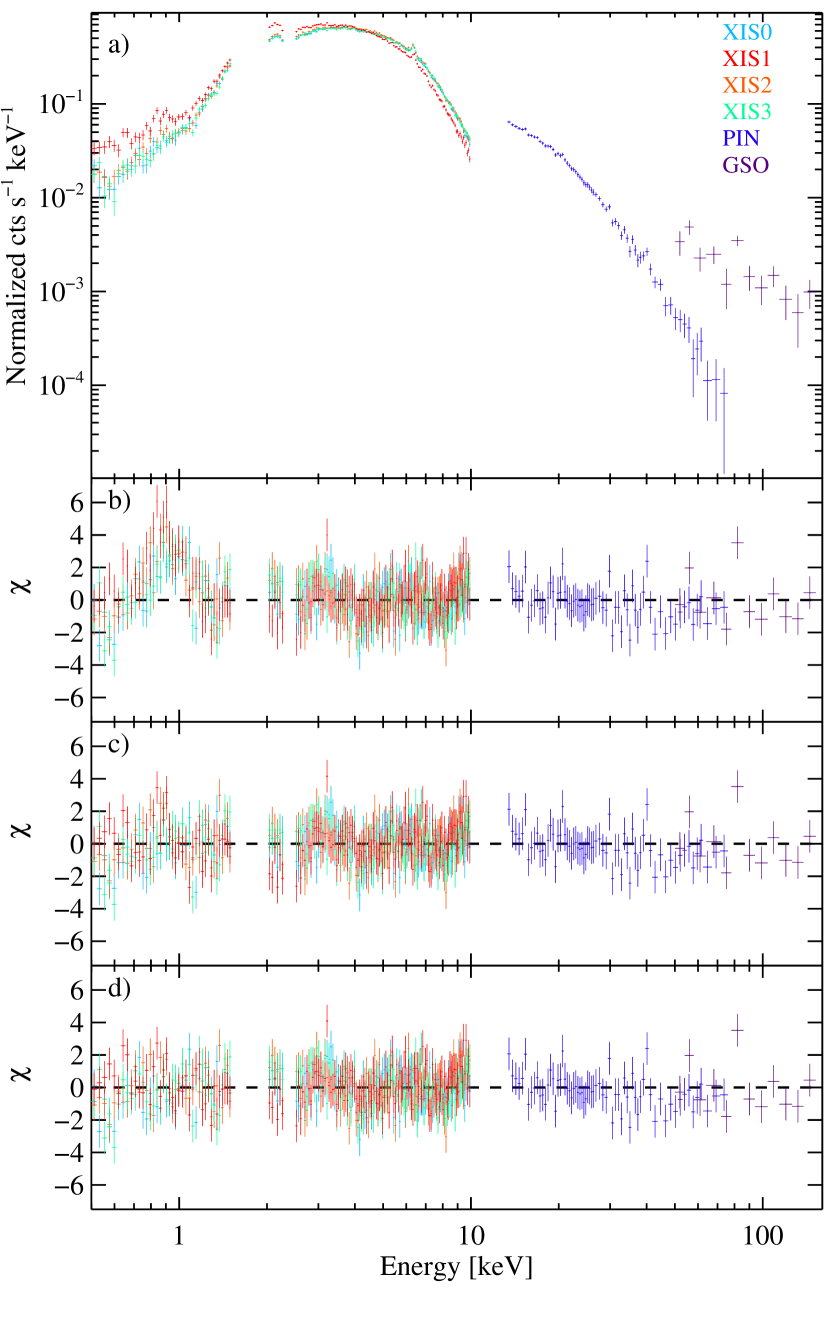
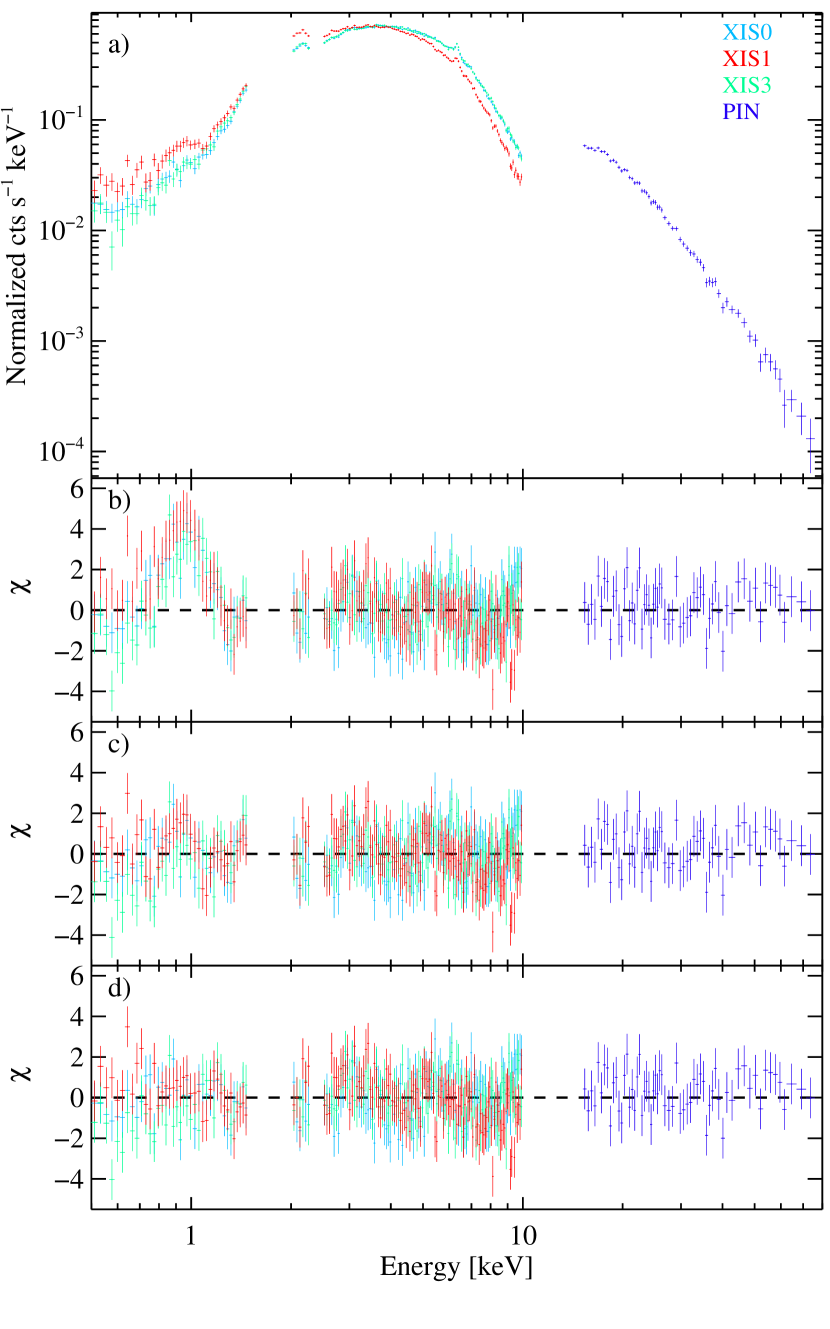
Including data from 0.4–3 keV in our fits (excluding the intervals 1.5–2.0 keV and 2.3–2.5 keV) we noticed obvious residuals below 3 keV due to the complex absorbers that have been seen previously in this source (Guainazzi & Bianchi 2007; Evans et al. 2007). We tried three models for the broadband data shown in Figures 1 and 2; parameters are given in Table 1. As an initial baseline, we first tried fitting two zones of absorption, allowing column density and covering fraction to be free for both layers. This ”Two-Absorber” model had best-fit values of near 4.4 and 5.7 cm-2 (2005 and 2012 respectively), and covering fractions near 75, as listed in Table 1. was close to cm-2 with a covering fraction of 1.0 (fully covering). This model did not provide a satisfactory fit and left strong, positive data/model residuals below 2 keV, as illustrated in Figures 1b and 2b.
Next, we applied the best-fit model of Evans et al. (2007) which included a third zone of absorption with a fixed covering fraction of 1 (layer 3 in the Three-Absorber model in Table 1). The fit was a significant improvement over previous fits (reduced values of 1.32 and 1.36). and remained at values similar to the Two-Absorber model. The covering fraction for layer 2, , remained very close to unity, with 2% leaked emission to model the positive residuals below 2 keV. However, as shown in Figures 1c and 2c, the residuals below 2 keV were still not modeled optimally.
Finally, we tried adding a phenomenological Gaussian component centered at 0.9 keV to the Two-Absorber model to model a blend of soft X-ray emission lines. This “Two Absorbers plus Soft Emission” model (henceforth the ”Soft Emission” model) fit the broadband data much better than the previous models, both in terms of data/model residuals (Figures 1d and 2d) and reduced . Best-fit parameters are listed in Table 1; parameters for layers 1 and 2 were similar to those in the Two-Absorber model. Because we are using one component to model a blend of emission lines, the width of the Gaussian component is not physically meaningful.
We also tried modeling warm absorption using an XSTAR table in xspec with an additional cold full-covering absorber, since absorption by highly ionized gas can mimic soft X-ray emission lines. However the fit was only a mild improvement on the Two-Absorber model and failed to model the soft emission with very poor residuals below 2 keV.
Guainazzi & Bianchi (2007) found evidence in this source for a radiative recombination continuum (RRC) feature due to O VIII at 0.87 keV, which was tentatively confirmed by Evans et al. (2007), who also found hints of a Ly emission line from O VIII at 0.65 keV. These features would be present if the extended plasma around the source were photoionized, and would likely be accompanied by other lines at low energies such as from O VII and Fe L transitions. We have therefore modeled a physically motivated soft emission complex due to photoionized plasma with a complex of lines and RRC features. Parameters for this model are listed in Table 2. Note that the absorbers in this model (with the exception of the Galactic column) are applied to the power law only. Evans et al. (2007) ruled out a single-temperature APEC component and reasoned that while collisionally ionized plasma was likely present, photoionization must also be a significant process in this source. dof values for the photoionized complex versus APEC were 976/710 versus 983/713 for the 2005 observation and 745/544 versus 739/543 for the 2012 observation. Parameters for the Two-Absorber model plus an APEC component are also given in Table 2.
3.3. The Fe K Bandpass
We analyzed the Fe K bandpass in more detail only after obtaining satisfactory models for the broadband continuum. We have detected a weak, narrow Fe K line with a width of around 20–60 eV, consistent with measurements made by Evans et al. (2007) using Chandra data. Fe K emission was undetectable with an upper limit to the intensity of 7.210-5 ph cm-2 s-1 and eV (width tied to that of the Fe K line and energy centroid frozen at 7.056 kEV). We found no evidence for emission from ionized Fe with upper limits of eV for Fe XXV and eV for Fe XXVI (widths tied to that of the K line and energy centroids frozen at 6.70 keV and 6.97 keV, respectively).
We also tested for relativistically broadened Fe K emission using the diskline model in xspec in addition to a narrow Gaussian with a fixed width ( = 1 eV). The improvement in fit was negligible (/dof= 2) with an upper limit to the intensity of the diskline of 2.410-5 ph cm-2 s-1 ( eV).
3.4. Simultaneous Fitting
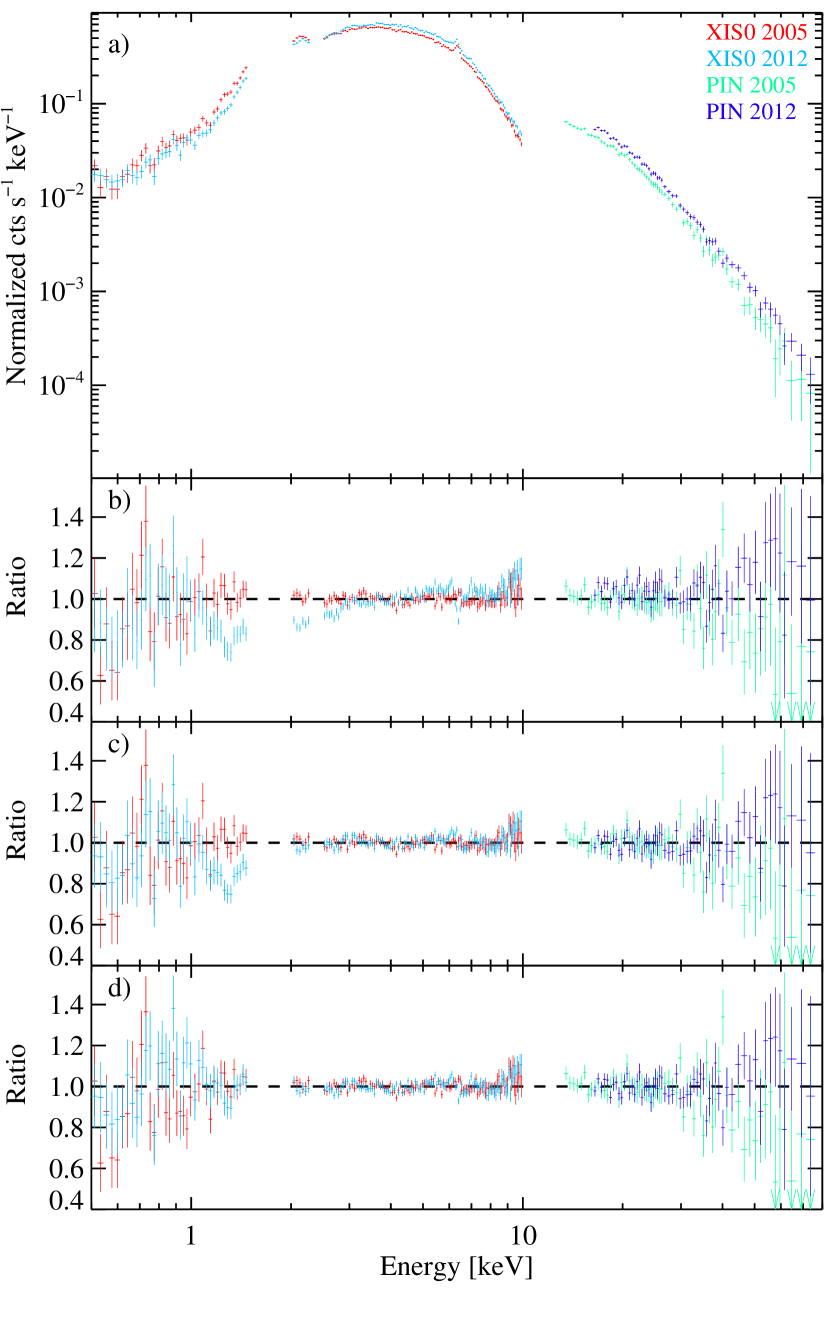
It is clear that the source flux and spectral characteristics remained fairly stable over the course of 6 years, however slight changes seem to have occurred. In order to investigate this spectral variability thoroughly, we performed simultaneous fitting of both Suzaku observations. We used the Soft Emission model from Table 1 with a Gaussian soft emission component, tying all parameters between the observations except F2-10, , and the instrumental renormalization constants (Note that for the 2012 observation the PIN renormalization constant was still tied at 1.16 relative to XIS0). This provided a poor fit (dof = 2793/1199) and it was clear that the difference in the levels of absorption between the two observations was real. Therefore we untied the column density of the first absorber (), yielding an improved fit with dof = 2079/1198. Untying just the covering fraction, , but not the column density gave a slightly better dof value of 1943/1198. Untying both and yielded a good fit with dof = 1649/1197. The data and ratio plots for these fits are shown in Figure 3. It was not significant to allow , , or to vary between the observations.
4. Discussion and Conclusions
With a high quality spectrum above 10 keV we are able to rule out the presence of a strong Compton reflection hump in this source. This simplifies our continuum modeling and means we can compare directly with previous observations which may have neglected this component due to lack of high energy coverage. We adopt the Soft Emission model described in Section 3.2 with parameters given in Table 1 as the best-fit model for the remainder of this paper.
The 2–10 keV unabsorbed luminosity of this source is erg s-1. This corresponds to a bolometric luminosity of roughly erg s-1 using a bolometric correction of 20 from Marconi et al. (2004), their Figure 3b. Assuming a a black hole mass of 2.5 (Merloni et al. 2003), we calculate the Eddington fraction of this source to be .
4.1. The Complex of Absorbers
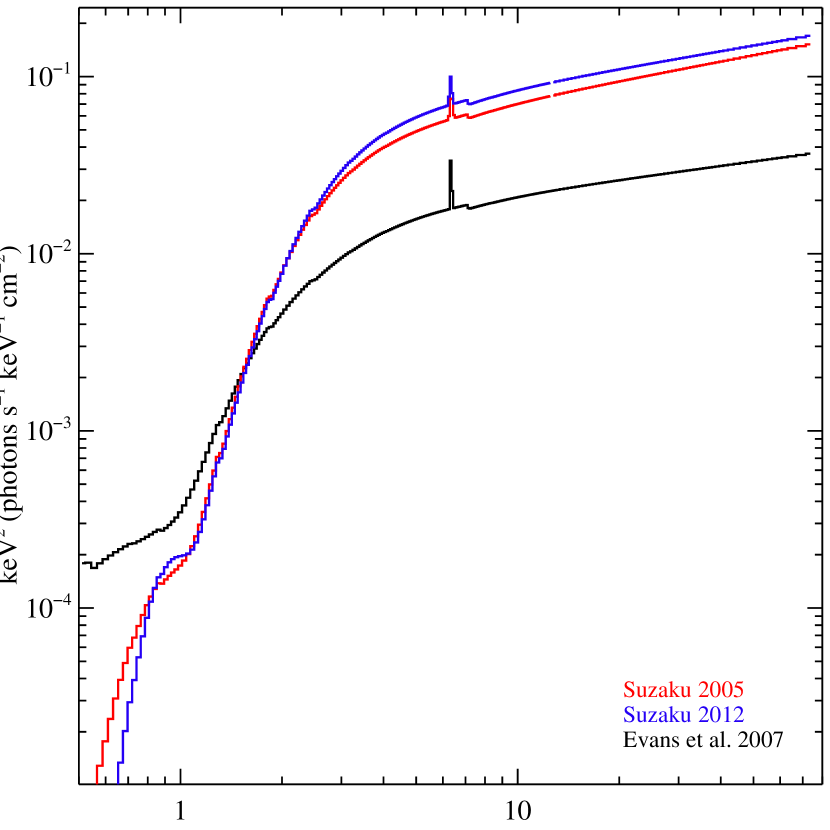
The absorbers in this source are clearly complex and time-variable. Layer 1 had the highest column density, and we had to model it as a partial coverer to achieve a good fit. Our observations show an increase in of 20% in 6 years with only a slight change in the measured covering fraction. Evans et al. (2007) analyzed Chandra-HETGS/XMM-Newton observations from 2001/2003 and found that their data were well-fit with the Three-Absorber model with column densities and covering fractions of = 12.8 cm-2 with = 0.32, = 2.76 cm-2 with = 0.96, and = 7.7 cm-2 with = 1. However, this model did not fit the Suzaku data as well as only two absorbers with the addition of a soft emission component. Additionally, Evans et al. (2007) found a much higher column density for layer 1 with a slightly lower covering fraction. Figure 4 shows the energy density plots of the best-fit models to the Suzaku observations and the model of Evans et al. (2007) for comparison.
If this change in the column density and covering fraction of layer 1 is a real effect and not instrumental (which could be due to bandpass differences and/or splicing non-simultaneous data as was done with the Chandra data), then the absorber underwent a significant change between 2003 and 2005, but experienced only a very slight change between 2005 and 2012. This could occur if a particularly dense, compact cloud was passing through the line of sight in 2001–2003, as has been observed on similar timescales in other Seyferts such as NGC 3516 (Turner et al. 2008), NGC 3227 (Lamer et al. 2003), and Cen A (Rivers et al. 2011). The level of absorption in 2005–2012 could represent a baseline level of absorption with more diffuse clouds causing the lower column density and higher covering fraction observed.
Fritz et al. (2006) modeled the mid-infrared emission of NGC 2110 with a dusty torus model, finding an equatorial column density of = 2.59 cm-2. Given the double sided radio jet emission in this source (Evans et al. 2006) it seems probable that the source is roughly edge-on and should therefore be absorbed by the infrared torus, however this column density is clearly much higher than that seen in the X-rays. This could be easily reconciled if the torus density were dependent on the polar angle and therefore on the viewing angle, or if the dust/gas ratio is very different from that assumed. Additionally, some have claimed that AGN tori must be clumpy (Risaliti et al. 2002; Nenkova et al. 2008), which could account for the partial-covering nature of the first layer of absorption.
Alternately, the first layer of absorption could be quite close in to the central black hole, commensurate with the broad line region (BLR) clouds, as has been inferred in, for example, MCG–6-30-15 (McKernan & Yaqoob 1998), NGC 4051 (Guainazzi et al. 1998), and NGC 1365 (Risaliti et al. 2009). NGC 2110 has a “hidden” BLR, detectable only in the infrared (Reunanen et al. 2003).
The second layer of absorption seems to have remained fairly stable over 11 years, with a column density of 3 cm-2 in the Chandra, XMM-Newton, and Suzaku observations, with a covering fraction 0.96. The stability of the column density over time would not be expected for a patchy, partial-covering absorber. Additionally, our Soft Emission model does not require this absorber to be partial-covering. This leads us to one of two scenarios: either this material is very homogeneous (in which case it is likely not partial-covering), or it is a partial-covering cloud located far from the central black hole. A transit of at least 11 years corresponds to a radius of 1018 cm or 50 pc (Lamer et al. 2003: Equation 3), assuming an ionization parameter of 1 erg cm s-1 and a black hole mass of 2.5 (Merloni et al. 2003).
Layer 2 could also be located much farther out from the nucleus, in the galaxy itself. The inclination dependence of dust extinction for disk-dominated galaxies has been derived in general by both Driver et al. (2007) and Shao et al. (2007), with lines of sight through even relatively edge-on disks contributing at most 2 magnitudes of optical extinction. The ratio of minor to major axes (0.78, Two Micron All Sky Survey Team’s 2MASS Extended objects catalog, 2003) yields the inclination of the disk: tilted 39°away from the plane of the sky. At this inclination, the average optical extinction is typically less than about half a magnitude. Assuming for simplicity similar B- and V-band magnitudes and a Galactic dust/gas ratio of = 1.8 cm-2 (Predehl & Schmidt 1995), this corresponds to a column density of only cm-2. Of course, we cannot rule out the possibility that the line of sight in NGC 2110 passes through an overdense/overdusty region in the host galaxy such as a giant molecular cloud. Assuming this is not the case, however, it seems likely that Layer 2 resides within the nuclear region.
4.2. The Soft Emission
There are several possibilities for the source of the soft emission in NGC 2110. One thing that needs to be ruled out is contamination from nearby point sources. The three closest point sources identified by Chandra all had flat spectra with 2–10 keV fluxes below 10-13 erg cm-2 s-1 (Evans et al. 2006; Evans et al. 2007) and would have negligible impact on our measurements.
The presence of soft emission and tentative detections of ionized emission lines in the Chandra data (Evans et al. 2007) hinted at the possibility of an ionized reflector. However, the xspec model reflionx was unable to reproduce the spectral shape. Additionally, the lack of a Compton reflection hump, broadened Fe lines, or emission from highly ionized Fe is consistent with there being no reflection from an accretion disk. We were also able to rule out the presence of a mildly ionized warm absorber as the cause of the soft spectral shape.
The two ionized plasma models that we fit to our data could be due in part to the extended soft X-ray plasma seen by Chandra (Evans et al. 2006). Our collisionally ionized plasma temperature of 910–970 eV is consistent with the Southern extended emission that Evans et al. (2006) fit with an APEC model, finding a temperature of 960 eV. The normalization for this component was a factor of 10 lower as found by the Chandra observations, however the Chandra extraction region was very limited and can only be taken as a lower limit to the strength of the emission. Since an excess around 1 keV was also seen by the Chandra observation of the nucleus of NGC 2110 (which excluded the extended emission regions), it seems likely that there are multiple ionized regions contributing to the soft emission. Unfortunately we are unable to disentangle them with the CCD resolution of the XIS, and the lack of photons picked up by the gratings of both Chandra and XMM-Newton mean we cannot use that data to break the degeneracies, either between the different regions or between collisional and photo-ionization processes.
4.3. The Fe K Emission Complex
Early modeling showed evidence for a relativistically broadened Fe K line in this source (Weaver & Reynolds 1998, Turner et al. 1998), however partial-covering absorber models and detailed soft X-ray coverage with Chandra and XMM-Newton dramatically reduced the significance of such a component (Evans et al. 2007). Our data are in good agreement with Evans et al. (2007), indicating that if there is a contribution from a broadened Fe line, it is very weak. The lack of a broadened line could indicate that the accretion disk is truncated and/or surrounds a radiatively inefficient flow (Esin et al. 1997). Another possibility is that the inner disk is too highly ionized to produce appreciable Fe line emission. Though the characteristic rollover above 30 keV due to the Compton reflection hump would still be present, we are unable to place constraints on such a component (modeled with, e.g., xillver; Garciá et al. 2013). X-ray missions with high sensitivity in the 20–100 keV range such as NuSTAR or Astro-H may be able to measure the contribution of reflection from extremely ionized material.
The overall amount of Fe emission in this source is quite weak. To calculate the expected amount of Fe emission from the absorbers detected we can use a thin-shell approximation and the following equation based on Yaqoob et al. (2001):
| (1) |
with the covering fraction of the absorber, the fluorescent yield, the fraction of photons that go into producing the K line, (E) the continuum power law, and the K-shell absorption cross section as a function of energy.
Assuming solar abundances, , and using values for the fluorescent yield and cross section from Yaqoob et al. (2001), along with our measured continuum and absorber parameters, we can calculate the contributed for each absorber. For the 2005 observation we find that eV. For the 2012 observation we find that eV. This is consistent with the measured values of 464 eV and 513 eV, respectively, allowing for variability of the source, and assuming that the measured covering fraction is approximately equal to the global covering fraction.
Our measured Fe K line width ( 32–45 eV) corresponds to of 4000–5600 km s-1. For an assumed black hole mass of 2.5 , this corresponds to an inner radius of 0.004–0.008 pc. If the Fe line truly is associated with the absorbers then this is also the lower limit to the inner radius of the absorbing material. This radius is consistent with typical values for the BLR in Seyferts, hinting that the absorbers could be commensurate with the BLR clouds. Unfortunately, the widths of the IR broad lines are not resolved in this source.
4.4. Summary
We have analyzed two Suzaku observations of the Seyfert 2 galaxy, NGC 2110. This source has been known to have complex, variable absorption previously observed with the XMM-Newton and Chandra observatories (Evans et al. 2007). We found that there is a relatively stable full-covering absorber with a column density of cm-2, with an additional patchy absorber that is highly variable, possibly in the form of a patchy torus or broad line region. We found that the soft emission, which has been interpreted in several ways in the past, likely arises in an ionized plasma. There is likely contribution by the extended soft X-ray plasma detected by Chandra, as well as from within the nucleus. We tested both collisionally ionized and photoionized models, but were unable to distinguish between them. Instruments with a combination of high effective area and spectral resolution such as those aboard the upcoming Astro-H mission (Takahashi et al. 2012) will be necessary to fully disentangle these components.
We find no evidence for a Compton reflection hump in this source, i.e., there seems to be no evidence for the existence of any circumnuclear gas with a column higher than 1.2 cm-2 in NGC 2110. We also find no evidence for a relativistically broadened Fe K line. This may be due to a radiatively-inefficient or advection-dominated accretion flow (e.g., Esin et al. 1997) feeding the black hole in this source. The lack of these X-ray spectral signatures also occurs in the radio-loud AGN Cen A (e.g., Markowitz et al. 2007), hinting that in at least some sources accretion may proceed in a different mode than typical Seyferts. Where Compton humps and broad Fe K lines are not significantly detected it may be that the Compton-thick gas is poorly illuminated by the central source (e.g., a Compton-thick torus with a very large opening angle), the accretion is radiatively inefficient, and/or gas is not accumulating to Compton-thick levels.
References
- (1)
- (2) Arnaud, K. 1996, in Astronomical Data Analysis Software and Systems, Jacoby, G., Barnes, J., eds., ASP Conf. Series Vol. 101, p.17
- (3)
- (4) Behar, E. et al. 2003, ApJ, 598, 232
- (5) Boldt, E., 1987, Proc. IAU Symp. 124, Observational Cosmology (Dordrecht: Reidel), 611
- (6) Blustin, A. et al. 2005 A&A 431, 111
- (7)
- (8) Crummy, J. et al. 2006, MNRAS, 365, 1067
- (9)
- (10) Driver, S.P., Popescu, C.C., Tuffs, R.J., Liske, J., Graham, A.W., Allen, P.D., de Propris, R., 2007, MNRAS, 379, 1022
- (11)
- (12) Esin, A. et al. 1997, ApJ, 489, 865
- (13) Evans, D., Lee, J.C., Turner, T. J., Weaver, K.A., & Marshall, H.L., 2007, ApJ, 671, 1345
- (14) Evans, D., Lee, J.C., Kamenetska, M., Gallagher, S.C., Kraft, R.P., Hardcastle, M.J., & Weaver, K.A., 2006, ApJ, 653, 1121
- (15)
- (16) Fukuzawa, Y., et al. 2009, PASJ, 61, 17
- (17)
- (18) García, J., Dauser, T., Reynolds, C.S., Kallman, T.R., McClintock, J.E., Wilms, J., Eikmann, W., 2013, ApJ, 768, 146
- (19) George, I.M. & Fabian, A.C. 1991, MNRAS, 249, 352
- (20) Gierliński, M. & Done, C. 2006, MNRAS, 371, L16
- (21) Guainazzi, M. et al. 1998, MNRAS, 301, 1
- (22)
- (23) Ishisaki, Y. et al. 2007, PASJ, 59, 113
- (24)
- (25) Kalberla, P.M.W. et al. 2005, A&A, 440, 775
- (26) Kokubun, M. et al. 2007, PASJ, 59, 53
- (27) Koyama, K. et al. 2007, PASJ, 59, 23
- (28)
- (29) Lamer, G., Uttley, P., & McHardy, I. M. 2003, MNRAS, 342, L41
- (30) Larsson, J. et al. 2008, PASJ, 384, 1316
- (31)
- (32) Magdziarz, P. & Zdziarski, A., 1995, MNRAS, 273, 837
- (33) Maiolino, R., Risaliti, G., Salvati, M., Pietrini, P.,Torricelli-Ciamponi, G., Elvis, M., Fabbiano, G., Braito, V., Reeves, J. 2010 A&A 517A, 47
- (34) Magdziarz, P. & Zdziarski, A.A. 1995, MNRAS, 273, 837
- (35) Marconi, A., Risaliti, G., Gilli, R., Hunt, L. K., Maiolino, R., & Salvati, M. 2004, MNRAS, 351, 169
- (36) Markowitz, A., 2007, ApJ, 665, 209
- (37) McKernan, B. & Yaqoob, T. 1998, ApJL, 501, 29
- (38) Merloni, A., Heinz, S., & di Matteo, T. 2003, MNRAS, 345, 1057
- (39) Middleton, M. et al. 2007, MNRAS, 381, 1426
- (40) Miller, L. et al. 2008, A&A, 483, 437
- (41) Miniutti, G. et al. 2007, PASJ, 59S, 315
- (42) Mitsuda, K., et al., 2007, PASJ, 59, 1
- (43) Murphy, K. & Yaqoob, T. 2009, MNRAS, 397, 1549
- (44)
- (45) Nenkova, M. et al. 2008, ApJ, 685, 160
- (46)
- (47) Patrick, A.R. et al. 2011, MNRAS, 416, 2725
- (48)
- (49) Risaliti, G., Elvis, M., & Nicastro, F., 2002, ApJ, 571, 234
- (50) Risaliti G. et al. 2009 MNRAS, 393L, 1
- (51) Rivers, E., Markowitz, A., & Rothschild, R.E. 2011, ApJ, 742, 29
- (52) Ross, R.R. & Fabian, A.C., 2005, MNRAS, 358, 211
- (53)
- (54) Takahashi, T. et al. 2012, SPIE, 8443, 1
- (55) Turner, T. J., Reeves, J. N., Kraemer, S. B. & Miller, L. 2008, A&A, 483, 161
- (56) Turner, T. J., George, I. M., Nandra, K., & Mushotzky, R. F. 1998, ApJ, 493, 91
- (57)
- (58) Verner, D. A., Ferland, G. J., Korista, K. T., & Yakovlev, D. G. 1996, ApJS, 465, 487
- (59)
- (60) Weaver, K. & Reynolds, C. 1998, ApJ, 503, 39
- (61) Wilms, J., Allen, A., & McCray, M. 2000, ApJ, 542, 914
- (62)
- (63) Shao, Z. et al. 2007, ApJ, 659, 1159
- (64)