INTEGRAL and Swift observations of the hard X-ray transient MAXI J1828-249
In this paper we report on the observations performed with INTEGRAL and Swift of the first outburst detected from the hard X-ray transient MAXI J1828-249. During the first about two days of the outburst, the source was observed by MAXI to undergo a very rapid transition from a hard to a softer spectral state. While the hard state was not efficiently monitored because the transition occurred so rapidly, the evolution of the source outburst in the softer state was covered quasi-simultaneously in a broad energy range (0.6-150 keV) by the instruments on-board INTEGRAL and Swift. During these observations, the spectra measured from the source displayed both a prominent thermal emission with temperature kT0.7 keV and a power-law hard component with a photon index 2.2 extending to 200 keV. The properties of the source in the X-ray domain are reminiscent of those displayed by black hole transients during the soft intermediate state, which supports the association of MAXI J1828-249 with this class of objects.
Key Words.:
methods:observational - X-rays:binaries - X-rays:individuals: MAXI J1828-2491 Introduction
MAXI J1828-249 was discovered in outburst on 15 October 2013 (56580.91 MJD) by MAXI/GSC (Nakahira et al., 2013). Shortly after the discovery, the source was detected at higher energies by the hard X-ray imager ISGRI on-board INTEGRAL (Filippova et al., 2013). At discovery the flux recorded from the source was 939 mCrab in the 4-10 keV energy band and 452 mCrab (482 mCrab) in the 20-40 keV (40-80 keV) energy band. Follow-up observations carried out on 56581.6 MJD with the narrow field instrument on-board Swift/XRT provided the best measured position of the source at RA=277.2427, Dec=-25.0304 (J2000) with an estimated uncertainty of 3.6 arcsec at 90 c.l. (Kennea et al., 2013a). The improved position permitted us to identify the UV and IR counterparts of the source. The estimated magnitude of the UV source was 18.640.04 (stat)0.03 (sys) (in AB system, without correction for interstellar reddening; Kennea et al., 2013b). The AB magnitudes of the optical/IR source were (not corrected for the interstellar reddening). The derived spectrum of optical/IR source might be interpreted as arising because of an accretion disk (Rau et al., 2013). Radio observations carried out about two days after the onset of the outburst did not reveal significant emission from the source (the 3 upper limit on its flux was 75 Jy at 5.5 GHz and 57 Jy at 9.0 GHz; Miller-Jones et al., 2013).
In this paper we report on all INTEGRAL and Swift data available to our group collected during the outburst of MAXI J1828-249 from 56580 to 56607 MJD.
2 INTEGRAL data
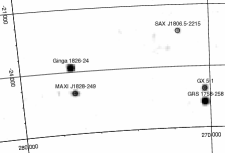
MAXI J1828-249 was observed by IBIS/ISGRI (Lebrun et al., 2003; Ubertini et al., 2003) from 56580 MJD to 56594 MJD, that is during satellite revolutions 1344 to 1348. Revolution 1348 closed the seasonal visibility window of INTEGRAL in the direction of the source and no other data were collected after 56594 MJD (see Table 1). The source was generally observed at relatively high off-axis angles and was included in the FOV of the two JEM-X units (Lund et al., 2003) for only a relatively small fraction of the total observational time (revolutions 1346 to 1348). The analysis of INTEGRAL data was carried out by the OSA10.0 distributed by the ISDC (Courvoisier et al., 2003). We show in Fig. 1 the ISGRI mosaic of the field of view (FOV) around the source. In this mosaic (total effective exposure time 137 ks) the source is detected with a significance of 41 in the 20-100 keV energy band. In the JEM-X mosaic (effective exposure time 6 ks), the source was detected at a significance of 13 in the the 3-35 keV energy band. To perform a broad-band spectral analysis of the X-ray emission recorded from the source, we extracted the ISGRI and JEM-X spectra during time intervals quasi-simultaneous with Swift data (see Table 1).
3 Swift data
Swift observations were carried out immediately after the discovery of the source and covered about 30 days of the outburst (Kennea et al., 2013a, b). The first two pointings (ID 00032993001, 00032994001) were collected in photon-counting mode (PC; time resolution 2.5 s) and were severely affected by pile-up due to the high flux of the source (Kennea et al., 2013a). We therefore discarded these data for the following analysis. All the remaining data were collected in window-timing mode (WT; time resolution 1.8 ms, see Table 2). XRT data were processed with the xrtpipeline (v.0.12.6) and were analyzed using standard procedures (Burrows et al., 2005). We selected only event grades 0-2 and adopted the latest response files available (v.014). Exposure maps were created through the xrtexpomap task and were used to generate ARF files. The source light curves in each observations were corrected for all instrumental issues with the task xrtlccorr. All source event lists were barycentered by using the barycorr tool. In all XRT observations the source was detected at count-rates 150-250 cts/s in energy band 0.3-10 keV, depending also on the position of the source on the detector and the presence of bad columns111http://www.swift.ac.uk/analysis/xrt/exposuremaps.php. We followed the technique described in Romano et al. (2006) to search for pile-up in the XRT observations, and found that excluding the two innermost pixels of the extraction region centered on the source was sufficient to correct for this problem in all pointings. Correction for pile-up was not needed for pointing 8, as in this case a bad column passing through the source already decreased the count-rate below the level at which pile-up is a problem. All XRT spectra were grouped to have at least 100 photons per energy bin and were fit with the -statistic in Xspec. Uncertainties throughout the paper are given at 90% c.l. if not stated otherwise.
4 Results
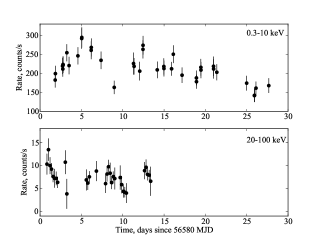
The XRT and ISGRI light curves of the source covering the entire observational campaign reported in this paper are shown in Fig. 2. The XRT light curve shows a noticeable increase of the source X-ray flux (0.3-10 keV) during the first five days of the outburst with a gradual decrease afterwards. In the ISGRI energy band (20-100 keV) no significant flux evolution is detected (though with large uncertainties). This behavior agrees with that found in the publicly available MAXI data of the source222http://maxi.riken.jp/top/index.php?cid=1&jname=J1828-250.
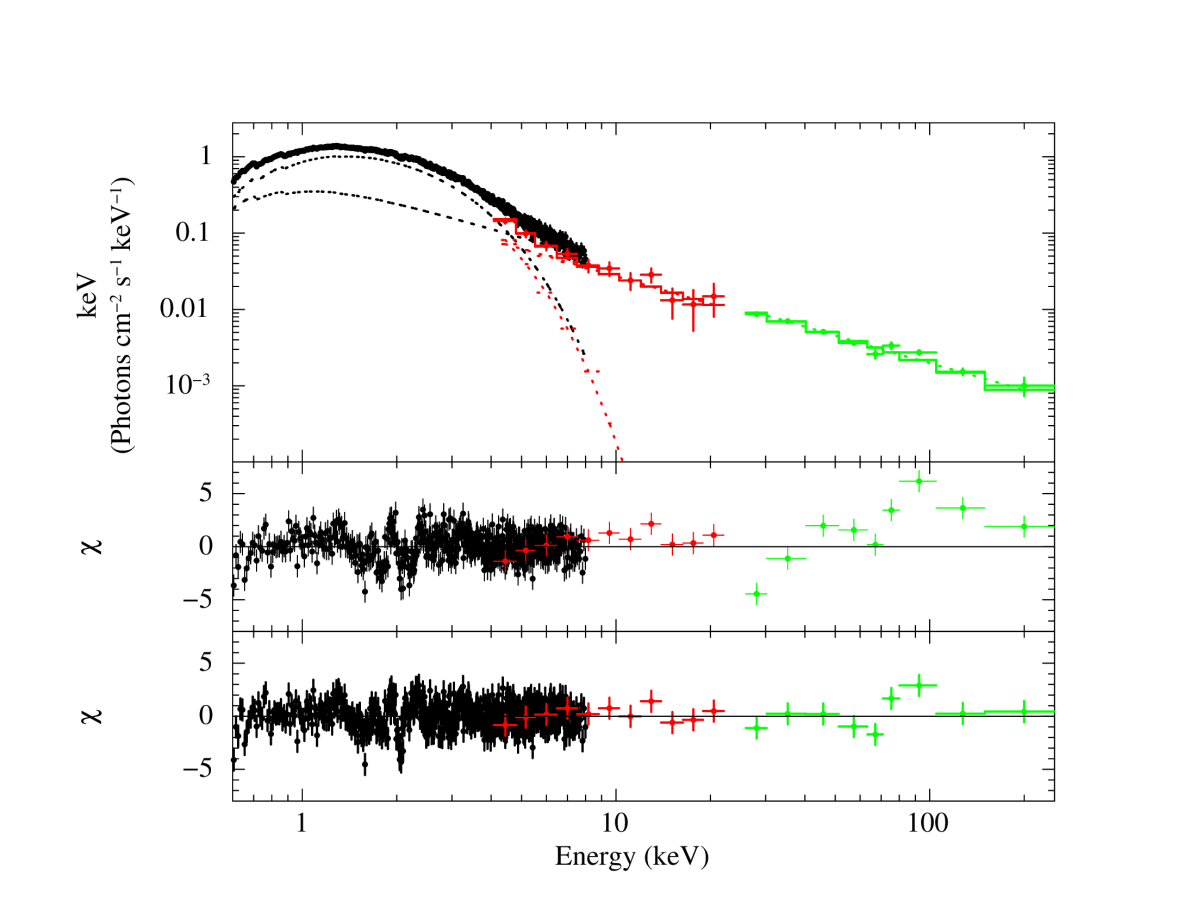
We first extracted all available XRT spectra of the source and fit them with a simple absorbed power-law model. In all cases these fits gave unacceptable results (1) and showed a clear excesses in the residuals at energies 2-3 keV. Data points at energies 0.6 keV were discarded from the analysis to avoid strong instrumental residuals around the O-K edge. We found that a model comprising an absorbed multi-temperature disk black body (diskbb in Xspec) and a power law could be used to describe all XRT spectra in the energy range 0.6-10 keV equally well. In all cases we obtained an absorption column density consistent with the Galactic value expected in the direction of the source (0.31022 cm-2, Dickey & Lockman, 1990), an inner disk radius (temperature) of 25 km (0.7 keV) and a power-law photon index of 3. When the INTEGRAL data were also used to perform a broad-band fit, the higher energy emission of the source was characterized by a significantly harder power-law spectrum (=2.2) than that derived from the XRT spectra. We found that this discrepancy arises from instrumental residuals in the XRT spectra at energies 1.5-2.5 keV, corresponding to the and edges333http://www.swift.ac.uk/analysis/xrt/files/SWIFT-XRT-CALDB-09_v17.pdf. These residuals are tackled by the minimization routine in Xspec mainly by adjusting the power-law photon index (poorly determined in the fits to the XRT spectra alone because of the limited energy coverage of the instrument). The instrumental residuals in XRT become very evident when all data are summed to extract an average spectrum (see Fig. 3). Following the suggestion in the latest available XRT calibration document, we tried to account for these residuals in the fits to the XRT data alone by fixing (as determined from the average broad-band spectrum) and using the gain correction in Xspec. The results of the broad-band spectral analysis obtained with this method are summarized in Table 1 (normalization constants were introduced in all broad-band fits to account for the variability of the source and intercalibration between the different instruments). We indicated in all cases the measured correction to the energy slope (Sl) and shift (G) of the XRT spectra. For consistency, the gain correction was also applied during the fits to the XRT spectra alone, as reported in Table 2 (in several cases the values of Sl and G were poorly constrained and did not significantly affect the fits because of the relatively low statistics of the data). The hard X-ray emission from the source is clearly detected up to 200 keV.
| Data111111footnotemark: | Exposures | 2 | 3 | Flux4 | Sl5 | G5 | ||||||||
|---|---|---|---|---|---|---|---|---|---|---|---|---|---|---|
| (ks) | keV | (km) | 0.6-10 | 20-100 | eV | |||||||||
| XRT | JEM-X | ISGRI | keV | kev | ||||||||||
| 1344+01 | 1.0 | - | 26 | 0.190.02 | 2.00.16 | 0.680.02 | 28.41.8 | - | 0.60.2 | 4.9 | 0.6 | 0.960.01 | 3725 | 1.2/283 |
| 1344+03 | 1.0 | - | 8 | 0.320.08 | 2.680.24 | 0.73 | 22.72.5 | - | 1.90.9 | 6.1 | 0.7 | 0.990.02 | 030 | 1.2/331 |
| 1345+06 | 1.0 | - | 30 | 0.20.02 | 2.10.2 | 0.76 | 25.31.7 | - | 6.1 | 0.6 | 0.970.01 | 3518 | 1.2/338 | |
| 1346+07 | 0.9 | - | 9 | 0.180.03 | 1.860.24 | 0.74 | 27.81.7 | - | 6.9 | 0.8 | 0.920.02 | 19 | 1.0/310 | |
| 1346+08 | 0.2 | 1.7 | 17 | 0.210.04 | 2.10.2 | 0.70.04 | 22.73.3 | 3.5 | 0.7 | 1.030.03 | 25 | 1.0/121 | ||
| 1347+11 | 0.9 | 3.4 | 30 | 0.250.05 | 2.30.3 | 0.680.02 | 293 | 5.7 | 0.4 | 0.980.02 | 1520 | 1.2/251 | ||
| 1348+12 | 1.05 | 3.4 | 40 | 0.20.02 | 2.20.2 | 0.720.01 | 25.61.4 | 0.70.1 | 0.630.03 | 6.1 | 0.6 | 0.950.02 | 45 | 1.1/211 |
| Total | 10.5 | 8.6 | 160 | 0.220.01 | 2.20.1 | 0.720.04 | 25.40.5 | 0.70.1 | 0.80.1 | 5.9 | 0.6 | 0.970.03 | 246 | 1.4/614 |
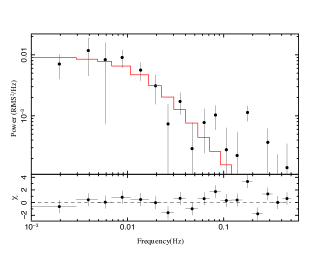
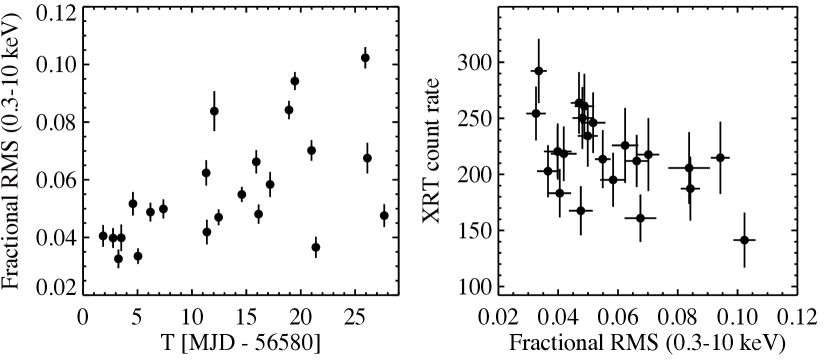
The timing analysis of the Swift /XRT data was carried out with a technique similar to that reported in Ferrigno et al. (2012). We first searched for timing features in the event files extracted from each of the XRT pointing, but no statistically significant features were found. We therefore computed the average power spectral density (PSD) of the source by performing a Fourier transform on its light curves (time bin of 1 s) and averaging on intervals of 512 s (corresponding to roughly 1-2 time intervals per observation). The PSD were well fit () by a zero-centered Lorentzian plus white noise. The latter was added as a constant to the fit and we measured in Leahy normalization =. The source PSD is shown in Fig. 4. We estimated the rms variability of the source from the zero-centered Lorentzian after subtracting the contribution of the white noise and obtained rms=0.90% and mHz. Because this average analysis showed that the aperiodic noise is more prominent in the 4-50 mHz frequency range, we used this interval to compute the fractional rms of each observation separately. The results are reported in Fig. 5. The uncertainties on the rms of each observation was obtained from bootstrapping simulations with 1000 realizations (for a detailed description of the method see Ferrigno et al., 2012). The source exhibited an rms 10% in all XRT pointings and no particular trend is found when the rms is plotted as a function of the total source count-rate (see Fig. 5).
Owing to the relatively low statistics of the INTEGRAL data, we did not attempt a timing analysis of the hard X-ray emission from MAXI J1828-249.
| ObsID1 | Start Time | Stop Time | Exposure | Photon index3 | 2 | Flux (0.6 – 10 keV) | Sl5 | G5 | /d.o.f | ||
|---|---|---|---|---|---|---|---|---|---|---|---|
| MJD | MJD | ks | () | keV | km | erg s-1 cm-2 | eV | ||||
| 1 | 56581.831 | 56581.860 | 0.97 | 0.210.02 | 2.2 | 0.670.02 | 28.1 | 4.9 | 0.960.01 | 29 | 1.1/275 |
| 2 | 56582.720 | 56582.791 | 0.98 | 0.210.03 | 2.2 | 0.720.02 | 26.4 | 6.4 | 0.960.01 | 45 | 1.0/311 |
| 3 | 56583.244 | 56583.256 | 0.95 | 0.220.02 | 2.2 | 0.710.01 | 26.51.2 | 6.2 | 0.970.01 | 20 | 1.2/324 |
| 44 | 56583.509 | 56583.517 | 0.68 | 0.230.03 | 2.2 | 0.700.03 | 28.2 | 6.5 | 0.970.02 | 12 | 1.1/250 |
| 44 | 56584.579 | 56584.586 | 0.59 | 0.230.03 | 2.2 | 0.730.02 | 29.6 | 6.8 | 0.970.02 | 7 | 1.1/265 |
| 5 | 56585.039 | 56585.053 | 1.20 | 0.210.02 | 2.2 | 0.750.01 | 27.8 | 6.8 | 1.010.01 | 0 | 1.2/352 |
| 6 | 56586.185 | 56586.196 | 1.01 | 0.200.01 | 2.2 | 0.780.01 | 24.9 | 6.1 | 0.970.01 | 3516 | 1.1/330 |
| 7 | 56587.378 | 56587.389 | 0.94 | 0.220.02 | 2.2 | 0.740.02 | 27.32.0 | 6.7 | 0.980.02 | 0 | 1.0/303 |
| 8 | 56588.973 | 56588.975 | 0.18 | 0.220.03 | 2.2 | 0.700.04 | 23.03.0 | 3.5 | 1.030.04 | 0 | 0.97/107 |
| 114 | 56591.308 | 56591.318 | 0.90 | 0.230.02 | 2.2 | 0.680.02 | 30.02.0 | 5.7 | 0.980.02 | 1731 | 1.2/239 |
| 114 | 56591.375 | 56591.382 | 0.61 | 0.230.02 | 2.2 | 0.710.03 | 28.12.1 | 6.1 | 0.980.02 | 27 | 1.1/253 |
| 12 | 56592.450 | 56592.462 | 1.05 | 0.210.01 | 2.2 | 0.710.02 | 26.2 | 6.0 | 0.950.01 | 3920 | 1.2/324 |
| 13 | 56592.058 | 56592.062 | 0.34 | 0.220.05 | 2.2 | 0.700.04 | 31.76.3 | 3.6 | 1.020.02 | 0 | 0.98/164 |
| 14 | 56594.177 | 56594.994 | 1.48 | 0.220.02 | 2.2 | 0.720.02 | 28.91.5 | 5.9 | 0.950.01 | 33 | 1.2/330 |
| 15 | 56595.912 | 56595.921 | 0.74 | 0.240.03 | 2.2 | 0.700.02 | 30.2 | 6.2 | 0.980.01 | 0 | 1.1/302 |
| 16 | 56596.120 | 56596.132 | 0.98 | 0.200.01 | 2.2 | 0.710.01 | 27.31.3 | 5.6 | 0.950.01 | 40 | 1.1/308 |
| 17 | 56597.180 | 56597.189 | 0.76 | 0.220.01 | 2.2 | 0.670.02 | 28.6 | 5.8 | 0.950.01 | 40 | 1.1/258 |
| 18 | 56598.915 | 56598.927 | 1.05 | 0.240.04 | 2.2 | 0.680.03 | 28.4 | 4.6 | 1.010.01 | 0 | 0.98/294 |
| 19 | 56599.453 | 56599.467 | 1.16 | 0.200.01 | 2.2 | 0.710.02 | 25.5 | 4.9 | 0.950.02 | 51 | 1.2/299 |
| 20 | 56600.987 | 56601.000 | 1.15 | 0.210.01 | 2.2 | 0.680.02 | 24.91.7 | 4.9 | 0.950.01 | 38 | 1.1/273 |
| 21 | 56601.384 | 56601.393 | 0.80 | 0.210.02 | 2.2 | 0.670.02 | 25.31.6 | 4.7 | 0.960.01 | 33 | 1.1/264 |
| 22 | 56604.994 | 56604.997 | 0.19 | 0.30.1 | 2.2 | 0.60.1 | 38.5 | 4.8 | 1.00.1 | 0 | 1.1/108 |
| 23 | 56605.928 | 56605.940 | 1.05 | 0.210.01 | 2.2 | 0.620.02 | 26.92.2 | 4.6 | 0.950.01 | 41 | 1.3/258 |
| 24 | 56606.121 | 56606.130 | 0.75 | 0.250.03 | 2.2 | 0.610.02 | 29.42.8 | 4.6 | 0.960.02 | 12 | 1.0/251 |
| 25 | 56607.670 | 56607.681 | 0.95 | 0.220.02 | 2.2 | 0.640.02 | 31.1 | 5.7 | 0.960.01 | 36 | 1.2/253 |
5 Discussion
MAXI J1828-249 was discovered in outburst on 2013 October 15 by the MAXI/GSC instrument and apparently underwent a spectral transition from a hard to a softer state about one day later (Negoro et al., 2013). Such transitions are typically observed in the so-called black hole candidates (BHC), which suggests that MAXI J1828-249 is associated with this class of objects. According to the standard scenario (Fender et al., 2004; Homan & Belloni, 2005; Belloni, 2010), BHC sources are known to evolve during their outburst along a q-shaped track in the hardness-intensity diagram. The outburst starts in the low-hard spectral state (LHS), which is characterized by a power-law shaped X-ray spectrum with and a cut-off at the higher energies keV. Radio emission arises in this state due to the synchrotron radiation of a steady jet. In the following phases of the outburst, the X-ray and radio luminosities both increase until the source reaches the high-soft state (HSS), characterized by a prominent thermal emission from the accretion disk and a marginal power-law tail. Radio emission at this state is no longer observed, most likely because of the suppression of the jet. The time variability of the source is also significantly different in the two states, being generally more pronounced in the LHS with rms values of up to 30% and characterized by the quasi-periodical oscillations (QPOs) in the HSS in combination with a strongly suppressed rms (see, e.g., Belloni, 2010, for a recent review). In addition to these two main states, at least two intermediate hard and soft states were identified. In particular, BHCs in the so-called intermediate soft state still show a significant hard component (extending to hundreds of keV) though they are no longer significantly detected in the radio domain and present both a prominent soft spectral component and a limited rms. Not all transient BHCs in outburst go through a complete q-track. So far, a limited number of objects were observed that reach the hard intermediate state during outburst, but then return to the LHS instead of moving to HSS (see, e.g., Capitanio et al., 2009; Ferrigno et al., 2012).
The observational campaign we presented in this paper started about 1.8 days after the discovery, that is, immediately after the possible spectral transition reported by Negoro et al. (2013). The broad-band energy spectrum of the source as measured by Swift and INTEGRAL comprised a thermal component that we associated with the emission from a multi-temperature black-body disk, and a hard power-law extending with no measurable break up to 200 keV. Assuming a distance to the source of 8 kpc, its peak luminosity is erg/s. During the entire observational campaign MAXI J1828-249 did not show significant spectral evolution. Our observational results suggest that MAXI J1828-249 is a transient BHC that evolved rapidly in the first two days of the outburst from the LHS to the soft intermediate state and remained in this state during the entire observational campaign presented in this work. This conclusion is supported by both the spectral and timing analysis666Note that the range of frequencies we could investigate in the case of MAXI J1828-249 based on the available X-ray data is slightly lower (0.001-0.5 Hz) compared to that in which typical QPOs for this state are observed (0.01 - 50 Hz). However, the measured rms level in the XRT data is fully compatible with that commonly found in the soft intermediate state. reported in Sect. 4 and the lack of significant radio emission already two days after the onset of the outburst, as mentioned in Sect. 1. The light curve of the source based on MAXI publicly available data also supports this scenario and suggests that the source is now fading into quiescence. This means that MAXI J1828-249 might represent another example of transient BHC ”failed” outburst, as mentioned above. Future observations in mid-2014 (e.g. with Swift/XRT) will be able to confirm/reject this conclusion.
Note added to proofs. After this paper was accepted for publication, new Swift data collected on 2014 February 14 found that the source is back in a faint hard state (power-law photon index 1.7 and 0.5-10 keV flux of erg/cm2/s; Tomsick & Corbel (2014)). Radio observations performed on 2014 February 16 also detected significant radio emission from the source (preliminary flux densities 1.380.05 mJy at 5.5 GHz and 1.280.06 mJy at 9 GHz; Corbel et al. (2014)), which supports our conclusions in Sect. 5.
Acknowledgments
EF acknowledges support by grant NSh-6137.2014.2, RFBR 13-02-00741 and grant 20FI20_135263 of the National Swiss Fond.
References
- Belloni (2010) Belloni, T. M. 2010, in Lecture Notes in Physics, Berlin Springer Verlag, Vol. 794, Lecture Notes in Physics, Berlin Springer Verlag, ed. T. Belloni, 53–+
- Burrows et al. (2005) Burrows, D. N., Hill, J. E., Nousek, J. A., et al. 2005, Space Sci. Rev., 120, 165
- Capitanio et al. (2009) Capitanio, F., Belloni, T., Del Santo, M., & Ubertini, P. 2009, MNRAS, 398, 1194
- Corbel et al. (2014) Corbel, S., Tomsick, J. A., & Tzioumis, T. 2014, The Astronomer’s Telegram, 5911, 1
- Courvoisier et al. (2003) Courvoisier, T., Walter, R., Beckmann, V., et al. 2003, A&A, 411, L53
- Dickey & Lockman (1990) Dickey, J. M. & Lockman, F. J. 1990, ARA&A, 28, 215
- Fender et al. (2004) Fender, R. P., Belloni, T. M., & Gallo, E. 2004, MNRAS, 355, 1105
- Ferrigno et al. (2012) Ferrigno, C., Bozzo, E., Del Santo, M., & Capitanio, F. 2012, A&A, 537, L7
- Filippova et al. (2013) Filippova, E., Kuulkers, E., Sanchez-Fernandez, C., et al. 2013, The Astronomer’s Telegram, 5476, 1
- Homan & Belloni (2005) Homan, J. & Belloni, T. 2005, Ap&SS, 300, 107
- Kennea et al. (2013a) Kennea, J. A., Linares, M., Krimm, H. A., et al. 2013a, The Astronomer’s Telegram, 5478, 1
- Kennea et al. (2013b) Kennea, J. A., Linares, M., Krimm, H. A., et al. 2013b, The Astronomer’s Telegram, 5479, 1
- Lebrun et al. (2003) Lebrun, F., Leray, J. P., Lavocat, P., et al. 2003, A&A, 411, L141
- Lund et al. (2003) Lund, N., Budtz-Jørgensen, C., Westergaard, N. J., et al. 2003, A&A, 411, L231
- Miller-Jones et al. (2013) Miller-Jones, J. C. A., Russell, T. D., Sivakoff, G. R., & Curran, P. A. 2013, The Astronomer’s Telegram, 5484, 1
- Nakahira et al. (2013) Nakahira, S., Tomida, H., Negoro, H., et al. 2013, The Astronomer’s Telegram, 5474, 1
- Negoro et al. (2013) Negoro, H., Sugizaki, M., Mihara, T., et al. 2013, The Astronomer’s Telegram, 5483, 1
- Rau et al. (2013) Rau, A., Tanga, M., & Greiner, J. 2013, The Astronomer’s Telegram, 5482, 1
- Romano et al. (2006) Romano, P., Campana, S., Chincarini, G., et al. 2006, A&A, 456, 917
- Tomsick & Corbel (2014) Tomsick, J. A. & Corbel, S. 2014, The Astronomer’s Telegram, 5886, 1
- Ubertini et al. (2003) Ubertini, P., Lebrun, F., Di Cocco, G., et al. 2003, A&A, 411, L131