OGLE-2012-BLG-0455/MOA-2012-BLG-206: MICROLENSING EVENT WITH AMBIGUITY IN PLANETARY INTERPRETATIONS CAUSED BY INCOMPLETE COVERAGE OF PLANETARY SIGNAL
Abstract
Characterizing a microlensing planet is done from modeling an observed lensing light curve. In this process, it is often confronted that solutions of different lensing parameters result in similar light curves, causing difficulties in uniquely interpreting the lens system, and thus understanding the causes of different types of degeneracy is important. In this work, we show that incomplete coverage of a planetary perturbation can result in degenerate solutions even for events where the planetary signal is detected with a high level of statistical significance. We demonstrate the degeneracy for an actually observed event OGLE-2012-BLG-0455/MOA-2012-BLG-206. The peak of this high-magnification event exhibits very strong deviation from a point-lens model with for data sets with a total number of measurement 6963. From detailed modeling of the light curve, we find that the deviation can be explained by four distinct solutions, i.e., two very different sets of solutions, each with a two-fold degeneracy. While the two-fold (so-called “close/wide”) degeneracy is well-understood, the degeneracy between the radically different solutions is not previously known. The model light curves of this degeneracy differ substantially in the parts that were not covered by observation, indicating that the degeneracy is caused by the incomplete coverage of the perturbation. It is expected that the frequency of the degeneracy introduced in this work will be greatly reduced with the improvement of the current lensing survey and follow-up experiments and the advent of new surveys.
Subject headings:
gravitational lensing: micro – planets and satellites: general1. INTRODUCTION
Gravitational microlensing is one of important methods to detect and characterize extrasolar planets. Due to its sensitivity to planets that are otherwise difficult to detect, the microlensing method is complementary to other methods. In particular, the method is sensitive to planets of low-mass stars located at or beyond the snow line, low-mass planets including terrestrial planets (Jung et al., 2014), and even free-floating planets (Sumi et al., 2011). For general review of planetary microlensing, see Gaudi (2012).
The microlensing signal of a planet is usually a short-term perturbation to the smooth and symmetric standard light curve of the primary-induced lensing event (Mao & Paczyński, 1991; Gould & Loeb, 1992). The planetary perturbation occurs when the source approaches planet-induced caustics, that represent the positions on the source plane at which the magnification of a point source would become infinite. For a lens composed of a star and a planet, caustics form a single or multiple sets of closed curves each of which is composed of concave curves that meet at cusps. The number, size, and shape of caustics vary depending on the separation and the mass ratio between the planet and its host star. For a given planetary system, planetary perturbations further vary depending on how the source approaches the lens. As a result, planets exhibit very diverse signals in lensing light curves.
Due to the immense diversity of planetary signals, characterizing a microlensing planet is a difficult task. This characterization is done from modeling in which an observed lensing light curve is compared to numerous theoretical curves resulting from various combinations of the parameters describing the lens and the source. In this process, it is often confronted that solutions of different lensing parameters result in similar light curves and can explain the observed light curve. This degeneracy problem causes difficulty in the unique interpretation of the lens system. Therefore, understanding the causes of various types of degeneracy is very important.
Up to now, it is known that there exist three broad categories of degeneracy in the interpretation of planetary microlensing signals. The first category corresponds to the case for which the degeneracy occurs when different planetary systems induce similar caustics. Good examples are the “close/wide” degeneracy for binary-lens events (Griest & Safidazeh, 1998; Dominik, 1999; An, 2005) and the “ecliptic” degeneracy for events affected by parallax effects (Skowron et al., 2011). The second category is that the degeneracy occurs when light curves accidentally appear to be similar despite the fact that the caustics of the degenerate solutions are very different. Choi et al. (2012) presented two examples of events for which an observed perturbation could be interpreted by either a planetary or a binary companion. The third category is that perturbations can be interpreted by solutions of totally different origins. A good example is the binary-lens/binary-source degeneracy (Gaudi, 1998; Gaudi & Han, 2004; Hwang et al., 2013).
In this work, we show that incomplete coverage of a perturbation can also result in degenerate solutions even for events where the planetary signal is detected with a high level of statistical significance. We demonstrate the degeneracy for an actually observed event OGLE-2012-BLG-0455/MOA-2012-BLG-206.
2. Observation
The microlensing event OGLE-2012-BLG-0455/MOA-2012-BLG-206 occurred on a star located close to the Galactic center with equatorial coordinates , corresponding to the Galactic coordinates . The lensing induced brightening of the source star was first noticed on April 16, 2012 from the lensing survey conducted by the Optical Gravitational Lensing Experiment (OGLE: Udalski, 2003) using the 1.3m Warsaw telescope of Las Campanas Observatory in Chile. The event was independently detected from the survey done by the Microlensing Observations in Astrophysics (MOA: Bond et al., 2001; Sumi et al., 2003) group using the 1.8m telescope of Mt. John Observatory in New Zealand. Based on real-time modeling of OGLE and MOA data (posted on their web sites111 http://ogle.astrouw.edu.pl,222 http://www.phys.canterbury.ac.nz/moa), the Microlensing Follow-Up Network (FUN: Gould et al., 2006) issued a second level alert just 9 hours before the peak, predicting that the event would be very high magnification () and so would be extremely sensitive to planets (Griest & Safidazeh, 1998). In response to the high-magnification alert, data were taken first by using the 0.36m telescope of Kleinkaroo Observatory (KKO) in South Africa and subsequently by using the 1.3m SMARTS telescope of Cerro Tololo Inter-American Observatory (CTIO) in Chile and the 0.4m telescope of Auckland observatory in New Zealand. From follow-up observations, the peak of the event was densely covered, especially by the CTIO data, that are composed of 55 images in I, 8 images in V, and 295 images in H band. The total number of measurement is 6963. However, the coverage is not complete because the event occurred during the early Bulge season when the duration of Galactic-bulge visibility was short and follow-up observation in other parts of the Earth was not fully operational.
The OGLE and MOA data were reduced using photometry codes developed by the individual groups, based on the Difference Image Analysis technique (Alard & Lupton, 1998; Woźniak et al., 2000; Bond et al., 2001). The FUN data were initially reduced by DoPHOT pipeline (Schechter et al., 1993) and were reprocessed using the pySIS package (Albrow et al., 2009) to refine the photometry. Photometric errors estimated by different photometry systems may vary. Futhermore, error bars of each data set may deviate from the dispersion of the data points due to systematics in the photometry system. In order to use data sets collected from different observatories, we therefore normalize error bars. For this, we first add a quadratic term so that the cumulative distribution of ordered by magnification is approximately linear to ensure that the dispersion of the data points is consistent with error bars regardless of the source brightness. We then rescale the errors so that per degree of freedom (/dof) for each data set becomes unity to ensure that each data set is fairly weighted according to error bars.
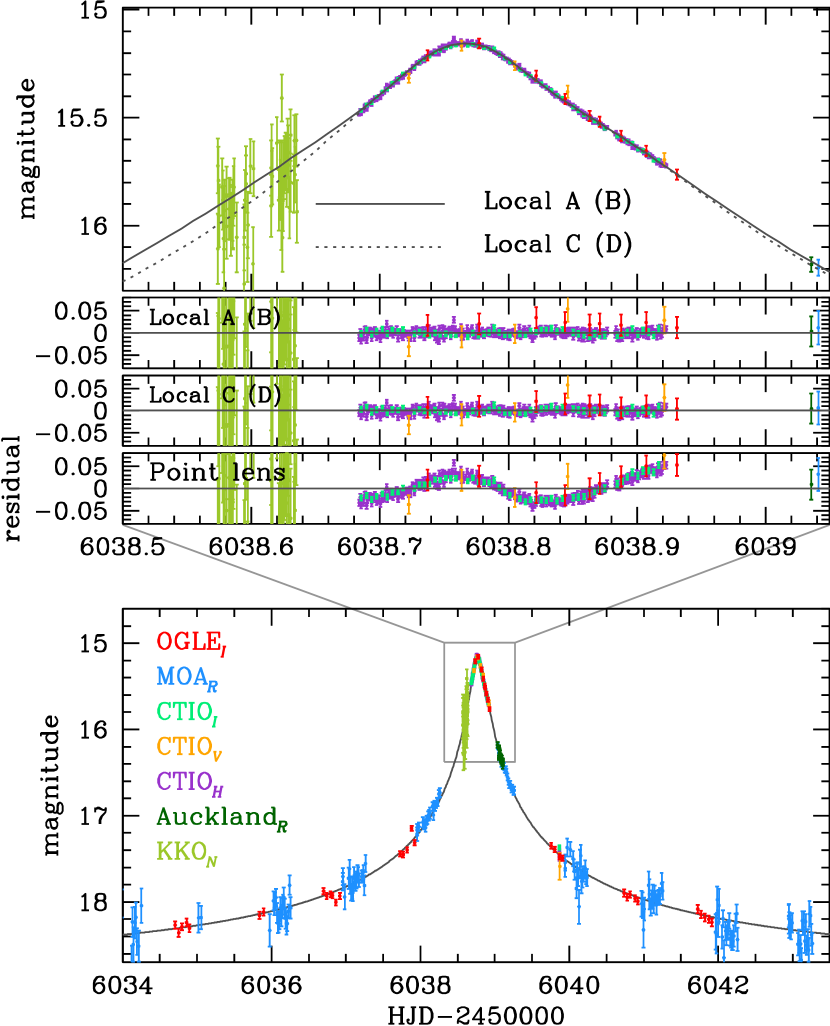
In Figure 1, we present the light curve of the event. The event reached a magnification at the peak.333 We note that the apparent lensing magnification , corresponding to the magnitude change mag, is much smaller than the measured magnification , because the lensed star is heavily blended with other neighboring stars. At a glance, the light curve appears to have a standard form of an event caused by a point mass. However, a single-lens fit leaves significant residual near the peak. Such a deviation at the peak is typically produced by either a planetary or a binary companion to the primary lens.
3. Modeling
Keeping the possible cause of the perturbation in mind, we analyze the light curve based on two point-mass lens modeling. Basic description of a binary-lens event requires 7 parameters. Among them, the first three describe the lens-source approach, including the time of the closest approach of the source to a reference position of the binary lens, , the lens-source separation at in units of the angular Einstein radius of the lens, , and the time required for the source to cross the Einstein radius, (Einstein time scale). Another three parameters describe the two-point lens, including the projected binary separation in units of the Einstein radius, , the mass ratio between the lens components, , and the angle between the source trajectory and the binary axis, . The last parameter is the ratio of the angular source radius to the Einstein radius, (normalized source radius), which is needed to describes the effect of the extended source on the light curve.
Besides the basic lensing parameters, additional parameters are often needed to describe subtle deviations of lensing light curves caused by second-order effects. One such an effect is the orbital motion of a binary lens, which induces variation of the caustic shape during the magnification phase (Albrow et al., 2000; An, 2005; Penny et al., 2011; Shin et al., 2011; Park et al., 2013). Another effect is caused by the orbital motion of the Earth which results in deviation of the source motion from rectilinear (Gould, 1992). The latter effect is often referred to as parallax effect. We find that these effects are not important for OGLE-2012-BLG-0455/MOA-2012-BLG-206 mainly due to the relatively short duration of the event and moderate photometric quality in the wing and baseline.
The search for the best-fit solution of the lensing parameter is conducted in two steps. In the first step, we conduct grid search in the parameter space in order to locate all possible local minima. In this process, the remaining parameters are searched by a downhill approach to yield minimum at each grid point. In the second step, we investigate the individual local minima found from the initial search. At this stage, we refine each local minimum by allowing all parameters to vary. For minimization, we use the Markov Chain Monte Carlo (MCMC) method.
| Parameters | Local A | Local B | Local C | Local D |
|---|---|---|---|---|
| 6963.6/6956 | 6962.7/6956 | 6957.6/6956 | 6957.7/6956 | |
| (HJD-2450000) | 6038.7683 0.0004 | 6038.7689 0.0004 | 6038.7768 0.0005 | 6038.7770 0.0005 |
| () | 2.32 0.17 | 2.21 0.10 | 2.14 0.12 | 2.23 0.17 |
| (days) | 47.4 3.3 | 50.3 2.3 | 50.1 2.6 | 48.0 3.6 |
| 0.23 0.02 | 4.99 0.39 | 0.77 0.02 | 1.33 0.04 | |
| () | 9.55 2.26 | 11.30 1.74 | 0.07 0.01 | 0.08 0.01 |
| (rad) | 4.777 0.009 | 4.782 0.009 | 4.209 0.003 | 4.211 0.004 |
| () | 1.56 0.12 | 1.35 0.09 | 1.08 0.06 | 1.11 0.09 |
We compute finite-source magnifications by using the inverse ray-shooting method. In this numerical method, uniform rays are shot from the image plane, bent by the lens equation, and arrive at the source plane. We note that the term “inverse” is used to denote that rays are traced backward from the image plane to the source plane. Then, the magnification affected by the extended source is computed as the ratio between the number densities of rays on the source surface and on the image plane (Schneider & Weiss, 1986; Kayser et al., 1986; Wambsganss, 1997). The lens equation of a binary lens is expressed as
| (1) |
where , , and represent the complex notations of the source, lens, and image positions, the overbar denotes complex conjugate, are the mass fractions of the lens components, and the index denote the individual lens components. In computing finite magnifications, we consider the limb-darkening effect of the source star by modeling the surface brightness profile as
| (2) |
where is the linear limb-darkening coefficient, is the passband, and is the angle between the line of sight toward the source star and the normal to the source surface. The limb-darkening coefficients are adopted from Claret (2000) considering the source type estimated based on the location in the color-magnitude diagram. It is estimated that the source type is an F-type main-sequence star with the dereddened color and I magnitude . Based on the source type, we adopt the coefficients , , , and . For the MOA data, which used a non-standard filter system, we choose a mean value of the R and I band coefficients, i.e., .
4. Results
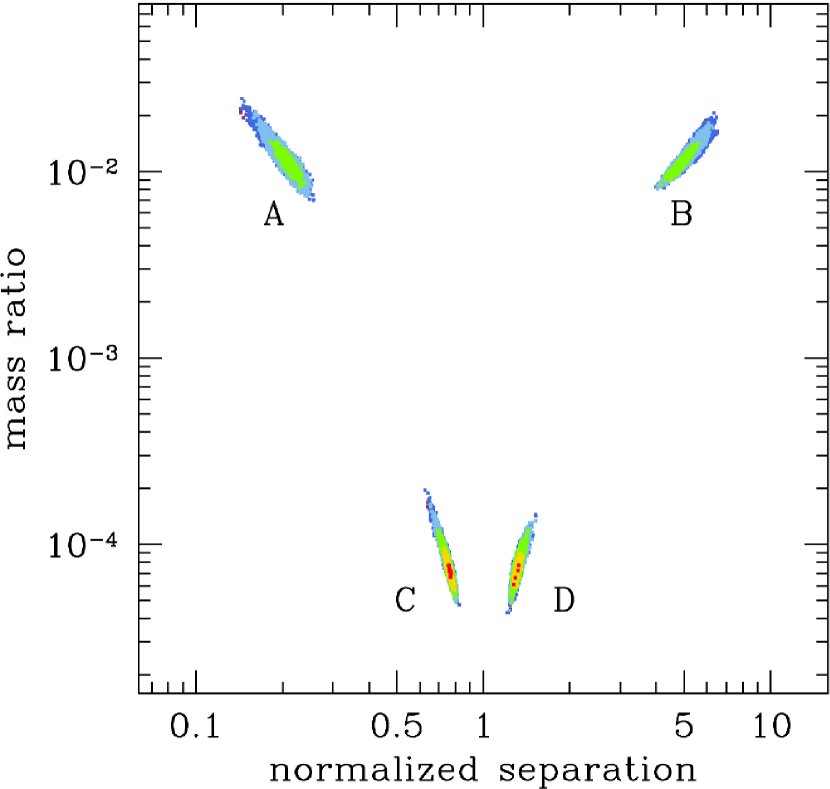
From detailed analysis of the light curve, we find that the light curve significantly deviates from a standard point-mass model with . However, despite such a strong signal, interpreting the deviation is difficult due to the existence of very degenerate local minima in the parameter space. Figure 2 shows the local minima presented as distribution in the parameter space. It is found that there exist 4 distinct local minima. We mark the individual minima as A, B, C, and D. In Table 1, we list the lensing parameters of the individual local minima. We note that the mass ratios of all the minima are less than , implying that the companion is in the planetary mass regime. However, the degeneracy among the local solutions is very severe with for dof=6956444 We note that the source star of the event had been observed since 2010 and thus there exist much more data points not shown in Figure 1. and thus the characteristics of the planet cannot be uniquely determined.
Among the local solutions, the degeneracy between the A-B and C-D pairs are already known. For each of these pairs, the mass ratios are similar but the projected separations have opposites signs of , i.e. . For such pairs of binary lenses, the caustics located near the primary lens induced by the close and wide planetary companions are similar both in size and shape, causing degeneracy in the resulting light curve. This degeneracy, known as the close/wide degeneracy, is caused by the invariance of the caustic under the transformation (Griest & Safidazeh, 1998; Dominik, 1999; An, 2005; Chung et al., 2005).
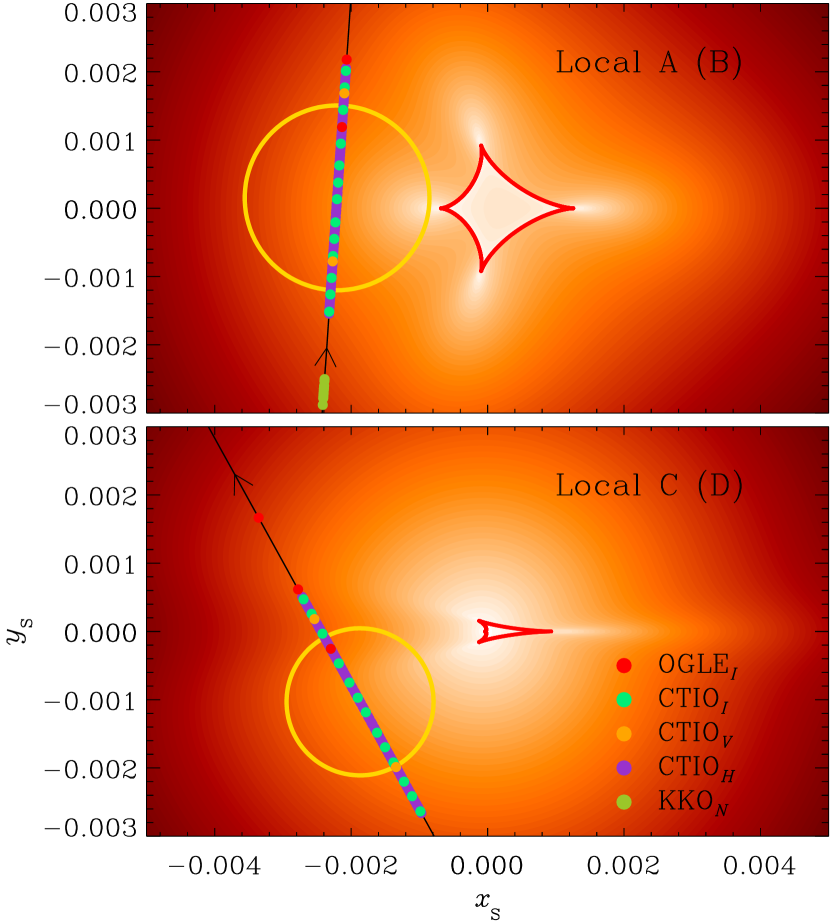
On the other hand, the degeneracy between the A-C and B-D pairs are not previously known. For each of these pairs, the lens systems of the individual local solutions have widely different characteristics. For example, the values of the separation and mass ratio are for the local solution “A” while the values are for the solution “C”. Based on the mass ratio, the individual solutions imply that the planet is either a super Jupiter or a Neptune-mass planet if the primary is a normal star. Due to the wide difference in the planet parameters, the caustics and the magnification patterns around the caustics of the degenerate solutions are greatly different as shown in Figure 3. Despite the difference in caustics, we find that the two solutions are very degenerate with .
Although the former degeneracy is severe because it is intrinsically rooted in the lens equation, the latter degeneracy results from widely different lens systems and thus it might be that the degeneracy could be resolved with additional information. We, therefore, conduct three additional tests to check the feasibility of resolving the degeneracy.
The first test is to compare limb-darkening effects of the source star. For the high mass-ratio solutions (local A and B), the source approaches the caustic close enough for the edge of the source star almost to touch the caustic. For the low mass-ratio solutions (local C and D), on the other hand, the source-caustic separation is relatively wide. Then, the limb-darkening effect would be more important for the high mass-ratio solution than the low mass-ratio solution. We investigate the limb-darkening effect by measuring the color variation in the CTIO I and H data taken during the caustic approach. Unfortunately, the expected color variation from the models is substantially smaller than the photometric errors. Therefore, this method cannot be applied to resolve the degeneracy.
The second test is to compare source fluxes estimated from the degenerate solutions. If they are different, high resolution imaging from either space-based or ground-based adaptive optics observation would enable one to distinguish the solutions by resolving blended stars. However, we find that the source and blend fluxes for the 2 locals are nearly identical and thus the method cannot be applied to resolve the degeneracy, either.
The third test is to compare the relative lens-source proper motions of the two degenerate solutions. If they differ by an amount substantially greater than the measurement error, it would be possible to resolve the degeneracy from future follow-up observation by using high-resolution space or ground-based instrument. We estimate the proper motions by , where the Einstein time scale is measured from light curve modeling and the angular Einstein radius is estimated from the angular source radius and the normalized source radius by . The angular source radius is estimated based on the dereddened color and brightness of the source. The measured values are mas yr-1 for the high mass-ratio solution and mas yr-1 for the low mass-ratio solution. We present two sets of errors where one (in the parenthesis) is estimated just based on the MCMC chain of the solution, while the other value is estimated by adding additional 7% error in quadrature to account for errors accompanied in the color-to- conversion process. The fractional error of the proper-motion difference is . Considering the large fractional error, it would not be easy to resolve the degeneracy by using this method.
Although very degenerate with the current data, however, we find that the latter degeneracy could have been resolved if the perturbation had been continuously and precisely covered by additional data. This can be seen in the model light curves of the two degenerate solutions presented in Figure 1 (solid curve for the high mass-ratio solution and dotted curve for the low mass-ratio solution). It is found that the difference between the two model light curves in the region is considerable, with a maximum magnitude difference reaching magnitude. Although a portion of this region was covered by the KKO data, the event was still quite faint given the smaller aperture (36cm) of the telescope and thus the signal-to-noise ratio was not high enough to distinguish between models. Considering that photometric errors of adjacent data taken by 1-m class telescopes are magnitude, the degeneracy could have been easily resolved if the perturbation had been continuously covered by mid-size telescopes. Therefore, the degeneracy can be attributed to the incomplete coverage of the planetary perturbation. Considering this, the degeneracy is different from the case where degenerate light curves are alike in all parts.
5. Conclusion
We analyzed the high magnification microlensing event OGLE-2012-BLG-0455/MOA-2012-BLG-206 for which the peak of the light curve exhibited anomaly. Despite a large deviation from a standard point-mass model, it was found that there existed 4 very degenerate local solutions. While two of these were due to the well-known “close/wide” degeneracy, the other degeneracy, between high and low mass ratios q, was previously unknown. From the fact that the model light curves of the latter degeneracy substantially differed in the parts that were not covered by observation, it was found that the degeneracy was caused by the incomplete coverage of the perturbation. Therefore, the event illustrated the importance of continuous coverage of perturbations for accurate determinations of lens properties.
It is expected that the frequency of the degeneracy introduced in this work will be greatly reduced with the improvement of lensing surveys. Recently, there has been such improvement for the existing lensing surveys. For example, The observation cadence of the OGLE lensing survey was substantially increased with the adoption of a new wide field camera. The recent joint of the Wise survey (Shvartzvald et al., 2014) being conducted in Israel enables more continuous event coverage by filling the gap between telescopes in Oceania and Chile. Furthermore, there are plans for future lensing surveys. For example, the MOA group plans to additionally locate a new telescope in Africa for better coverage of lensing events. In addition, the Korea Microlensing Telescope Network (KMTNet) will start operation from the 2014 season by using a network of telescopes at three different locations of the Southern Hemisphere (Chile, South Africa, and Australia). The KMTNet project plans to achieve 10-minute cadence. In addition to survey experiments, there also has been important progress in follow-up experiments. The most important is the completion of Las Cumbres Observatory Global Telescope Network, which is an integrated set of robotic telescopes distributed around the world, including two 2-m telescopes in Hawaii and Australia and nine 1-m telescopes sited in Chile, South Africa, Australia, and Texas (Tsapras et al., 2009). With the expansion of both survey and follow-up experiments, round-the-clock coverage of lensing events will be possible and the occurrence of the degeneracy will be greatly decreased.
References
- Alard & Lupton (1998) Alard, C., & Lupton, R. H. 1998, ApJ, 503, 325
- Albrow et al. (2000) Albrow, M. D., Beaulieu, J.-P., Caldwell, J. A. R., et al. 2000, ApJ, 534, 894
- Albrow et al. (2009) Albrow, M. D., Horne, K., Bramich, D. M., et al. 2009, MNRAS, 397, 2099
- An (2005) An, J. H. 2005, MNRAS, 356, 1409
- Bond et al. (2001) Bond, I. A., Abe, F., Dodd, R. J., et al. 2005, MNRAS, 327, 868
- Claret (2000) Claret, A. 2000, A&A, 363, 1081
- Choi et al. (2012) Choi, J.-Y., Shin, I.-G., Han, C., et al. 2012, ApJ, 756, 48
- Chung et al. (2005) Chung, S.-J., Han, C., Park, B.-G., et al. 2005, ApJ, 630, 535
- Dominik (1999) Dominik, M. 1999, A&A, 349, 108
- Gaudi (1998) Gaudi, B. S. 1998, ApJ, 506, 533
- Gaudi (2012) Gaudi, B. S. 2012, ARA&A, 50, 411
- Gaudi & Han (2004) Gaudi, B. S., & Han, C. 2004, ApJ, 611, 528
- Gould (1992) Gould, A. 1992, ApJ, 392, 442
- Gould & Loeb (1992) Gould, A., & Loeb, A. 1992, ApJ, 396, 104
- Gould et al. (2006) Gould, A., Udalski, A., An, D., et al. 2006, ApJ, 644, 37
- Griest & Safidazeh (1998) Griest, K., & Safizadeh, N. 1998, ApJ, 500, 37
- Hwang et al. (2013) Hwang, K.-H., Choi, J.-Y., Bond, I. A., et al. 2013, ApJ, 778, 55
- Jung et al. (2014) Jung, Y. K., Park, H., Han, C., et al. 2014, ApJ, in press
- Kayser et al. (1986) Kayser, R., Refsdal, S., & Stabell, R. 1986, A&A, 166, 36
- Mao & Paczyński (1991) Mao, S., & Paczyński, B. 1991, ApJ, 374, 37
- Park et al. (2013) Park, H., Udalski, A., Han, C., et al. 2013, ApJ, 778, 134
- Penny et al. (2011) Penny, M. T., Mao, S., & Kerins, E. 2011, MNRAS, 412, 607
- Schechter et al. (1993) Schechter, P. L., Mateo, M., & Saha, A. 1993, PASP, 105, 1342
- Schneider & Weiss (1986) Schneider, P., & Weiss, A. 1986, A&A, 164, 237
- Shin et al. (2011) Shin, I.-G., Udalski, A., Han, C., et al. 2011, ApJ, 735, 85
- Shvartzvald et al. (2014) Shvartzvald, Y., Maoz, D., Kaspi, S., et al. 2014, MNRAS, 439, 604
- Skowron et al. (2011) Skowron, J., Udalski, A., Gould, A., et al. 2011, ApJ, 738, 87
- Sumi et al. (2003) Sumi, T., Abe, F., Bond, I. A., et al. 2003, ApJ, 591, 204
- Sumi et al. (2011) Sumi, T., Kamiya, K., Bennett, D. P., et al. 2011, Nature, 473, 349
- Tsapras et al. (2009) Tsapras, Y., Street, R., Horne, K., et al. 2009, Astron. Nachr., 330, 4
- Udalski (2003) Udalski, A. 2003, Acta Astron., 53, 291
- Wambsganss (1997) Wambsganss, J. 1997, MNRAS, 284, 172
- Woźniak et al. (2000) Woźniak, P. R. 2000, Acta Astron., 50, 421