Unsupervised Anomaly-based Malware Detection using Hardware Features
Abstract
Recent works have shown promise in using microarchitectural execution patterns to detect malware programs. These detectors belong to a class of detectors known as signature-based detectors as they catch malware by comparing a program’s execution pattern (signature) to execution patterns of known malware programs. In this work, we propose a new class of detectors — anomaly-based hardware malware detectors — that do not require signatures for malware detection, and thus can catch a wider range of malware including potentially novel ones. We use unsupervised machine learning to build profiles of normal program execution based on data from performance counters, and use these profiles to detect significant deviations in program behavior that occur as a result of malware exploitation. We show that real-world exploitation of popular programs such as IE and Adobe PDF Reader on a Windows/x86 platform can be detected with nearly perfect certainty. We also examine the limits and challenges in implementing this approach in face of a sophisticated adversary attempting to evade anomaly-based detection. The proposed detector is complementary to previously proposed signature-based detectors and can be used together to improve security.
1 Introduction
Malware infections have plagued organizations and users for years, and are growing stealthier and increasing in number by the day. In response to this trend, defenders have created commercial anti-virus protections, and are actively researching better ways to detect malware. An emerging and promising approach to detect malware is to build malware detection systems in hardware [5]. The idea is to use information easily available in hardware (typically through performance counters) to detect malware. It has been argued that hardware malware schemes are desirable for two reasons: first, unlike software malware solutions that aim to protect vulnerable software with equally vulnerable software 111Software antivirus (AV) systems roughly have the same bug defect density as regular software., hardware systems protect vulnerable software with robust hardware implementations that have lower bug defect density because of their simplicity. Second, while a motivated adversary can evade either defense, evasion is harder in a system that utilizes hardware features. The intuition is that the attacker does not have the same degree of control over low-level hardware execution features as she has with software features. For instance, it is easier to change system calls or file names than modify cache hit rates and branch predictor rates in a really precise way across a range of time scales while still exploiting the system.
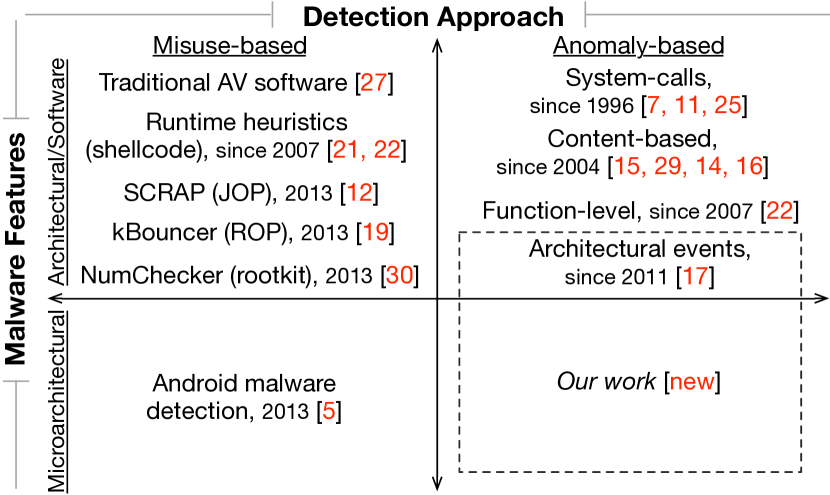
In this paper we introduce a new class of malware detectors known as hardware anomaly-based detectors. All existing malware detection techniques, software or hardware, can be classified along two dimensions: detection approach and the malware features they target, as presented in Figure 1. Detection approaches are traditionally categorized into misuse-based and anomaly-based detection. Misuse detection attempts to flag malware based on pre-identified execution signatures or attack patterns. It can be highly accurate against known attacks, but is extremely susceptible to attacks with slight modifications deviating from the signatures. On the other hand, anomaly-based detection characterizes baseline models of a state of normalcy and identifies attacks based on deviations from the models. Other than being able to target a wide range of attacks, it can potentially identify novel ones. There are a range of features that can be used for detection: until 2013, features used for malware detection were software features such as system call signatures and patterns, or network traffic. Since then, features available in hardware including microarchitectural features have been used for malware detection. As shown in Figure 1, we examine for the first time, the feasibility and limits of performing anomaly-based malware detection using low-level architectural and microarchitectural features available from hardware performance counters (HPCs).
A typical malware infection can be understood as a two-stage process, exploitation and take-over. In the exploitation stage, an adversary exercises a bug in the victim program to hijack control of the victim program execution. Exploitation is then followed by more elaborate procedures to download and install a payload such as a keylogger. Prior work on hardware-level malware detection such as [5] has focused on flagging Android malicious apps by detecting payloads. Detecting malware during exploitation not only gives more lead time for mitigations but can also act as an early threat predictor to improve the accuracy of subsequent signature-based detection of payloads.
The key intuition for anomaly-based detection stems from the observation that the malware, during the exploitation stage, alters the original program flow to execute peculiar non-native code in the context of the victim program. Such unusual code execution will cause perturbations to dynamic execution characteristics of the program, and if these perturbations are observable they can form the basis for the detection of malware exploits. Since exploits manipulate execution flow within the victim program, the signature-based detection paradigm is not appropriate for detecting exploitation. For instance, a signature-based detector will likely correctly report that IE is executing even when it is infected with malware because the malware executes alongside IE.
In this paper, we model the characteristics of common vulnerable programs such as Internet Explorer 8 and Adobe PDF Reader 9 – two of the most attacked programs, – and investigate if and to what degree malware code execution causes observable perturbations to these characteristics. In this anomaly-based detection approach, intuitively one might expect the deviations caused by exploits to be fairly small and unreliable, especially in vulnerable programs with very varied use such as the ones we used. This intuition is validated in our measurements. On a production Windows machine running on Intel x86 chips, our experiments indicate that distributions of execution measurements from the hardware performance counters are positively skewed, with many values being clustered near zero. This implies minute deviations caused by the exploit code cannot be effectively discerned directly.
However, we show that this problem of identifying deviations from the heavily skewed distributions can be alleviated. We show that by using the power transform to amplify small differences, together with temporal aggregation of multiple samples, we are able to set apart the execution of the exploit within the context of the larger program execution. Further, in a series of experiments, we systematically evaluate the detection efficacy of the models over a range of operational factors, events selected for modeling and sampling granularity. For IE exploitation, we are able to identify 100% of the exploitation epochs with 1.1% false positives. Since exploitation typically occurs across nearly 20 epochs, even with a slightly lower true positive rate with high probability we catch exploitations. These results are achieved at a sampling overhead of 1.5% slowdown using sampling granularity of 512K instructions epochs.
Further, we examine resilience of our detection technique to evasion strategies of a sophisticated adversary. Specifically we model attackers who conduct mimicry attacks by crafting malware to exhibit event characteristics that resemble normal code execution to evade our anomaly detection models. With generously optimistic assumptions about attacker and system capabilities, we demonstrate that the models are susceptible to the mimicry attack. In a worst case scenario, the detection performance deteriorates by up to 6.5%. Due to this limitation we observe that anomaly detectors cannot be the only defensive solution but can be valuable as part of an ensemble of predictors that can include signature-based predictors.
The rest of the paper is organized as follows. We provide a background on modern malware exploits in § 2. We detail our experimental setup in § 3. We present our approach in building models for the study in § 4, and describe the experimental results in § 5. § 6 examines evasion strategies of an adaptive adversary and the impact on detection performance. In § 7, we discuss architectural enhancements that will facilitate better malware detection at the hardware level. § 8 discusses related work, and we conclude in § 9.
2 Background
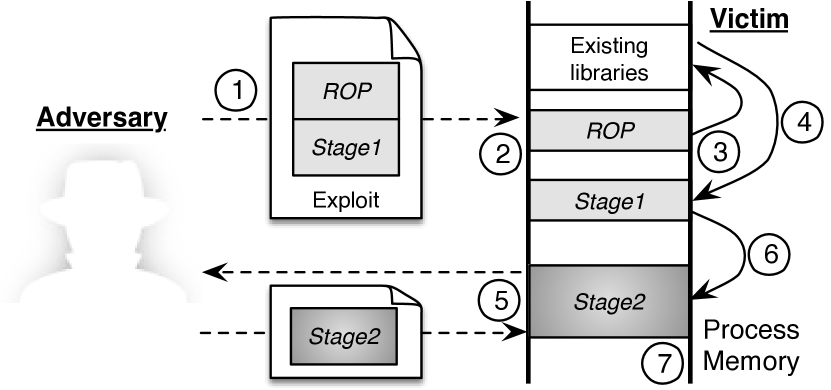
Figure 2 shows a typical multi-stage malware infection process that results in a system compromise. The necessity for its multi-stage nature will become clear as we explain the exploit process in this section.
Triggering the vulnerability First the adversary crafts and delivers the exploit to the victim to target a specific vulnerability known to the adversary (Step \raisebox{-.5pt} {1}⃝). The vulnerability is typically a memory corruption bug; the exploit is typically sent to a victim from a webpage or a document attachment from an email. When the victim accesses the exploit, two exploit subprograms, commonly known as the ROP and Stage1 “shellcodes” load into the memory of the vulnerable program (Step \raisebox{-.5pt} {2}⃝). The exploit then uses the vulnerability to transfer control to the ROP shellcode (Step \raisebox{-.5pt} {3}⃝).
Code Reuse Shellcode (ROP) To prevent untrusted data being executed as code, modern processors provide Data Execution Prevention (DEP) to prevent code from being run from data pages. A problem is that DEP can be toggled by the program itself. This feature is necessary to support JIT compilation. So, to circumvent DEP, the ROP-stage shellcode reuses instructions in the original program binary – hence the name Code Reuse Shellcode – to craft a call to the function that disables DEP for the data page containing the next Stage1 shellcode. The ROP ShellCode then redirects execution to the next stage. (Step \raisebox{-.5pt} {4}⃝) [4, 19].
Stage1 Shellcode This shellcode is typically a relatively small – from a few bytes to about 300 bytes 222As observed at http://exploit-db.com – code stub with exactly one purpose: to download a larger (evil) payload which can be run more freely. To maintain stealth, it downloads the payload in memory (Step \raisebox{-.5pt} {5}⃝).
Stage2 Payload The payload is the final piece of code that the adversary wants to execute on the user machine to perform a specific malicious task. The range of functionality of this payload, commonly a backdoor, keylogger, or reconnaissance program, is in fact unlimited. After the payload is downloaded, the Stage1 shellcode runs that payload as an executable using reflective DLL injection (Step \raisebox{-.5pt} {6}⃝), a stealthy library injection technique that does not require any physical files [6]. By this time, the victim system is fully compromised (Step \raisebox{-.5pt} {7}⃝).
The Stage1 shellcode and Stage2 payload are different in terms of size, design and function, primarily due to the operational constraints on the Stage1 shellcode. When delivering the initial shellcode in the exploit, exploit writers typically try to use as little memory as possible to ensure that the program does not unintentionally overwrite their exploit code in memory. To have a good probability for success this code needs to be small and fast, and thus is written in assembly in very restrictive position-independent memory addressing style. These constraints limit the attackers ability to write very large shellcodes. In contrast, the Stage2 payload does not have all these constraints and can be developed like any regular program. This is similar to how OSes use small assembly routines to bootstrap and then switch to compiled code.
The strategy and structure described above is representative of a large number of malware especially those created with fairly recent web exploit kits [28]. These malware exploits execute completely from memory and in the process context of the host victim program. Further, they maintain disk and process stealth by ensuring no files are written to disk and no new processes are created, and thus easily evade most file based malware detection techniques.
3 Experimental Setup
Do the execution of different shellcode stages exhibit observable deviations from the baseline performance characteristics of the user programs? Can we use these deviations, if any, to detect a malware exploit as early as possible in the infection process? To address these questions, we conduct several feasibility experiments, by building baseline per-program models using machine learning classifiers and examining their detection efficacy over a range of operational factors. Here, we describe various aspects of our experimental setup and detail how we collect and label the performance measurements that are attributed to different stages of malware exploits.
3.1 Exploits
Unlike SPEC [9], there are no standard exploit benchmarks. We created our own exploits for common vulnerable programs from publicly available information. We use exploits that target the security vulnerabilities CVE-2012-4792, CVE-2012-1535 and CVE-2010-2883 on IE 8 and the web plug-ins, i.e., Adobe Flash 11.3.300.257 and Adobe Reader 9.3.4 respectively. We generated the exploits using a widely-used penetration testing tool Metasploit 333http://www.metasploit.com/. We use Metasploit because the exploitation techniques it employs in the exploits are representative of multi-stage nature of real-world exploits.
With Metasploit, besides targeting different vulnerabilities using different ROP shellcode, we also vary both the Stage1 shellcode and the Stage2 final payload used in the exploits. The variability in the generated exploits is summarized in Table 1. For the ROP shellcode stage, the relevant library files, from where the shellcode is derived, are listed.
3.2 Measurement Infrastructure
Since most real-world exploits run on Windows and PDF readers, and none of the architectural simulators can run programs of this scale, we use measurements from production machines. We develop a Windows driver to configure the performance monitoring unit on Intel i7 2.7GHz IvyBridge Processor to interrupt once every N instructions and collect the event counts from the HPCs. We also record the Process ID (PID) of the currently executing program so that we can filter the measurements based on processes.
We collected the measurements from a VMware Virtual Machine (VM) environment, installed with Windows XP SP3 and running a single-core with 512MB of memory. With the virtualized HPCs in the VM, this processor enables the counting of two fixed events (clock cycles, instruction retired) and up to a limit of four events simultaneously. We configured the HPCs to update the event counts only in the user mode.
To ensure experiment fidelity for the initial study, the measurements from the memory buffer are read and transferred via TCP network sockets to a recorder that is deployed in another VM. This recorder saves the stream of measurements in a local file that is used for our analysis.
3.3 Sampling Granularity
We experimented with various sampling interval of N instructions. We chose to begin the investigation with a sampling rate of every 512,000 instructions since it provides a reasonable amount of measurements without incurring too much overhead (See § 5.3.5 for an evaluation of the sampling overhead). Each sample consists of the event counts from one sampling time epoch, along with the identifying PID and exploit stage label.
3.4 Collection of Clean and Infected
Measurements
To obtain clean exploit-free measurements for IE 8, we randomly browsed websites that use different popular web plugins available on IE viz., Flash, Java, PDF, Silverlight, and Windows Media Player extensions. We visited the top 20 websites from Alexa and included several other websites that to widen the coverage of the use of the various plug-ins. Within the browser, we introduced variability by randomizing the order in which the websites are loaded across runs; likewise we accessed websites by clicking links randomly and manually on the webpages. The dynamic content on the websites also perturbs the browser caches. We used a maximum of two concurrent tabs. In addition, we simulated plug-in download and installation functions.
For Adobe PDF measurements, we downloaded 800 random PDFs from the web, reserving half of them randomly for training and the other half for testing.
To gather infected measurements, we browse pages with our PDF exploits with the same IE browser that uses the PDF plug-in. We use Metasploit to generate these PDF exploits and ensure that both the clean and unclean PDFs had the same distribution of file types, for instance, same amount of Javascript.
We stop gathering infected measurements when we see creation of a new process. Usually the target process becomes unstable due to the corrupted memory state, and the malicious code typically “migrates” itself to another new or existing process to ensure persistence after the execution of the Stage2 payload. This is an indication that the infection is complete.
We use the same input sets for different measurements, and between each run of the exploit, we revert the VM environment to ensure the samples collected from the next run is not contaminated from the previous run.
| Stage | Variation |
|---|---|
| ROP | msvcrt.dll, icucnv36.dll, flash32.ocx |
| Stage1 | reverse_tcp, reverse_http, bind_tcp |
| Stage2 | meterpreter, vncinject, command_shell |
3.5 Bias Mitigation
While there are factors that may affect the results of our measurements, we took care to mitigate some possible biases in our data by ensuring the following during the measurement collection.
Between-run contamination After executing each exploit and collecting the measurements, we restore the VM to the state before the exploit is exercised. This ensures the measurements collected are independent across training and testing sets, and across different clean and exploit runs.
Exploitation bias Loading the exploits in the program in only one way may bias the sampled measurements. To reduce this bias, we collected the measurements while loading the exploit in different ways: (1) We launch the program and load the URL link of the generated exploit page. (2) With an already running program instance, we load the exploit page. (3) We save the exploit URL in a shortcut file and launch the link shortcut with the program.
Network conditions The VM environment is connected to the Internet. To ensure that the different network latencies do not confound the measurements, we configure the VM environment to connect to an internally-configured Squid 444http://www.squid-cache.org/ proxy and throttle the network bandwidth from 0.5 to 5Mbps using Squid delay pools. We vary the bandwidth limits while collecting measurements for both the exploit code execution and clean runs.
4 Building Models
To use HPC measurements for anomaly-based detection of malware exploits, we need to build classification models to describe the baseline characteristics for each program we protect. These program characteristics are relatively rich in information and, given numerous programs, manually building the models is nearly impossible. Instead we rely on unsupervised machine learning techniques to dynamically learn possible hidden structure in these data. We then use this hidden structure – aka model – to detect deviations during exploitation.
We rely on a class of unsupervised one-class machine learning techniques for model building. The one-class approach is very useful because the classifier can be trained solely with measurements taken from a clean environment. This removes the need to gather measurements affected by exploit code, which is hard to implement and gather in practice. Specifically, we model the characteristics with the one-class Support Vector Machine (oc-SVM) classifier that uses the non-linear Radial Basis Function (RBF) kernel [23]. In this study, the collection of the labeled measurements is purely for evaluating how effective models are in distinguishing measurements taken in the presence of malware code execution.
| Name | Event Description |
| Architectural Events | |
| Load | Load instructions retired |
| Store | Store instructions retired |
| Arith | Arithmetic instructions retired |
| Br | Branch instructions retired |
| Call | All near call instructions retired |
| Call_D | Direct near call instructions retired |
| Call_ID | Indirect near call instructions retired |
| Ret | Near return instructions retired |
| Microarchitectural Events | |
| Llc | Last level cache references |
| Mis_Llc | Last level cache misses |
| Misp_Br | Mispredicted branch instructions |
| Misp_Ret | Mispredicted near return instructions |
| Misp_Call | Mispredicted near call instructions |
| Misp_Br_C | Mispredicted conditional branch |
| Mis_Icache | I-Cache misses |
| Mis_Itlb | I-TLB misses |
| Mis_Dtlbl | D-TLB load misses |
| Mis_Dtlbs | D-TLB store misses |
| Stlb_Hit | Shared-TLB hits after i-TLB misses |
| %Mis_Llc555These derived events are not directly measured, but are computed using two events monitored and measured by the HPCs. For example, %Misp_Br is computed as . | % of last level cache misses |
| %Misp_Br555These derived events are not directly measured, but are computed using two events monitored and measured by the HPCs. For example, %Misp_Br is computed as . | % of mispredicted branches |
| %Misp_Ret555These derived events are not directly measured, but are computed using two events monitored and measured by the HPCs. For example, %Misp_Br is computed as . | % of mispredicted near RET instructions |
4.1 Feature Selection
While the Intel processor we use for our measurements permits hundreds of events to be monitored using HPCs, not all of them are equally useful in characterizing the execution of programs. We examine most of the events investigated in previous program characterization works [33, 34], and various other events informed by our understanding on the malware behavior. Out of the hundreds of possible events that can be monitored, we shortlisted 19 events for this study in Table 2. We further differentiate between the Architectural events that give an indication of the execution mix of instructions in any running program, and the Microarchitectural ones that are dependent on the specific hardware makeup of a system.
Events with higher discriminative powers The processor is limited to monitoring only up to 4 events at any given time. Even with the smaller list of shortlisted events, we have to select only a subset of events, aka features, that can most effectively differentiate clean execution from infected execution. Since we have at our disposal labeled measurements, we use the Fisher Score (F-Score) to provide a quantitative measure of the how effective a feature can discriminate between measurements in clean executions from those in infected executions. In general, the F-Score is a widely-used feature selection metric that measures the discriminative power of features [35]. A feature with better discriminative power would have a larger separation between the means and standard deviations for samples from different classes. The F-Score gives a measure of this degree of separation. The larger the F-Score, the more discriminative power the feature is likely to have. However, a limitation to using the F-Score is that it does not account for mutual information/dependence between features, but it helps guide our selection of a subset of “more useful” features.
Since we are attempting to differentiate samples with malicious code execution from those without, we compute the corresponding F-Scores for each event. We compute the F-Scores for the different stages of malware code execution for each event and reduce the shortlisted events to the 7 top-ranked events for each of the two categories, as well as for the two categories combined, in Table 3. Each row consists of the top-ranked events for an event category and the exploit stage.
We further select the top 4 events from each row to form 9 candidate event sets that we will use to build the baseline characteristics models of the IE browser. Each model constructed with one set of events can then be evaluated for its effectiveness in the detection of various stages of malware code execution. For brevity, we assign a label (such as A-0 and AM-2) to each set of 4 events in Table 3 and refer to each model based on this set label. We note that the derived events such as %Misp_Br are listed in the table solely for comparison. Computing them requires monitoring two events and reduces the number of features used in the models. Via experimentation, we find that using them in the models does not increase the efficacy of the models. So, we exclude them from the event sets.
Feature Extraction Each sample consists of simultaneous measurements of all the four event counts in one time epoch. We convert the measurements in each sample to the vector subspace, so that each classification vector is represented as as a four-feature vector. Each vector, using this feature extraction method, represents the measurements taken at the smallest time-slice for that sampling granularity. These features will be used to build non-temporal models.
Since we observe that malware shellcode typically runs over several time epochs, there may exist temporal relationships in the measurements that can be exploited. To model any potential temporal information, we extend the dimensionality of each sample vector by grouping the N consecutive samples and combining the measurements of each event to form a vector with features. We use to create sample vectors consisting of 16 features each, so each sample vector effectively represents measurements across 4 time epochs. By grouping samples across several time epochs, we use the synthesis of these event measurements to build temporal models.
With the granularity at which we sample the measurements, the execution of the ROP shellcode occurs within the span of just one sample. Since we are creating vectors with a number of samples as a group, the ROP payload will only contribute to one small portion of a vector sample. So we leave out the ROP shellcode for testing using this form of feature extraction.
| Exploit | Set | Events ranked by F-scores | |||||||
|---|---|---|---|---|---|---|---|---|---|
| Stage | Label | 1 | 2 | 3 | 4 | 5 | 6 | 7 | 8 |
| Architectural Events | |||||||||
| ROP | A-0 | Ret | Call_D | Store | Arith | Call | Load | Call_Id | Br |
| Stage1 | A-1 | Store | Load | Call_ID | Ret | Call_D | Call | Arith | Br |
| Stage2 | A-2 | Store | Call_ID | Ret | Call_D | Call | Arith | Br | Load |
| Microarchitectural Events | |||||||||
| ROP | M-0 | Misp_Br_C | %Misp_Br | Misp_Br | %Misp_Ret | Mis_Itlb | Mis_Llc | Mis_Dtlbs | Misp_Call |
| Stage1 | M-1 | Misp_Ret | Misp_Br_C | %Misp_Ret | %Misp_Br | Mis_Dtlbs | Stlb_Hit | Misp_Br | Mis_Icache |
| Stage2 | M-2 | Misp_Ret | Stlb_Hit | Mis_Icache | Mis_Itlb | %Misp_Ret | Misp_Call | Mis_Llc | Misp_Br_C |
| Both Architectural and Microarchitectural Events | |||||||||
| ROP | AM-0 | Misp_Br_C | %Misp_Br | Misp_Br | %Misp_Ret | Mis_Itlb | Ret | Mis_Llc | Mis_Dtlbs |
| Stage1 | AM-1 | Store | Load | Misp_Ret | Call_ID | Ret | Call_D | Call | Misp_Br_C |
| Stage2 | AM-2 | Store | Call_ID | Misp_Ret | Ret | Call_D | Call | Stlb_Hit | Mis_Icache |
5 Results
5.1 Anomalies Not Directly Detectable
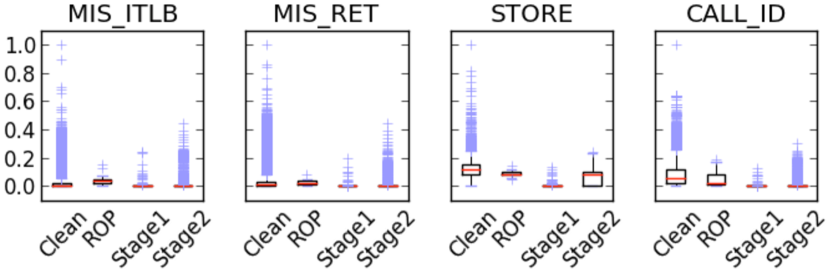
We first investigate if we can gain any insights into the distribution of the event counts for a clean environment and one attacked by an exploit. Without assuming any prior knowledge of the distributions, we use the box-and-whisker plots666The box-and-whisker plot is constructed with the bottom and top of the box representing the first and third quartiles respectively. The red line in the box is the median. The whiskers extend to 1.5 times the length of the box. Any outliers beyond the whiskers are plotted as blue + ticks. of normalized measurements for the different events. These plots provide a visual gauge of the range and variance in the measurements, and an initial indication on how distinguishable the measurements taken with the execution of different stages of malware code are from the clean measurements from an exploit-free environment.
These distribution comparisons suggest that any event anomalies manifested by malware code execution are not trivially detectable, due to two key observations. (1) Most of the measurement distributions are very positively skewed, with many values clustered near zero. (2) Deviations, if any, from the baseline event characteristics due to the exploit code are not easily discerned. These observations are evident in Figure 3, where we present the distribution plots for a few events.
5.1.1 Power Transform
To alleviate this challenge, we rely on a rank-preserving power transform on the measurements to positively scale the values. In the field of statistics, the power transform is a family of functions that is commonly applied to data to transform non-normally distributed data to one that has approximately normal distribution. Used in our context, it has the value of magnifying any slight deviations that the malware code execution may have on the baseline characteristics.
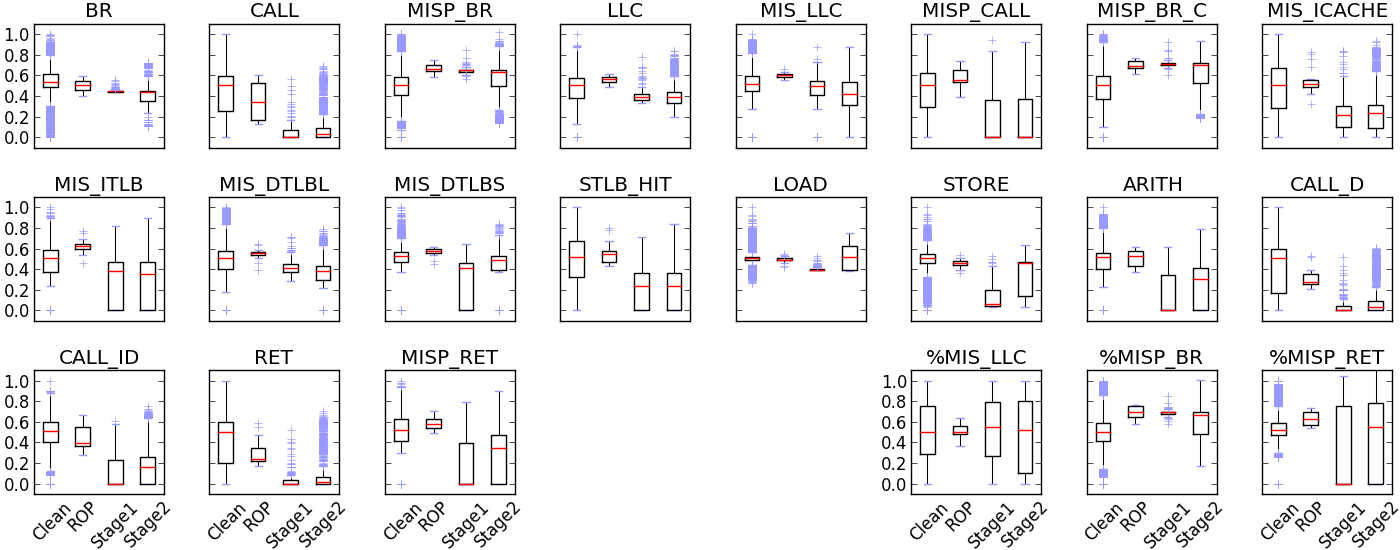
For each event type, we find the appropriate power parameter such that the normalized median is roughly 0.5. We maintain and use this parameter for each event i to scale all its corresponding measurements throughout the experiment. Each normalized and scaled event measurement for event i, , is transformed from the raw value as follows: , where the and are the minimum and maximum values for this event.
Using this power transform, we plot the distributions of all the events, in Figure 4. Now we observe varying deviations from baseline characteristics due to different stages of malware code execution for various event types. Some events (such as Misp_Ret and Store) show relatively larger deviations, especially for the Stage1 exploit shellcode. These events likely possess greater discriminative power in indicating the presence of malware code execution. Clearly, there are also certain events that are visually correlated. The Ret and Call exhibit similar distributions. We can also observe strong correlation between those computed events (such as %Misp_Br) and their constituent events (such as Misp_Br).
5.2 Evaluation Metrics for Models
To visualize the classification performance of the models, we construct the Receiver Operating Characteristic (ROC) curves which plot the percentage of truely identified malicious samples (True positive rate) against the percentage of clean samples falsely classified as malicious (False positive rate). Each sample in the non-temporal model corresponds to the set of performance counter measurements in one epoch; each temporal sample spans over 4 epochs. Furthermore, to contrast the relative performance between the models in the detection of malicious samples, the area under the ROC curve for each model can be computed and compared. This area, commonly termed as the Area Under Curve (AUC) score, provides a quantitative measure of how well a model can distinguish between the clean and malicious samples for varying thresholds. The higher the AUC score, the better the detection performance of the model.
5.3 Detection Performance of Models
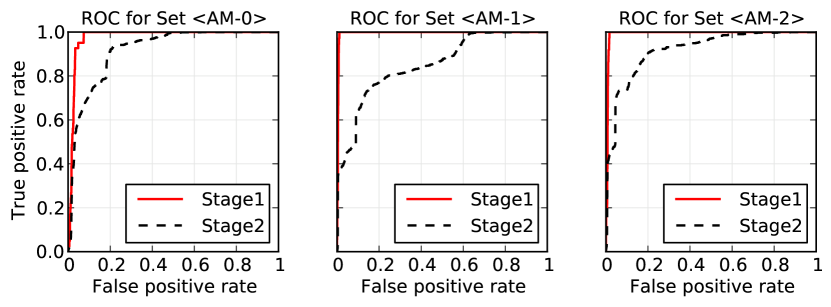
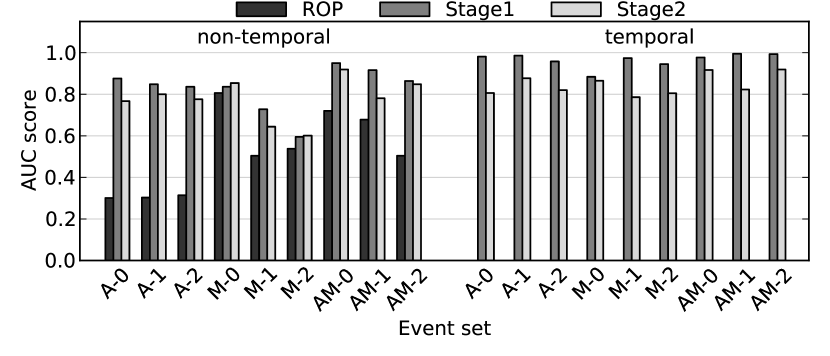
We first build the oc-SVM models with the training data, and then evaluate them with the testing data using the non-temporal and temporal model approaches on the nine event sets. To characterize and visualize the detection rates in terms of true and false positives over varying thresholds, we present the ROC curves of the two approaches in Figures 5 and 6. Due to space constraints, we only present the ROC curves for models that use both instruction-level and microarchitectural events. We also present the overall detection results in terms of AUC scores in Figure 7 and highlight the key observations that affect the detection accuracy of the models below.
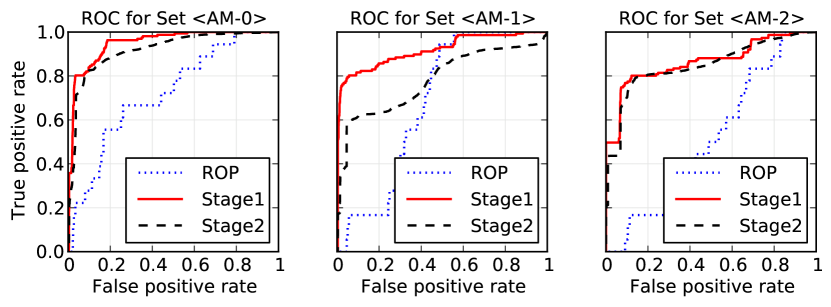
5.3.1 Different Stages of Malware Exploits
We observe that the models, in general, perform best in the detection of the Stage1 shellcode. These results suggest the Stage1 shellcode exhibits the largest deviations from the baseline architectural and microarchitectural characteristics of benign code. We achieve a best-case detection accuracy of 99.5% for Stage1 shellcode with the AM-1 model.
On the other hand, the models show mediocre detection capabilities for the ROP shellcode. The models does not perform well in the detection of the ROP shellcode, likely because the sampling granularity at 512k instructions is too large to capture the deviations in the baseline models. While the Stage1 and Stage2 shellcode executes within several time epochs, we measured that the ROP shellcode takes 2182 instructions on average to complete execution. It ranges from as few as 134 instructions (for the Flash ROP exploit) to 6016 instructions (for the PDF ROP exploit). Since we are keeping the sampling granularity constant, the sample that contains measurements during the ROP shellcode execution will also largely consists of samples from the normal code execution.
5.3.2 Non-Temporal vs Temporal Modeling
We observe that the detection accuracy of the models for all event sets improves with the use of temporal information. By including more temporal information in each sample vector, we reap the benefit of magnifying any deviations that are already observable in the non-temporal approach. For one event set M-2, this temporal approach of building the models improves the AUC score from the non-temporal one by up to 59%.
5.3.3 Architectural vs Microarchitectural Events
Models built using only architectural events generally perform better than those built solely with microarchitectural events. By selecting and modeling both the most discriminative architectural and microarchitectural events together, we can achieve higher detection rates of up to an AUC score of 99.5% for event set AM-1.
5.3.4 Constrained Environments
As described in § 3.2, we collect the measurements in our study from one VM and transfer the measurements to the recorder in another VM to be saved and processed. For brevity, we term this cross-remote-VM scenario where the sampling and the online classification are performed on different VMs as R-1core.
To assess the effect on detection accuracy in the scenario where we deploy both the online classification and the measurement gathering in the same VM, we run the experiment using the model set AM-1 using two additional local-VM scenarios using 1 and 2 cores. We term these two scenarios as L-1core and L-2core respectively. We present the detection AUC scores for the three different scenarios in Table 4. We observe that the detection performance suffers when the online classification detector is deployed locally together with the sampling driver. This can be attributed to the possible noise that is introduced to the event counts while the online detector is continuously running and taking in the stream of samples.
| Scenario | Non-Temporal | Temporal | |||
|---|---|---|---|---|---|
| Label | ROP | Stage1 | Stage2 | Stage1 | Stage2 |
| L-1core | 0.505 | 0.895 | 0.814 | 0.918 | 0.900 |
| L-2core | 0.496 | 0.890 | 0.807 | 0.907 | 0.813 |
| R-1core | 0.678 | 0.916 | 0.781 | 0.995 | 0.823 |
5.3.5 Different Sampling Granularities
While we use the sampling rate of 512k instructions for the above experiments, we also investigate the effect on detection efficacy over a range of sampling granularities.
Furthermore, while the hardware-based HPCs incur a near-zero overhead in the monitoring of the event counts, a software-only implementation of the detector still requires running programs to be interrupted periodically to sample the event counts. This inadvertently leads to a slowdown of the overall running time of programs due to this sampling overhead. To inform the deployment of a software-only implementation of such a detection paradigm, we evaluate the sampling performance overhead for different sampling rates.
To measure this overhead, we vary the sampling granularity and measure the slowdown in the programs from the SPEC 2006 benchmark suite [9]. We also repeated the experiments using the event set AM-1 to study the effect of sampling granularity has on the detection accuracy of the model. We plot the execution time slowdown over different sampling rates with the corresponding detection AUC scores for various malware exploit stages in Figure 8.
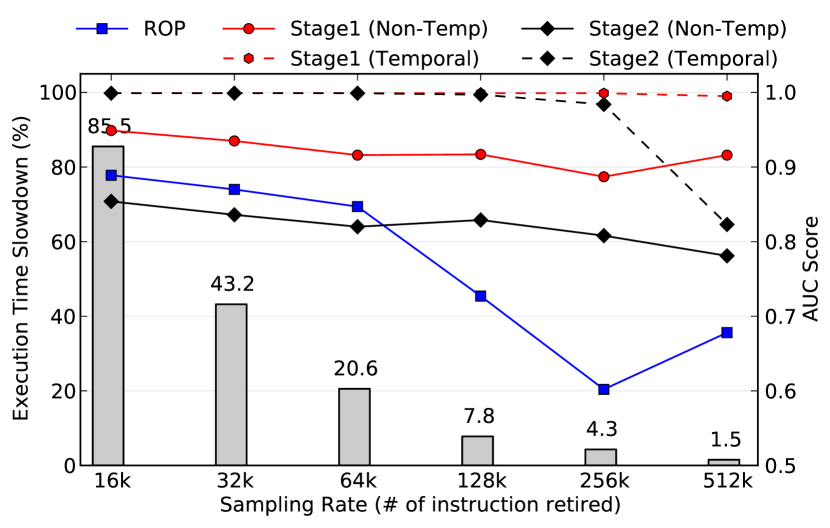
We observe that the detection performance generally deteriorates with coarser-grained sampling. This is a result of the imprecise sampling technique used. For example, during the span of instructions retired in one sample, while we may label these measurements as belonging to a specific process PID, the measurements in this sample may also contain measurements belonging to other processes context-switched in and out during the span of this sample. This "noise" effect becomes more pronounced with a coarser-grained sampling rate and deteriorates the detection performance. Nonetheless, we note that the reduction in sampling overhead at coarser-grained rates far outstrips the decrease in detection performance.
5.4 Results for Adobe PDF Reader
Due to space constraints, we do not present the full results from our experiments on the stand-alone Adobe PDF Reader. For brevity, we present the AUC detection performance of the models built with the event sets AM-0,1,2 in Table 5. Compared to the models for IE, the detection of ROP and Stage1 shellcode generally improves for the Adobe PDF Reader. We even achieve an AUC score of 0.999 with the temporal modeling of the AM-1 event set. The improved performance of this detection technique for the PDF Reader suggests that its baseline characteristics are more stable given the less varied range of inputs it handles compared to IE.
| Set | Non-Temporal | Temporal | |||
|---|---|---|---|---|---|
| Label | ROP | Stage1 | Stage2 | Stage1 | Stage2 |
| AM-0 | 0.931 | 0.861 | 0.504 | 0.967 | 0.766 |
| AM-1 | 0.857 | 0.932 | 0.786 | 0.999 | 0.863 |
| AM-2 | 0.907 | 0.939 | 0.756 | 0.998 | 0.912 |
6 Analysis of Evasion Strategies
In general, anomaly-based intrusion detection approaches, such as ours, are susceptible to mimicry attacks. For such an attack to evade detection, with sufficient information about the anomaly detection models, a sophisticated adversary can modify her malware into an equivalent form that exhibits similar baseline architectural and microarchitectural characteristics as the normal programs. In this section, we examine the degree of freedom an adversary has in crafting a mimicry attack and how it impacts the detection efficacy of our models.
Adversary Assumptions We presume the adversary has an exploit that she wants to execute without being detected by our models. We assume the adversary (1) knows all about the target program such as the version and OS to be run on, and (2) is able to gather similar HPC measurements for the targeted program to approximate its baseline characteristics. (3) She also knows the way the events are modeled, but not the exact events used. We highlight three ways the adversary can change her attack while retaining the original attack semantics.
Assumption (3) is a realistic one since the modern processors allow hundreds of possible events to be monitored. While she may uncover the manner the events are modeled, it is difficult to pinpoint the exact subset of four events used given the numerous possible combinations of subsets. Furthermore, even if the entire list of events that can be monitored is available, there may still exist some events (such as events monitored by the power management units) that are not publicly available. Nonetheless, to describe the first two attacks, we optimistically assume that the adversary has full knowledge of all the events that are used in the models.
Attack #1: Padding The first approach is to pad the original shellcode code sequences with "no-op" (no effect) instructions with a sufficient number so that the events manifested by the shellcode match that of the baseline execution of the program. These no-op instructions should modify the measurements for all the events monitored, in tandem, to a range acceptable to the models.
The adversary needs to know the events used by the model a priori, in order to exert an influence over the relevant events. We first explored feasibility of such a mimicry approach by analyzing the Stage1 shellcode under the detection model of event set AM-1. After studying the true positive samples, we observe that the event characteristics exhibited by the shellcode are due to the unusually low counts of the four events modeled. As we re-craft the shellcode at the assembly code level to achieve the mimicry effect, we note four difficulties.
-
1.
To maintain the original semantics of the shellcode code sequences, certain registers need to be saved and subsequently restored. Be it on the stack, heap or other segments, any such operations constitute Store /Load operations, inadvertently affecting both Store and Load events.
-
2.
Some microarchitectural events require more than one instruction to effect a change. For example, to raise the Misp_Ret event counts, code sequences of Ret instructions need to be crafted in a specific order. Insertion of no-ops must be added in segments.
-
3.
We are rarely able to craft no-op instruction segments to modify each event independently. For instance, among the four events modeled in AM-1, the no-op instruction segment can only be crafted to affect the Store counts independently. Some events are modified simultaneously at different degrees with the padding of crafted no-op instruction segments.
-
4.
Insertion position of the no-op instruction segments can be critical to achieve the desired mimicry effect. We notice the use of several loops within the shellcode. If even one no-op segment is inserted into the loops, that results in a huge artificial increase in certain event types, consequently making that code execution look more malicious than usual.
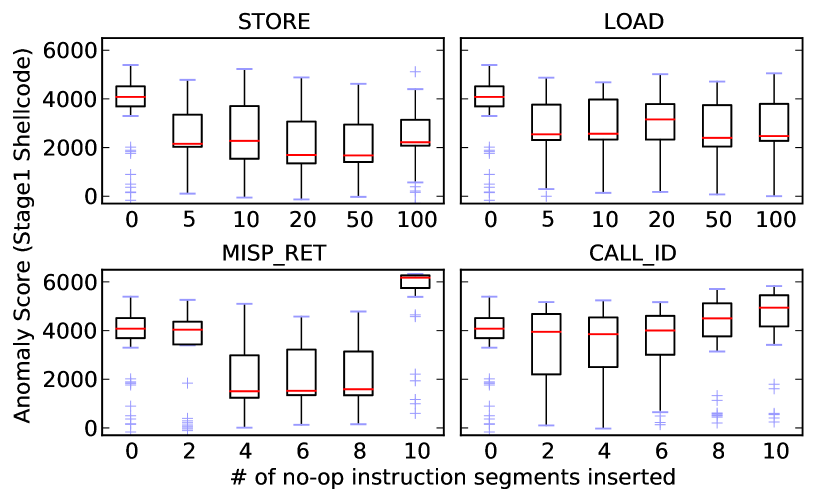
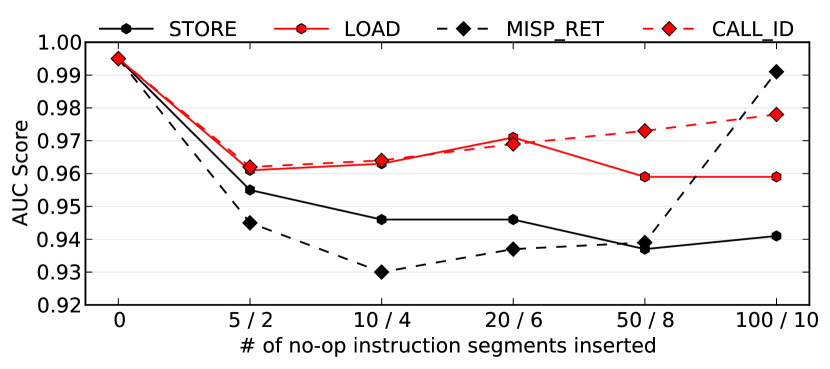
Next, we examine the impact of such mimicry efforts on the detection performance. We pad the Stage1 shellcode at random positions (avoiding the loops) with increasing number of each crafted no-op instruction segment and repeated the detection experiments. In Figure 9, we plot the box-and-whisker plots of the anomaly scores observed from the samples with varying numbers of injected no-op code. In general, the anomaly scores become less anomalous with the padding, until after a tipping point where inserting too many no-ops reverses mimicry effect. In the same vein, we observe in Figure 10 that the detection AUC scores decrease as the samples appear more normal. For the worst case, the detection performance suffers by up to 6.5% just by inserting only the Call_Id no-ops. We did not study combining the no-ops for different events, but we believe it should deteriorate the detection performance further.
Attack #2: Substitution Instead of padding no-ops into original attack code sequences, the adversary can replace her code sequences with equivalent variants using code obfuscation techniques, common in metamorphic malware [1]. Like the former attack, this also requires that the she knows the events used by the models a priori.
To conduct this attack, she must first craft or generate equivalent code variants of code sequences in her exploits, and profile the event characteristics of each variant. Then she can adopt a greedy strategy by iteratively substituting parts of his attack code with the equivalent variants, measuring the HPC events of the shellcode and ditching those variants that exhibit characteristics not acceptable to the models.
However, while this greedy approach will eventually terminate, it warrants further examination as to whether the resulting shellcode modifications suffice to evade the models. We argue that this kind of shellcode re-design is hard and will substantially raise the bar for exploit writers.
Attack #3: Grafting This attack requires either (1) inserting benign code from the target program directly into the exploit code, or (2) co-scheduling the exploit shellcode by calling benign functions (but with no-op effects) within the exploit code. In a sense, this attack grafts its malicious code execution with the benign ones within the target program, thus relieving the need for the knowledge of the events that are modeled. If done correctly, it can exhibit very similar characteristics as the benign code it grafts itself to. As such this represents the most powerful attack against our detection approach.
While we acknowledge that we did not craft this form of attack in our study, we believe that it is extremely challenging to craft such a grafting attack due to the operational constraints on the exploit and shellcode, described in § 2. First, inserting sufficient benign code into the shellcode may exceed the vulnerability-specific size limits and cause the exploit to fail. Second, to use benign functions for the grafting attacks, these functions have to be carefully identified and inserted so that they execute sufficiently to mimic the normal program behavior and yet not interfere with the execution of the original shellcode. Third, the execution of grafted benign code must not unduly increase the execution time of the entire exploit.
6.1 Defenses
Unlike past anomaly-based detection systems that detect deviations based on the syntactic/semantic structure and code behavior of the malware shellcode, our approach focuses on the architectural and microarchitectural side-effects manifested through the code execution of the malware shellcode. While the adversary has complete freedom in crafting her attack instruction sequences to evade the former systems, she cannot directly modify the events exhibited by her attack code to evade our detection approach. To conduct a mimicry attack here, she has to carefully "massage" his attack code to manifest a combination of event behaviors that are accepted as benign/normal under our models. This second-order degree of control over the event characteristics of the shellcode adds difficulty to the adversary’s evasion efforts. On top of this, we discuss further potential defense strategies to mitigate the impact of the mimicry attacks.
Randomization Introducing secret randomizations into the models has been used to strengthen robustness against mimicry attacks in anomaly-based detection systems [2, 29]. In our context, we can randomize the events used in the models by training multiple models using different subsets of the shortlisted events. We can also randomize the choice of model to utilize over time. Another degree of randomization is to change the number of consecutive samples to use for each sample for the temporal models. In this manner, the attacker does not know which model is used during the execution of his attack shellcode. For her exploit to be portable and functional a wide range of targets, she has to modify her shellcode using the no-op padding and instruction substitution mimicry attacks for a wider range of events (and not just the current four events).
To obtain a sense of the diversity introduced with this approach, we assume we have 10 different events as the pool of events we could select for the models, and that we can vary the number of consecutive samples from a range of 3 to 6. With these two degrees of freedom, the number of possible different models that can be constructed is . The number of possibilities increases substantially if we have more events in our pool. Increasing the pool of events from 10 to 20 will then result in , a 23-fold increase.
Multiplexing At the cost of higher sampling overhead, we can choose to sample at a finer sampling granularity and measure more events (instead of the current four) by multiplexing the monitoring as follows. For example, we can approximate the simultaneous monitoring of 8 events across two time epochs by monitoring 4 events in one and another 4 in the other. This affords more dimensionality to the input vectors we use in the models, increasing the efforts needed by the adversary to make all the increased number of monitored event measurements look non-anomalous.
Defense-in-depth Consider a defense-in-depth approach, where this malware anomaly detector using HPC manifestations is deployed with existing anomaly-based detectors monitoring for other features of the malware, such as its syntactic and semantic structure [15, 29, 14, 16] and its execution behavior at system-call level [11, 25, 7, 18, 24] and function level [20]. In such a setting, in order for a successful attack, an adversary is then forced to shape her attack code to conform to normalcy for each anomaly detection model. An open area of research remains in quantifying this multiplicative level of security afforded by the combined use of these HPC models with existing defenses – i.e. examining the difficulty in shaping the malware shellcode to evade statistical and behavioral anomaly detection systems, while at the same time not exhibiting any anomalous HPC event characteristics during execution.
7 Architectural Enhancements
for Detection
Performance counters are typically used for low-level performance analysis and tuning, and for program characterization. In this section we suggest some simple modifications to extend their benefits for detecting malware based on anomalies.
More performance counters Our experiments show that adding events can help better distinguish between benign and malicious code execution. Expanding the set of performance counters that can be monitored concurrently can potentially increase detection fidelity. Cheap hardware mechanisms to observe instruction and data working set changes, and basic-block level execution frequencies can improve malware detection accuracies further.
Interrupt-less periodic access Currently reading performance counters requires the host process to be interrupted. This leads in expensive interrupt-handling cost and undue sampling overhead to the programs. If the performance monitoring units are re-designed with the capability to store performance counter measurements periodically to a designated memory region without generating interrupts, accessing the samples from this region directly will eliminate the sampling overhead. Most importantly, this allows for monitoring at finer granularities to reduce the "noise" effect described in § 5.3.5, and leaves greater scope for better detection.
Custom Accelerators In our work we sample at a very coarse granularity of 512K instructions. Results show that finer granularity sampling can improve detection accuracies. Currently the detector is implemented in software, but at much finer granularities, to keep up with increased data volumes, hardware implementations will likely be necessary and certainly be more energy-efficient compared to software implementations.
Secret Events In this work we have used publicly available performance counters for detecting malware. The malware detector can be built just as well with non-public microarchitectural events. Keeping the events secret increases the difficulty of the attacker to conduct evasion attacks. This model is very similar to how on-chip power controllers operate in modern processors. In the latest Intel and AMD processors, an on-chip microcontroller receives activity factors from various blocks on the chip and uses this information to make power management decisions. Neither the units providing activity factors or the logic/algorithm for making power management decisions are public information, and has been hard to reverse engineer. Further the power management algorithm is not directly accessible to software but during emergencies an exception is delivered to the software. A similar model can be used to build malware detectors.
8 Related Work
The use of low-level hardware features for malware detection instead of software features is a recent development. Demme et al.demonstrates the feasibility of misuse-based detection of Android malware programs using microarchitectural features [5]. While they model microarchitectural signatures of malware programs, we build baseline microarchitectural models of programs we are protecting and detect deviations caused by a potentially wider range of malware (even ones that are previously unobserved). Another key distinction is that we are detecting malware shellcode execution of an exploit within the context of the victim program during the act of exploitation; they target Android malware as whole programs. After infiltrating the system via an exploit, the malware can be made stealthier by installing into peripherals, or by infecting other benign programs. Stewin et al.propose detecting the former by identifying additional memory bus accesses made by the malware [26]. Malone et al.examine detecting the latter form of malicious static and dynamic program modification by modeling the architectural characteristics of benign programs (and excluding the use of microarchitectural events) using linear regression models [17]. Another line of research demonstrates that malware can be detected using side-channel power perturbations they induce in medical embedded devices [3], software-defined radios [8] and even ubiquitous mobile phones [13]. However, Hoffman et al.have shown that the use of such power consumption models can be very susceptible to noise, especially in a device with such widely varied use as the modern smartphone [10].
Besides the HPCs, several works have leveraged other hardware facilities on modern processors to monitor branch addresses efficiently to thwart classes of exploitation techniques. kBouncer uses the Last Branch Recording (LBR) facility to monitor for runtime behavior of indirect branch instructions during the invocation of Windows API for the prevention of ROP exploits [19]. To enforce control flow integrity, CFIMon [31] and Eunomia [32] leverage the Branch Trace Store (BTS) to obtain branch source and target addresses to check for unseen pairs from a pre-identified database of legitimate branch pairs. Unlike our approach to detecting malware, these works are designed to prevent exploitation in the first place, and are orthorgonal to our anomaly detection approach.
9 Conclusions
In this work, we introduce a new class of anomaly-based detectors that use lower-level hardware features to detect malware exploits. Unlike previously proposed signature-based detectors, they can detect novel, unseen malware. Thus they can be used in concert with previously proposed signature-based predictors to better security.
A whole host of advances have enabled the creation of hardware-level anomaly-based malware detectors. First, until very recently (2012), performance counters were not virtualized and it was very difficult to obtain performance data on infected production hardware systems. Second, ironically, the availability of toolkits to create malware also enables us to catch malware better. Like attackers we are able to use toolkits to reproduce real-world exploitations and test detection strategies. Finally, due to advances in computational capacity it has become possible to run sophisticated machine learning algorithms to perform detections in real-time.
While our experiments reveal that malware exploitation can be detected with high accuracy, we also identify opportunities for further advancement. We posit that the detection accuracies can be improved with more microarchitectural observability in form of additional counters. While we used fairly sophisticated ML algorithms, more accurate and faster algorithms are also desirable. Especially, non-linear classifiers such as neural networks may be able learn more about the structure of hidden data to improve detection accuracies. Finally, while our detector is fairly robust to evasion attacks, the resilience can be improved with a little additional hardware support.
This work represents a promising advance in the field of hardware malware detection and more broadly how computer architecture research is conducted. Traditionally computer architects have aimed to manually learn program characteristics to exploit common behaviors for performance. The effort is made difficult due to program diversity and growth. In this work we show program features can be learned in an automated way. The adoption of these techniques may enable more performant and secure machines in the future.
References
- [1] J.-M. Borello and L. Mé. Code obfuscation techniques for metamorphic viruses. Journal in Computer Virology, 4(3):211–220, 2008.
- [2] D. Bruschi, L. Cavallaro, and A. Lanzi. An efficient technique for preventing mimicry and impossible paths execution attacks. In Performance, Computing, and Communications Conference, 2007. IPCCC 2007. IEEE Internationa, pages 418–425. IEEE, 2007.
- [3] S. S. Clark, B. Ransford, A. Rahmati, S. Guineau, J. Sorber, K. Fu, and W. Xu. WattsUpDoc: Power Side Channels to Nonintrusively Discover Untargeted Malware on Embedded Medical Devices. In USENIX Workshop on Health Information Technologies, Aug 2013.
- [4] Corelan Team. Corelan ROPdb. https://www.corelan.be/index.php/security/corelan-ropdb/, Jul 2011.
- [5] J. Demme, M. Maycock, J. Schmitz, A. Tang, A. Waksman, S. Sethumadhavan, and S. Stolfo. On the feasibility of online malware detection with performance counters. In Proceedings of the 40th Annual International Symposium on Computer Architecture, ISCA ’13, pages 559–570, New York, NY, USA, 2013. ACM.
- [6] S. Fewer. Reflective DLL injection. Oct 2008.
- [7] S. Forrest, S. A. Hofmeyr, A. Somayaji, and T. A. Longstaff. A sense of self for unix processes. In Security and Privacy, 1996. Proceedings., 1996 IEEE Symposium on, pages 120–128. IEEE, 1996.
- [8] C. R. A. Gonzalez and J. H. Reed. Detecting unauthorized software execution in sdr using power fingerprinting. In MILITARY COMMUNICATIONS CONFERENCE, 2010-MILCOM 2010, pages 2211–2216. IEEE, 2010.
- [9] J. L. Henning. Spec cpu2006 benchmark descriptions. SIGARCH Comput. Archit. News, 34(4):1–17, Sept. 2006.
- [10] J. Hoffmann, S. Neumann, and T. Holz. Mobile malware detection based on energy fingerprints—a dead end? In Research in Attacks, Intrusions, and Defenses, pages 348–368. Springer, 2013.
- [11] S. A. Hofmeyr, S. Forrest, and A. Somayaji. Intrusion detection using sequences of system calls. Journal of computer security, 6(3):151–180, 1998.
- [12] M. Kayaalp, T. Schmitt, J. Nomani, D. Ponomarev, and N. B. Abu-Ghazaleh. Scrap: Architecture for signature-based protection from code reuse attacks. In HPCA, pages 258–269, 2013.
- [13] H. Kim, J. Smith, and K. G. Shin. Detecting energy-greedy anomalies and mobile malware variants. In Proceedings of the 6th international conference on Mobile systems, applications, and services, pages 239–252. ACM, 2008.
- [14] D. Kong, D. Tian, P. Liu, and D. Wu. Sa3: Automatic semantic aware attribution analysis of remote exploits. In Security and Privacy in Communication Networks, pages 190–208. Springer, 2012.
- [15] C. Krügel, T. Toth, and E. Kirda. Service specific anomaly detection for network intrusion detection. In Proceedings of the 2002 ACM symposium on Applied computing, pages 201–208. ACM, 2002.
- [16] M. V. Mahoney. Network traffic anomaly detection based on packet bytes. In Proceedings of the 2003 ACM symposium on Applied computing, pages 346–350. ACM, 2003.
- [17] C. Malone, M. Zahran, and R. Karri. Are hardware performance counters a cost effective way for integrity checking of programs. In Proceedings of the sixth ACM workshop on Scalable trusted computing, STC ’11, pages 71–76, New York, NY, USA, 2011. ACM.
- [18] C. Marceau. Characterizing the behavior of a program using multiple-length n-grams. In Proceedings of the 2000 workshop on New security paradigms, pages 101–110. ACM, 2001.
- [19] V. Pappas, M. Polychronakis, and A. D. Keromytis. Transparent rop exploit mitigation using indirect branch tracing. In Proceedings of the 22nd USENIX conference on Security, SEC’13, pages 447–462, Berkeley, CA, USA, 2013. USENIX Association.
- [20] S. Peisert, M. Bishop, S. Karin, and K. Marzullo. Analysis of computer intrusions using sequences of function calls. Dependable and Secure Computing, IEEE Transactions on, 4(2):137–150, 2007.
- [21] M. Polychronakis, K. G. Anagnostakis, and E. P. Markatos. Emulation-based detection of non-self-contained polymorphic shellcode. In Recent Advances in Intrusion Detection, pages 87–106. Springer, 2007.
- [22] M. Polychronakis, K. G. Anagnostakis, and E. P. Markatos. Comprehensive shellcode detection using runtime heuristics. In Proceedings of the 26th Annual Computer Security Applications Conference, pages 287–296. ACM, 2010.
- [23] B. Schölkopf, J. C. Platt, J. C. Shawe-Taylor, A. J. Smola, and R. C. Williamson. Estimating the support of a high-dimensional distribution. Neural Comput., 13(7):1443–1471, July 2001.
- [24] R. Sekar, M. Bendre, D. Dhurjati, and P. Bollineni. A fast automaton-based method for detecting anomalous program behaviors. In Security and Privacy, 2001. S&P 2001. Proceedings. 2001 IEEE Symposium on, pages 144–155. IEEE, 2001.
- [25] A. Somayaji and S. Forrest. Automated response using system-call delays. In Proceedings of the 9th USENIX Security Symposium, volume 70, 2000.
- [26] P. Stewin. A primitive for revealing stealthy peripheral-based attacks on the computing platform’s main memory. In Research in Attacks, Intrusions, and Defenses, pages 1–20. Springer, 2013.
- [27] P. Szor. The art of computer virus research and defense. Pearson Education, 2005.
- [28] TrendMicro. The crimeware evolution. http://www.trendmicro.com/cloud-content/us/pdfs/security-intelligence/white-papers/wp-the-crimeware-evolution.pdf, 2012.
- [29] K. Wang, J. J. Parekh, and S. J. Stolfo. Anagram: A content anomaly detector resistant to mimicry attack. In Recent Advances in Intrusion Detection, pages 226–248. Springer, 2006.
- [30] X. Wang and R. Karri. Numchecker: detecting kernel control-flow modifying rootkits by using hardware performance counters. In Proceedings of the 50th Annual Design Automation Conference, DAC ’13, pages 79:1–79:7, New York, NY, USA, 2013. ACM.
- [31] Y. Xia, Y. Liu, H. Chen, and B. Zang. CFIMon: Detecting violation of control flow integrity using performance counters. In Proceedings of the 2012 42nd Annual IEEE/IFIP International Conference on Dependable Systems and Networks (DSN), DSN ’12, pages 1–12, Washington, DC, USA, 2012. IEEE Computer Society.
- [32] L. Yuan, W. Xing, H. Chen, and B. Zang. Security breaches as pmu deviation: detecting and identifying security attacks using performance counters. In APSys, page 6, 2011.
- [33] Shen, K., Zhong, M., Dwarkadas, S., Li, C., Stewart, C., Zhang, X.: Hardware counter driven on-the-fly request signatures. In: Proceedings of the 13th international conference on Architectural support for programming languages and operating systems. pp. 189–200. ASPLOS XIII, ACM, New York, NY, USA (2008), http://doi.acm.org/10.1145/1346281.1346306
- [34] Hoste, K., Eeckhout, L.: Comparing Benchmarks Using Key Microarchitecture-Independent Characteristics. In: Workload Characterization, 2006 IEEE International Symposium on. pp. 83–92. IEEE (Oct 2006), http://dx.doi.org/10.1109/iiswc.2006.302732
- [35] Duda, R.O., Hart, P.E., Stork, D.G.: Pattern Classification, New York: John Wiley & Sons, 2001, pp. xx + 654, isbn: 0-471-05669-3. J. Classif. 24(2), 305–307 (Sep 2007), http://dx.doi.org/10.1007/s00357-007-0015-9