On the impact of radiation pressure on the dynamics and inner structure of dusty wind-driven shells.
Abstract
Massive young stellar clusters are strong sources of radiation and mechanical energy. Their powerful winds and radiation pressure sweep-up interstellar gas into thin expanding shells which trap the ionizing radiation produced by the central clusters affecting the dynamics and the distribution of their ionized gas. Here we continue our comparison of the star cluster winds and radiation pressure effects on the dynamics of shells around young massive clusters. We calculate the impact that radiation pressure has on the distribution of matter and thermal pressure within such shells as well as on the density weighted ionization parameter and put our results on the diagnostic diagram which allows one to discriminate between the wind-dominated and radiation-dominated regimes. We found that model predicted values of the ionization parameter agree well with typical values found in local starburst galaxies. Radiation pressure may affect the inner structure and the dynamics of wind-driven shells significantly but only during the earliest stages of evolution (before Myr) or if a major fraction of the star cluster mechanical luminosity is dissipated or radiated away within the star cluster volume and thus the star cluster mechanical energy output is significantly smaller than star cluster synthetic models predict. However, even in these cases radiation dominates over the wind dynamical pressure only if the exciting cluster is embedded into a high density ambient medium.
1 Introduction
HII regions are fundamental to our understanding of young stellar clusters radiative and mechanical feedback on the interstellar medium (ISM). They are strong sources of emission-line radiation and thus serve as a powerful diagnostic tool to study star formation and the chemical composition of nearby and distant galaxies (Capriotti & Kozminski, 2001; Dopita et al., 2005, 2006; Yeh & Matzner, 2012). They have even been used as tracers of the Hubble expansion (Chávez et al., 2012). The idealized (Strömgren, 1939) model for spherical static HII regions with a homogeneous density distribution was a revolutionary step forward in the study of photoionized nebulae. However the consideration of a number of physical effects have led to a much more robust paradigm. Winds produced by the exciting clusters (Capriotti & Kozminski, 2001; Arthur, 2012; Silich & Tenorio-Tagle, 2013) and the impact that radiation pressure provides on the swept-up interstellar gas (Elmegreen & Chiang, 1982; Capriotti & Kozminski, 2001; Matzner, 2002; Krumholz & Matzner, 2009; Nath & Silk, 2009; Sharma & Nath, 2012) are among such major physical effects. As recently shown by Draine (2011), the absorption of photons emerging from an exciting cluster by either dust grains and recombining atoms, leads to a non homogeneous density distribution even within static or pressure confined HII regions and under certain conditions, radiation pressure may pile up the ionized gas into a thin outer shell, as assumed by Krumholz & Matzner (2009). The action of cluster winds, as well as the strong evolution that the ionizing photon flux and the star cluster bolometric luminosity suffer after the first supernova explosion make the situation even more intricate (Silich & Tenorio-Tagle, 2013).
The thermalization of the stellar winds and supernovae mechanical energy through nearby random collisions leads to a high central overpressure which forms a strong shock that moves supersonically and sweeps the ambient ionized gas into a thin, wind-driven shell. This shell cools down in a short time scale and begins to absorb ionizing photons causing the ionization front to move back towards the cluster and finally become trapped within the shell. The size and density distribution of such ionized shells have little to do with the original Strömgren model. Their evolution depends not only on the ambient gas density distribution and the available Lyman continuum, but also on the mechanical power of the exciting cluster. Silich & Tenorio-Tagle (2013, hereafter ST13) discussed the impact that radiation pressure has on the dynamics of wind-driven shells powered by young star clusters and found radiation pressure not to be a dominant factor. They, however, did not consider the detailed impact that radiation pressure provides on the inner shell structure. They also assumed that shells absorb all photons escaping from the central cluster and thus found an upper limit to the radiative feedback from the central cluster on the dynamics of the swept-up shell. Here we extend the analysis provided in ST13 and discuss how radiation pressure affects the distribution of density and thermal pressure within a shell and thus how it may affect the velocity of the outer shock and the dynamics of the ionized gas around young stellar clusters.
The paper is organized as follows: we first present in section 2 the major equations formulated by Draine (2011) for static spherically symmetric HII regions and discuss how the inner and outer boundary conditions affect the solution. In section 3 we discuss different hydrodynamic regimes and also show how Dr11’s equations may be applied to the whole shell, including the outer, non-ionized segments. The results of the calculations are presented and discussed in section 4 where we compare different hydrodynamical models (standard energy and momentum dominated, leaky and low star clusters heating efficiency), calculate the model-predicted values of the ionization parameter and compare them to typical values found in local starburst galaxies. Our results are also placed onto a diagnostic diagram which allows one to discriminate between the radiation pressure and wind pressure (thermal or ram) dominated regimes. The summary of our major results is given in section 5.
2 Radiation pressure in static, dusty HII regions
Let us first consider the idealized model of a static spherically symmetric HII region ionized by a central star cluster and confined by the thermal pressure of the ambient interstellar medium (ISM). Following Draine (2011, hereafter Dr11), we assume that the outward force provided by radiation pressure is balanced by the inward directed thermal pressure gradient. The set of equations describing such HII regions in the presence of dust grains is (see Dr11, ):
| (1) | |||||
| (2) | |||||
| (3) |
where and are the luminosities in ionizing and non-ionizing photons, respectively (, where is the bolometric luminosity of the cluster), is the ionized gas density, is the fraction of the ionizing photons that reaches a surface with radius , where is the number of ionizing photons emitted by the star cluster per second, is the mean energy of the ionizing photons, is the dust absorption optical depth, is the effective dust absorption cross section per hydrogen atom, cm3 s-1 is the recombination coefficient to all but the ground level (Osterbrock, 1989), and are the Boltzmann constant and the speed of light, respectively, and is the ionized gas temperature. It is assumed that the gas in the HII region is completely ionized and has a normal chemical composition with one helium atom per every ten hydrogen atoms. The mean mass per particle and the mean mass per ion then are: and , respectively, where is the proton mass. We set the value of the dust absorption cross section per hydrogen atom to cm2 (Dr11) and assumed that the temperature of the ionized gas is constant and equal to in all our calculations. The first and the second terms on the right-hand side of equation (1) correspond to the photon momentum absorbed by dust grains and by the gas, respectively. The right-hand terms in equation 2 are the rates of absorption of ionizing photons in a thin spherical shell with radius and thickness by recombination and by dust grains, respectively.
In order to select a unique solution of equations (1 - 3), one has to adopt a set of initial or boundary conditions. For example, Draine (2011) selected solutions by choosing the initial value of density at some fixed radius . We use similar initial conditions in the case of the wind-driven shell (see next section), but prefer to select the static solution from the two boundary conditions which are the values of the confining pressure at the inner and outer edges of the HII region. Here we assume that the HII region is static and that the radiation field from the central cluster is strong enough to clean up the central region with a radius as it seems appropriate to many galactic and extragalactic HII regions which are better fitted with models containing an empty central zone in the ionized gas distribution (see Mathews, 1967, 1969; Kewley & Dopita, 2002; Dopita et al., 2003). In such a case, the conditions at the inner edge of the HII region are: , and (see Dr11, ) whereas the value of the initial radius is selected by the outer boundary condition which requires the thermal pressure at the outer edge of the HII region to be equal to that in the ambient ISM. We use in the calculations a value of cm-3 and stop the integration when all ionizing photons are trapped and thus the function becomes equal to zero: .
The input parameters (, and ) for our calculations were taken from the Starburst99 synthesis model (Leitherer et al., 1999) and are summarized in Table 1. Models A, B and C correspond to a M☉ coeval stellar cluster with a standard Kroupa initial mass function with upper and lower cut-off mass of 100 and 0.1 respectively and a turn off mass at 0.5 , metallicity Z☉, age Myr and Padova evolutionary tracks with AGB stars, embedded into an interstellar gas with number density 1 cm-3, cm-3 and cm-3, respectively. Models D, E and F correspond to a two orders of magnitude less massive cluster of the same age located within the same environments.
| Models | ||||
|---|---|---|---|---|
| s-1 | erg s-1 | erg s-1 | cm-3 | |
| A,B,C | 1, 103, 106 | |||
| D,E,F | 1, 103, 106 |
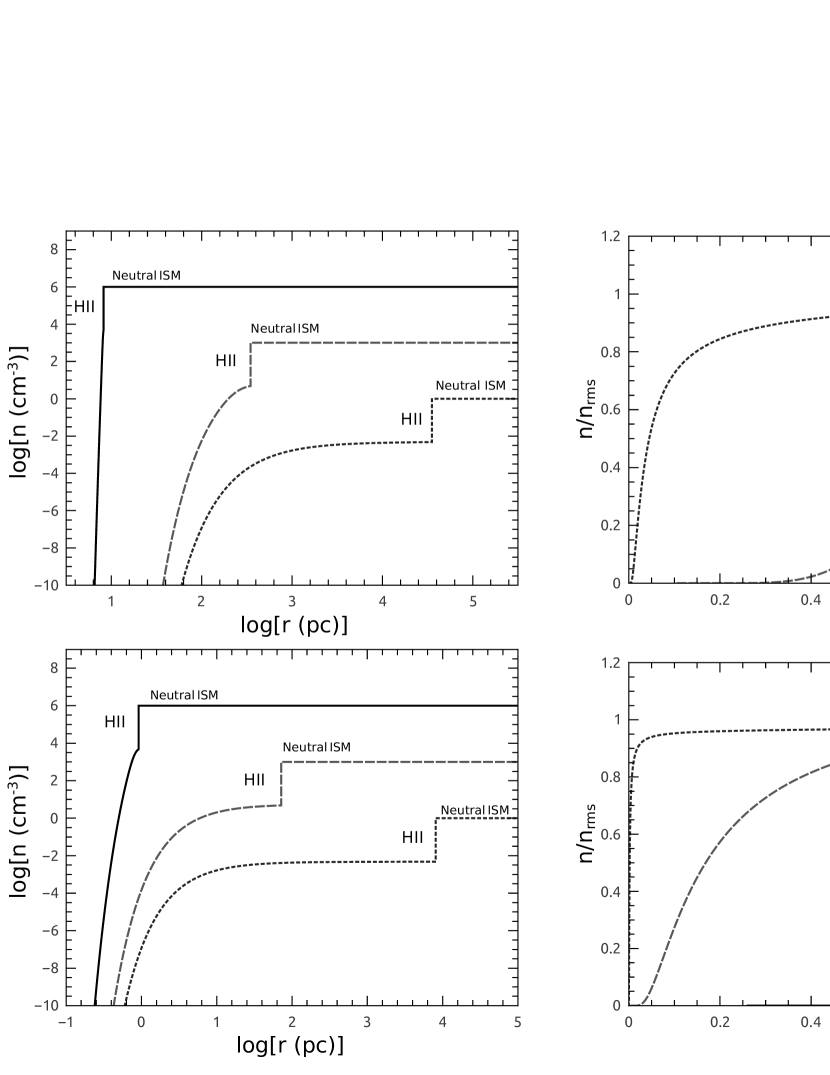
The calculated density distributions for static HII regions with a central cavity are shown in Figure 1. The density grows always rapidly in a very narrow inner zone and then presents an almost even or flat distribution in the rest of the volume if the density of the ambient ISM is not very large (models A, B, D and E). Only when the exciting clusters are embedded into a very high density ambient medium ( cm-3, models C and F) the density of the ionized gas grows continuously across the whole HII region. However, such HII regions are very compact (see left-hand panels in Figure 1). The size of the HII region, , and the radius of the inner empty cavity are both functions of the interstellar ambient density. Both radii grow rapidly as one considers a lower ambient density (see the left-hand side panels in Figure 1 where the steps in the gas density distribution mark the edge of the HII regions and result from the condition that the thermal pressure at the HII region edge ought be equal to that of the ambient neutral gas with a two orders of magnitude lower temperature ( K). This however is not evident when distances are normalized to the radius of the HII region and densities to their rms values as on Figure 2 of Dr11 (see right-hand panels in Figure 1). Thus dimensionless plots do not allow one to realize that static models with a low ambient density are unrealistic as in these cases the required time for the ionized gas re-distribution (the sound crossing time) highly exceeds the characteristics life time of the HII region, Myr.
3 Radiation pressure in dusty wind-driven shells
Given the continuous supply of photons and their instantaneous re-processing by the surrounding gas here we use Dr11’s equations to calculate the impact that radiation pressure has on the structure and on the dynamics of evolving wind-driven shells. We consider a constant density ISM and a set of evolving star cluster parameters to evaluate at consecutive times the impact of radiative pressure on the evolving shells and thus neglect all effects dealing with a plane-stratified density distribution in galactic disks, gas shear and gravity which were thoroughly discussed in our previous papers (see, for example, Tenorio-Tagle & Palous, 1987; Silich, 1992; Silich et al., 1996) and do not present the major aim of this paper. We also do not consider the impact that the ambient pressure provides on the shell dynamics as it is only significant when the shell expansion velocity approaches the sound speed value in the ambient ISM. The distribution of the ionized gas then becomes quasi-static and is defined by the values of thermal pressure at the inner edge of the shell and in the ambient ISM as was discussed in the previous section. In the supersonic regime, which is the case in all our calculations (see Mach number values in the captions to Figures 3 and 4, calculated under the assumption that the sound speeds in the ionized and neutral ISM are 15 km s-1 and 1.04 km s-1, respectively), the rate of mass accumulation by the expanding shell depends on the speed of the leading shock, , where is the thermal pressure value immediately behind the leading shock and is the gas density in the ambient ISM. The impact of the external pressure on the shell dynamics is thus negligible in this case. When a star cluster wind impacts a constant density ISM, a four zone structure is established: there is a central free wind zone, surrounded by a shocked wind region. The latter is separated by a contact discontinuity from the matter swept up by the leading shock which evolves into the constant density ISM (see Weaver et al., 1977; Mac Low & McCray, 1988; Koo & McKee, 1992). In the wind-blown bubble case, the central zones are hot and thus transparent to the ionizing flux as it is also the case in the static HII regions with a central cavity considered in the previous section. However, the density at the inner edge of the ionized shell is not arbitrarily small, but must be selected from the condition that , where and are the thermal pressures at the inner edge of the ionized shell and in the shocked wind region, respectively, and is the radius of the contact discontinuity (the inner radius of the ionized shell). The swept up shell is also hot at first ( K) and thus transparent to the ionizing radiation from the star cluster. However it cools down in a short time scale due to strong radiative cooling. If the density and metallicity of the ambient medium are and , respectively, and the star cluster mechanical luminosity is , the shell characteristic cooling time scale, , is (Mac Low & McCray, 1988):
| (4) |
Only after that time the swept up shell begins to recombine and absorb the ionizing radiation from the central cluster. For erg s-1, and cm-3, Myr while for an ISM with cm-3, Myr. When the wind-driven shell grows thick enough, it absorbs all ionizing photons and then forms an outer neutral skin which absorbs only non-ionizing photons that manage to escape the inner ionized part of the shell. One can calculate how these photons affect the distribution of density and thermal pressure in the neutral part of the shell by removing the ionizing radiation from Dr11’s equations and evaluating the rate at which non-ionizing energy, , escapes from the ionized part of the shell. This leads to the set of equations:
| (5) | |||||
| (6) |
It was assumed in all calculations that the temperature in the outer, neutral part of the shell is constant and equal to K. It was also assumed that the shell is thin and thus the total mass of the shell is .
Thus, the initial conditions which allow one to select a unique solution of equations (1-3) in the case of the wind-blown shell are very similar to those used in the previous section: , and the value of the thermal pressure in the shocked wind zone which depends upon the dynamical time . However the inner radius of the ionized shell and the pressure at the inner edge of the shell at different evolutionary times are calculated from the Weaver et al. (1977) wind-blown bubble model and the integration stops when the total mass of the ionized and neutral segments reaches . We then compare the values of thermal pressures at the outer () and inner () edges of the swept-up shell obtained from the calculations in order to check if radiation pressure may affect the shell dynamics significantly.
In the energy-dominated regime, and are (Bisnovatyi-Kogan & Silich, 1995)
| (7) | |||
| (8) |
where is the interstellar gas density and is the ratio of specific heats. At this stage the free wind occupies only a small fraction of the bubble volume and the value of thermal pressure is defined by the amount of thermal energy accumulated in the shocked wind region and the bubble volume and thus does not depend on the wind terminal speed (see for more details Bisnovatyi-Kogan & Silich, 1995).
The ion number density at the inner edge of the ionized shell then is:
| (9) |
However, evaporation of the swept-up shell into the hot shocked wind region may cause strong radiative cooling and lead to the end of the energy dominated regime. If the star cluster is embedded into an ambient ISM with density , this occurs at (Mac Low & McCray, 1988):
| (10) |
After this time the free wind impacts directly on the shell and the thermal pressure at the inner edge of the swept-up shell is equal to the wind ram pressure , where , is the star cluster mass deposition rate and is the adiabatic wind terminal speed. The shell further expands in the momentum dominated regime as (see ST13, ):
| (11) | |||
| (12) |
The radius of the shell at the time of the transition, , must be calculated by means of equation (7) at . The above equations do not include the momentum of starlight. However, as shown below, this does not make a major difference in the evolution of the wind-blown shells except in the case of a low heating efficiency. Our calculations thus allows one to realize when the standard model assumptions may break down and radiation pressure may affect the dynamics of the wind-driven shells. The ion number density at the inner edge of the ionized shell in this case is:
| (13) |
Note, however, that if thermal conduction and mass evaporation of the outer shell are inhibited by magnetic fields, the radiative losses of energy from the shocked wind region remain negligible and the wind-driven bubble expands in the energy dominated regime during the whole evolution of the HII region (see Silich & Tenorio-Tagle, 2013).
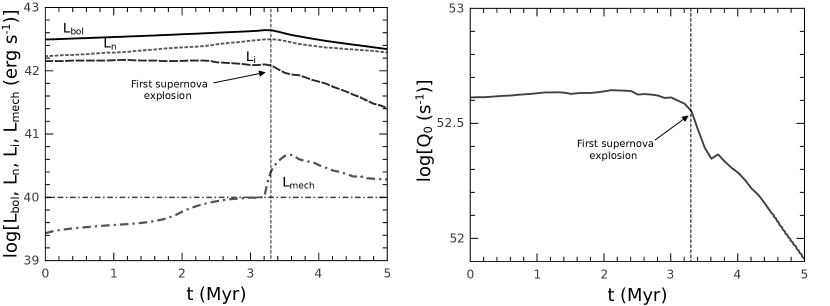
To evaluate the impact that radiation pressure provides on the shell, we run several models (see Table 2) with input parameters , , , and , which one has to know in order to use equations (1 - 3) and (5 - 6), taken from the Starburst99 synthesis code at the corresponding times Myr, 3.3 Myr and 5 Myr, respectively (see Figure 2).
| N | Models | Regime | ||||
|---|---|---|---|---|---|---|
| erg s-1 | cm-3 | Myr | ||||
| 1 | LDS a, b, c | 1 | 0.4 | 1, 3.3, 5 | Low density energy dominated | |
| 2 | LDL a, b, c | 1 | 0.4 | 1, 3.3, 5 | Low density with gas leakage | |
| 3 | HDS a, b, c | 0.4 | 1, 3.3, 5 | High density energy/momentum dominated | ||
| 4 | HDE a, b, c | 0.4 | 1, 3.3, 5 | High density with low heating efficiency |
To calculate the inner radius of the ionized shell and the ionized gas density at the inner edge of the HII region we used equations (7-9) and if equation (10) is fulfilled these were replaced by equations (11-13). Our procedure thus implies that the dynamical evolution of the shell is done through the classical Weaver’s et al. equations, while the density and pressure structure of the swept up shell is evaluated by means of Dr11’s static equations. In all of these, an average mechanical luminosity erg s-1 was used (see the discussion in section 4.2 and in ST13).
4 Results and discussion
4.1 Shells evolving in a low density ISM
We first explore the impact that radiation provides on the wind-driven shells expanding into a low density ambient medium (Table 2, LDS model). Models LDSa, LDSb and LDSc present different evolutionary stages of the “standard bubble model”. In this case the wind-driven shell expands into a low density (1 cm-3) ISM in the energy-dominated regime. In all cases the mass of the driving cluster is and the selected times allow one to see how the ionization structure of the shell changes with time due to the bubble and radiation field evolution.
Figure 3 displays the density (solid lines), thermal pressure (dashed lines) and ram pressure (dotted lines) distributions within and at both sides of the expanding shell, while this is exposed to the radiation from the central cluster.
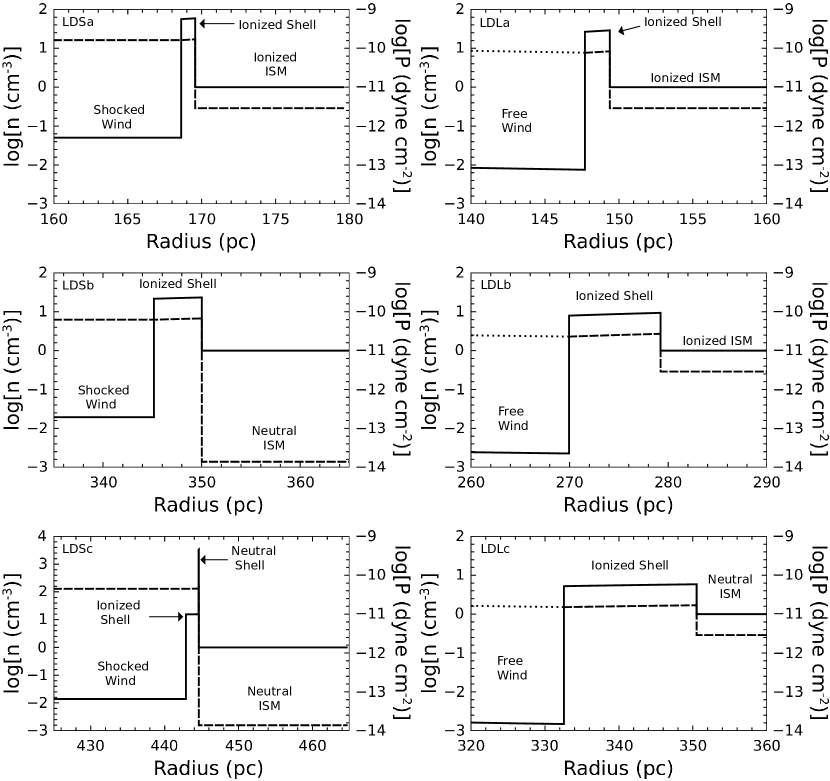
The sudden density jumps at the inner edge of the ionized shell result from the fact that the thermal pressure there must be equal to the thermal pressure of the hot thermalized cluster wind (equations 9) while the temperature in the ionized gas is K. As shown in Figure 3, in the case of model LDSa ( Myr) the swept up shell has already cooled down and is completely photo-ionized by the Lyman continuum from the young central cluster. Furthermore, a fraction of the ionizing photons still escapes from the shell into the ambient ISM keeping it also at K. Model LDSb presents the shell structure at the trapping time, Myr. At this time the shell absorbs all ionizing photons, and the mass of the ionized matter is exactly that of the swept-up shell: . The thermal pressure outside of the shell then falls by two orders of magnitude as it is assumed that the temperature of the ambient neutral gas in this case is K (see the left-hand middle and bottom panels in Figure 3). The first supernova explosion also occurs at this time and thus the number of ionizing photons emerging from the central cluster begins to decay rapidly afterwards. Model LDSc presents the shell structure at a later time, Myr, when all ionizing photons are absorbed in the inner segments of the shell and thus the outer skin of the shell remains neutral.
The conditions for model LDL assume a leaky bubble model (see, for example, Matzner, 2002; Harper-Clark & Murray, 2009). In this case, the thermal pressure inside the wind-driven bubble drops below the Weaver et al. (1977) model predictions due to the escape of hot shocked-wind plasma through holes in the wind-driven shell. In this case individual bow shocks around the shell fragments should merge to create a coherent reverse shock near the contact discontinuity, or inner side of the broken shell (see Tenorio-Tagle et al., 2006; Rogers & Pittard, 2013). We thus assume that the minimum driving force on the shell in the leaky bubble model is determined by the cluster wind ram pressure at the shell location and can never fall below such value (ST13). Hereafter we will assume that in the leaky case the transition from energy to momentum dominated regimes occurs at Myr, just after the shell cools down and begins to absorb ionizing photons. Equations (7-9) are replaced with equations (11 - 13) at this time. Certainly, this time is arbitrary, but warrants the maximum possible effect of radiation pressure.
The density and thermal pressure distributions within and at both sides of the shell in the leaky case are shown on the right-hand panels of Figure 3. Here the top middle and bottom panels correspond to models LDLa, LDLb and LDLc and thus present the density, thermal pressure and ram pressure profiles at the same evolutionary times , and Myr, respectively. The size of the leaky shell is smaller and its thickness larger than those predicted by the standard bubble model (model LDS) and the difference grows with time (compare the right and left-hand panels in Figure 3). Note also that the leaky shell is not able to trap all ionizing photons and form an outer neutral skin for a much longer time (in this case Myr). This is because in the leaky bubble model the driving pressure and thus the ionized gas density at the inner edge of the shell are much smaller than those in the standard case (LDS).
The expectations resulting from calculations of the ionized gas distribution in static configurations with low pressure central cavities (section 2) had been that radiation pressure would lead to a non homogeneous thermal pressure and density distributions inside the wind-driven shell. Both, density and thermal pressure should grow from a low value at the inner edge of the shell to a maximum value at the outer edge, as in the high density static models (see section 2). The calculations however, do not show such large enhancements in density and in the leading shock driving pressure relative to that at the inner edge of the shell. The density enhancement is about and at Myr, and at Myr and and at Myr in the standard and the leaky bubble model, respectively (see the left-hand and right-hand panels of Figure 3). We then provided similar calculations for an order of magnitude less massive cluster (105 M☉) and did not find significant difference with the above results. In all calculations with a 105 M☉ cluster the density enhancement does not exceed despite radii of the shells differ significantly from those obtained in the more energetic models LDS and LDL. These results demonstrate how significantly the inner boundary condition (the value of thermal pressure at the inner edge of the HII region) may change the ionized gas density distribution. They also imply that the impact from radiation pressure on the dynamics of shells formed by massive young stellar clusters embedded into a low density ambient medium is not significant throughout their evolution even if all of the hot plasma leaks out from the bubble interior into the surrounding medium. Consequently, allow for the use of equations (7-8) and (11-12), ignoring the impact of the starlight momentum.
4.2 Shells evolving in a high density ISM
The high-density models (Table 2, models HDS and HDE) are evaluated at the same dynamical times: = 1, 3.3 and 5 Myr and are displayed in Figure 4. In these cases the model predicts that the transition from energy to the momentum dominated regime occurs at much earlier times (see equation 10). For example, in the case of model HDS, Myr. Thus, models HDSb and HDSc correspond to a shell expanding in the momentum dominated regime. The size of the shell in this case is much smaller than when it expands into a low density ISM, however the shell is much denser and thus recombines faster. Therefore in the high density cases the ionizing radiation is not able to photoionize the whole shell from the very early stages of the bubble evolution (see the top left-hand panel in Figure 4). The density in the ionized shell drops when the transition to the momentum-dominated regime occurs. This allows the central cluster to photoionized a larger fraction of the swept-up material. Therefore the relative thickness of the ionized shell increases between the 1 Myr and 3.3 Myr (compare panels HDSa and HDSb in Figure 4). After 3.3 Myr the number of ionizing photons decreases rapidly (Figure 2) and the relative thickness of the ionized shell becomes smaller again despite the drop in driving pressure and the consequent drop in the ionized gas density (see panel HDSc). The density gradient also reaches the maximum value at Myr and then drops at latter times. The density (and thermal pressure) gradient across the ionized shell in the high density models is larger than in the low density cases. For example, the enhancement of density relative to that at the inner edge of the shell in model HDSa is , in model HDSb is and in model HDSc (see the left-hand panels in Figure 4). This is because the inner radius of the ionized shell in the high density case is smaller and thus the impact that radiation pressure provides on the shell is larger.
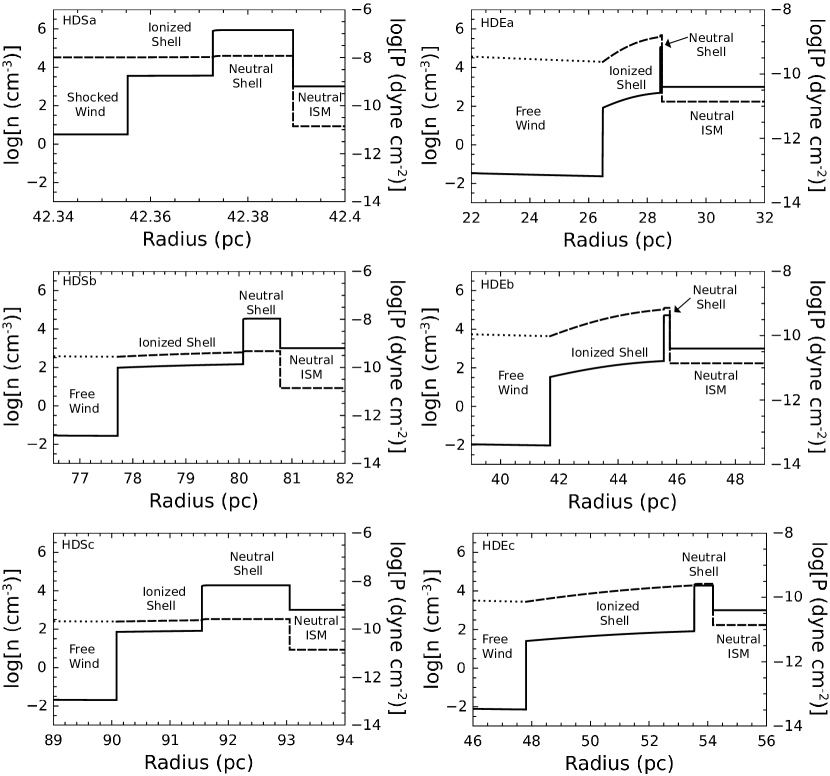
The right-hand panels in Figure 4 present the results of the calculations when the driving cluster has a low heating efficiency (models HDEa, HDEb and HDEc). These calculations were motivated by the discrepancy between the Weaver et al. (1977) model predictions and the observed sizes and expansion velocities of the wind-blown bubbles known as “the growth-rate discrepancy” Oey (1996) or “the missing wind problem” (Freyer et al. 2006; Dopita et al. 2005; Smith et al. 2006; Silich et al. 2007, 2009) and by the fact that at the initial stages of the bubble evolution the star cluster mechanical luminosity still does not reach the average value adopted in our calculations (see Figure 2). The heating efficiency may also be small if the kinetic energy of stellar winds is converted to turbulence and radiated away in young stellar clusters (Bruhweiler et al., 2010). At later stages of evolution a low heating efficiency may be physically justified by assuming mass loading of the matter left over from star formation, as in Wünsch et al. (2011), or an oversolar metallicity of the SN ejecta what enhances the cooling rate, as in Tenorio-Tagle et al. (2005). More recently, a low heating efficiency has been shown to also arise from the consideration of a continuous presence of dust within the cluster volume, dust produced within the ejecta of the multiple core-collapsed SN expected in young clusters (see Tenorio-Tagle et al., 2013). In this case, we keep the values of , and equal to those predicted by the Starburst99 synthetic model for a cluster, but instead of using erg s-1, as in our models HDSa - HDSc, we use an order of magnitude smaller mechanical luminosity: erg s-1. The transition to the momentum dominated regime in this case occurs at Myr. The relative thickness of the ionized shell is much larger than that in model HDS as the size of the shell is about two times smaller and thus the flux of the ionizing radiation is about four times larger than in model HDS (compare the left-hand and right-hand panels in Figure 4). This leads to the largest calculated enhancement in the shell density (and thus thermal pressure) relative to that at the inner edge of the shell which is: at Myr, at Myr and at Myr. These results imply that radiation pressure must be taken into consideration in calculations with low heating efficiency and that Weaver et al. (1977) model (equations 7-8 and 11-12) must be corrected in this case. The radiation pressure may also contribute to the shell dynamics at very early stages (before 3 Myr) of the wind-blown bubbles evolution (see also Figure 3 in ST13). Similar results were obtained for the less massive () clusters. In this case the maximum enhancement of density is in the standard (HDS) case and in the low heating efficiency (HDE) model, respectively.
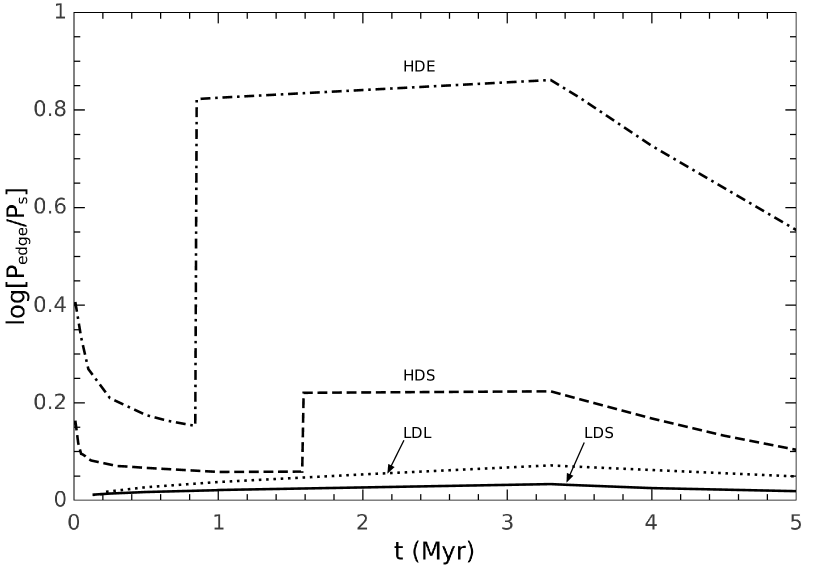
The time evolution of the thermal pressure excess, , where and are the values of the thermal pressure behind the leading shock and at the inner edges of the wind-driven shell, is shown in Figure 5. In the high density models (dashed and dash-dotted lines) this ratio decreases first as the flux of ionizing energy at the inner edge of the shell drops faster (as ) than thermal pressure in the shocked wind region which drops as (see equation 8). It then grows to a larger value when the hydrodynamic regime changes from the energy to a momentum-dominated expansion and the wind pressure at the inner edge of the shell drops abruptly. After this time both, the flux of radiation energy and the wind ram pressure at the inner edge of the shell drop as . The ratio then grows slowly as the number of non-ionizing photons absorbed by the outer neutral shell increases with time. The slow increase of the ratio continues until the number of ionizing photons begins to drop after the first supernova explosion at 3.3 Myr when the over ratio reaches 1.67 () in the case of model HDSb and 7.26 () in the case of model HDEb.
In the low density cases (solid and dotted lines) the swept-up shell is not able to absorb all ionizing photons until it grows thick enough and therefore the number of ionizing photons trapped inside the completely ionized shell grows continuously until the first supernova explosion at 3.3 Myr. This compensates the drop of the ionizing energy flux and leads to a continuously growing ratio at this stage. However, in the standard (solid line) case and leaky (dotted line) bubble model this ratio remains always smaller than . In the low density models LDS and LDL it is even smaller (less than 1.2) and is below the upper limit obtained in ST13. This is because in the low density cases wind-driven shells absorb only a fraction of the star cluster bolometric luminosity.
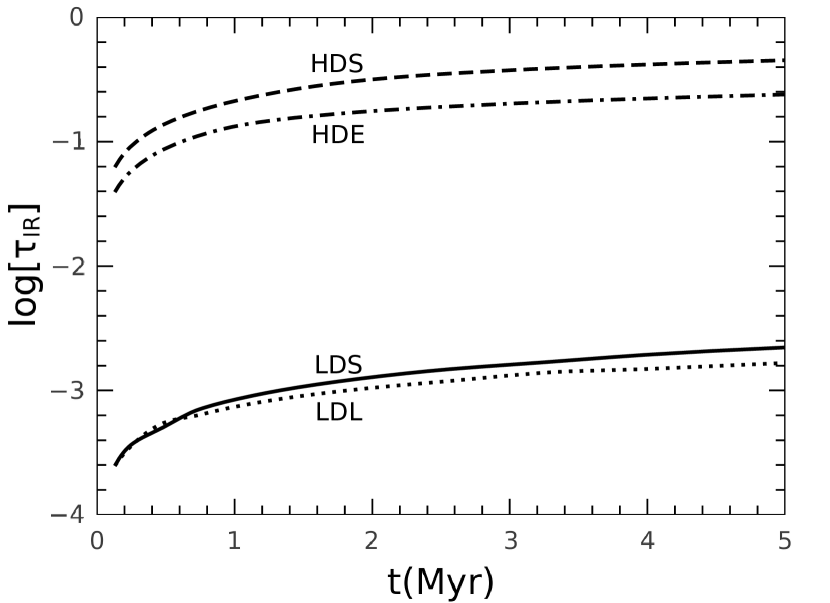
The fraction of the star cluster bolometric luminosity trapped within a shell as a function of time in models LDS, LDL, HDS and HDE is shown in Figure 6 by solid, dotted, dashed and dash-dotted lines, respectively. Note that dashed and dash-dotted lines overlap rapidly as in the high density calculations expanding shells absorb all available (ionizing and non ionizing) photons at the very beginning of their time evolution (at Myr). However, even in this case the shell remains optically thin to the IR photons re-emitted by dust grains, as shown in Figure 7. Here we adopted for the dust opacity cm2 g-1 (see Table 1 in Novak et al., 2012) and calculated the optical depth for the IR radiation as , where the column density of the shell, , is . The amplification of radiation pressure by the multiple re-emitted IR photons which is (see Hopkins et al., 2011; Krumholz & Thompson, 2012) thus remains less than unity. In all our calculations, the amplification factor never exceeds 2, even if one uses a larger dust opacity, cm2 g-1 adopted by Hopkins et al. (2011). This implies that the star cluster wind-driven shells expand in the radiation momentum rather than in the radiation energy dominated regime (see Fall et al., 2010; Krumholz & Thompson, 2012, for the detailed discussion of the two limiting cases).

We also computed how radiation pressure affects the density and thermal pressure distribution in the case when the exciting cluster is embedded into a low ( cm-3) density ISM and has a low heating efficiency and in the case of a leaky shell moving into a high ( cm-3) density medium. We found a little difference between these calculations and models LDL and HDS, respectively. For example, the enhancement of density from the inner to the outer edge of the shell in the low density calculations with a 10% heating efficiency is about 1.13, 1.2 and 1.11 at 1 Myr, 3.3 Myr and 5 Myr, whereas in the leaky bubble model LDL it is , and , respectively. In the case when a leaky shell expands into a high density medium, the enhancement of density is : at 1 Myr, at 3.3 Myr and at 5 Myr, whereas in model HDS it is , and , respectively, and thus the only difference between the last two models is that the transition from energy to momentum dominated regimes occurs at different times. Therefore we do not present the detailed description of these calculations in our further discussion.
4.3 Comparison to other models and observations
Having the exciting cluster parameters and the distribution of the ionized gas density in the surrounding shell, one can obtain the model predicted values for diagnostic parameters often used in observations and compare them to the typically observed ones. In this section we first calculate the values of the ionization parameter and then put our results onto a diagnostic diagram proposed by Yeh & Matzner (2012) which allows one to conclude if radiation or the wind dynamical pressure dominates the dynamics of the ionized gas around young stellar clusters.
The ionization parameter is defined as the flux of ionizing photons per hydrogen atom. It is directly related to the state of ionization and to the radiation pressure over gas thermal pressure ratio and is usually calculated at the inner edge of the ionized medium (e.g. Dopita et al., 2005):
| (14) |
The ionization parameter may be measured observationally from the emission line ratios (e.g. Rigby & Rieke, 2004; Snijders et al., 2007; Yeh & Matzner, 2012, and references therein) and thus is a powerful tool to measure the relative significance of the radiation and gas thermal pressure around young stellar clusters. However, the number of ionizing photons varies radially within HII regions and therefore the measured values of are weighted by the density distribution in the ionized nebula. This led Yeh & Matzner (2012) to propose as a relevant model parameter
| (15) |
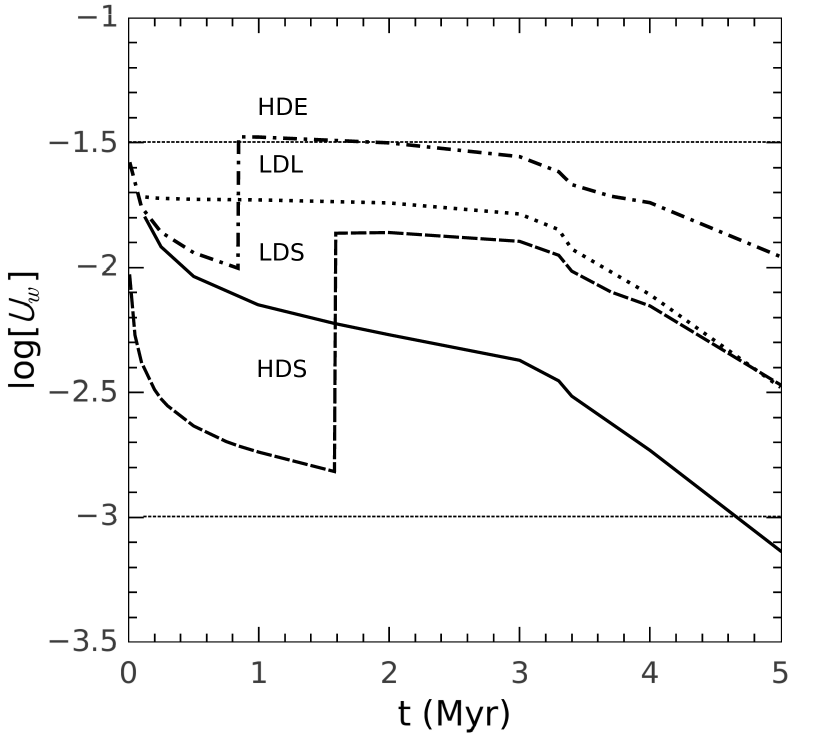
where the integrals are evaluated from the inner to the outer edge of the HII region. In our approach, we have neglected the presence of any neutral gas and dust able to deplete the radiation field in the free and hot shocked wind regions and thus assumed that all the photons produced by the star cluster are able to impact the shell. The integrals in equation 15 thus were evaluated with the lower and upper limits and , respectively. Here we make use of our models to obtain the ionized gas density distribution within wind-driven shells expanding into different interstellar media and calculate the ionization parameter at different times . The results of the calculations are presented in Figure 8. One can note, that the time evolution of the ionization parameter in the wind-driven bubble model is complicated as it depends not only on the varying incident radiation, but also on the hydrodynamics of the wind-driven shell. In all cases the value of drops first as the wind-driven shell expands and the photon flux at the inner edge of the shell drops accordingly. In the standard case (LDS, solid line) the value of drops continuously but turns to decrease faster after the first supernova explosion as since that time the flux of incident photons per unit area drops not only because of the shell expansion, but also because of the reduced value of . In the high density model HDS (dashed line) the value of the ionization parameter increases by about an order of magnitude after the transition to the momentum-dominated regime as when the transition occurs, the wind pressure and the ionized gas density at the inner edge of the shell drop, what enhances the value of significantly (see equations 14 and 15). The value of the ionization parameter then remains almost constant until the first supernova explodes at about 3.3 Myr as at this stage both, the flux of ionizing photons and the ram pressure of the wind at the inner edge of the shell drop as and thus the radiation over the dynamical pressure ratio depends only on the ratio (see ST13, ) which in our calculations does not change much at this stage. After 3.3 Myr the value of the ionization parameter drops as the number of massive stars and the number of available ionizing photons decline rapidly. The behavior of in the leaky (model LDL, dotted line) and low heating efficiency (model HDE, dash-dotted line) cases is very similar to that in the high density case HDS. The only difference is that the transition to the momentum-dominated regime in these cases occurs at earlier times and the maximum values of the ionization parameter are larger than that in model HDS. One can also note that the ionization parameter reaches the maximum possible value, , in the low heating efficiency model HDL and that the model predicted values of the ionization parameter fall into the range of typical values found in local starburst galaxies: , (see Figure 10 in Rigby & Rieke, 2004). The larger values of the ionization parameter (e.g. Snijders et al., 2007) either require a lower heating efficiency, as was also claimed in Dopita et al. (2005), or a more complicated physical model than a single ionized shell formed by a young stellar cluster (see the discussion in Snijders et al., 2007).
Finally, we put our results onto a diagnostic diagram proposed by Yeh & Matzner (2012) in order to show where physically motivated models are located in this diagram. For example, their model with more than an order of magnitude increasing density (see Figure 7 in their paper), erg s-1, and corresponds, according to our calculations, to a very compact ( less than 3 pc) and very dense ( is a few hundred particles per cm3) shell at the age of 2 Myr what implies that the HII region is quasi-static and requires a very low star cluster heating efficiency and a large confining (thermal/turbulent) pressure in the ambient ISM (see Smith et al., 2006; Silich et al., 2007, 2009). Two-dimensional parameter space introduced by Yeh & Matzner (2012) is related to the compactness of the HII region (parameter ) and to the relative strength of different driving forces (parameter ). Parameter is defined as the ratio, where is the radius of the ionization front (in our case this is the radius of the outer edge of the ionized shell) and is the radius of a uniform density Strömgren sphere whose thermal pressure is equal to the maximum possible unattenuated radiation pressure at the edge of the HII region :
| (16) |
Parameter is related to the volume between the ionization front and the inner edge of the HII region and to the values of thermal pressure at its inner and outer edges:
| (17) |
We obtain parameter by calculating the volume between the outer and the inner edge of the ionized shell and the values of thermal pressure and even at earlier stages of models LDS and LDL when the ionized shell is still embedded into an extended diffuse HII region. As long as the ionized shell is thin, parameter is:
| (18) |
and thus measures the wind dynamical over the radiation pressure ratio (the shell moves in the radiation-dominated regime if and in the wind-dominated regime if ).
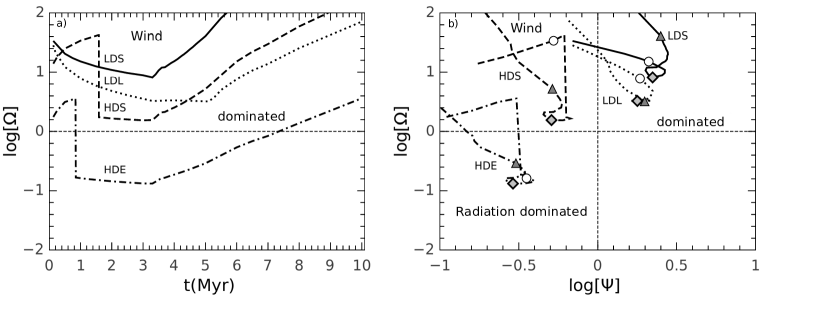
In all static models discussed in section 2 the parameter is very small () what implies that radiation pressure controls the ionized gas distribution in all static configurations with low-pressure central cavities. In the wind-blown cases the parameter is a function of time as both radii, and , change with time. Therefore it is instructive to show first how parameter changes with time. This is shown in Figure 9 , panel a. Panel b in this figure displays the evolutionary tracks of our models in the parameter space. The initial points for models LDS, LDL, HDS and HDE were calculated at the star cluster age of 0.13 Myr. The initial values of the normalization radius then are: pc in model LDL and pc in models LDS, HDS and HDE, respectively. As both star cluster parameters, and , change with time, the value of also changes with time significantly and by 10 Myr reaches pc. In cases LDS and LDL parameter grows continuously (see panel a, solid and dotted lines). In the high density cases parameter drops drastically when the transition occurs to the momentum dominated regime, then slightly declines and increases again after the first supernova explosion as the number of the ionizing photons then drops rapidly. The strong time evolution of leads to the intricate tracks of the ionized shells in the diagram (see panel b). In the low density models LDS and LDL the tracks go to the left and up because the normalization radius grows with time faster than the radius of the shell and thus the ionization front radius . In the high density cases HDS and HDE the tracks are more intricate. They first go to the right, then drop down when the transition to the momentum dominated regime occurs, make a loop and finally go back to the left and up.
Thus, in the low density cases the impact of radiation pressure on the shell dynamics is always negligible and declines with time. In the high density model HDS the contribution of radiation pressure to the shell dynamics becomes more significant when the shell makes a transition from the energy to the momentum dominated regime. However, in this case parameter also remains positive and thus in all models with a 100% heating efficiency the shells expand in the wind-dominated regime. Parameter falls below a zero value only in the low heating efficiency case HDE. Thus, only in this case radiation pressure may dominate the shell dynamics. The radiation dominated phase lasts from the beginning of the momentum dominated regime at Myr till Myr (see panel a). This implies that radiation pressure may dominate the dynamics of the gas around young stellar clusters either at early stages of evolution (before Myr) or if the major fraction of the star cluster mechanical luminosity is dissipated or radiated away within the star cluster volume and thus the energy of the star cluster driven winds is significantly smaller than what star cluster synthetic models predict. However, even if this is the case, radiation pressure will dominate only if the exciting cluster is embedded into a high density ambient medium.
5 Summary
1. Radiation pressure may strongly affect the structure of static, dusty HII regions. However, the impact that star cluster winds provide on the flows and the strong time evolution of the ionizing photon flux and the star cluster bolometric luminosity lead to a more intricate picture.
2. In a more realistic model, the impact of radiation pressure on the expanding shell crucially depends on the strength of the star cluster wind at the inner edge of the shell and thus on the hydrodynamic regime of the shell expansion and on the star cluster age and heating efficiency.
3. Radiation pressure may affect the inner structure and the dynamics of the wind-driven shell only at the earliest stages of evolution (before Myr, when the over ratio is still larger than that used in our calculations), or if a major fraction of the star cluster mechanical luminosity is dissipated or radiated away within the star cluster volume and thus the star cluster mechanical energy output is much smaller than star cluster synthetic models predict. However, even in these cases radiation effects may be significant only if the exciting cluster is embedded into a high density ambient medium.
4. The impact that radiation pressure provides on the dynamics and inner structure of the wind-driven shell is always negligible during the advanced stages of evolution as the radiation energy flux declines rapidly after the first supernovae explosion whereas the mechanical power of the cluster does not.
5. The calculated values of the density weighted ionization parameter fall into the range of typical values found in nearby starburst galaxies ( log). The larger values of the ionization parameter sometimes detected around very young stellar clusters require either a lower heating efficiency, or a more complicated than a single ionized shell physical model.
6. The model location in the diagnostic diagram proposed by Yeh & Matzner (2012) strongly depends on the evolutionary time what leads to intricate evolutionary track patterns. The standard wind-driven and leaky bubble model are located in the upper segments in this diagram where HII regions evolving in the thermal pressure dominated regime settle in. The only model whose evolutionary track passes through the lower left corner where radiation pressure dominated HII regions are located, is and only temporarily, that with a low heating efficiency.
References
- Arthur (2012) Arthur, S. J. 2012, MNRAS, 421, 1283
- Bisnovatyi-Kogan & Silich (1995) Bisnovatyi-Kogan, G. S., & Silich, S. A. 1995, Reviews of Modern Physics, 67, 661
- Bruhweiler et al. (2010) Bruhweiler, F. C., Freire Ferrero, R., Bourdin, M. O., & Gull, T. R. 2010, ApJ, 719, 1872
- Capriotti & Kozminski (2001) Capriotti, E. R., & Kozminski, J. F. 2001, PASP, 113, 677
- Chávez et al. (2012) Chávez, R., Terlevich, E., Terlevich, R., et al. 2012, MNRAS, 425, L56
- Dopita et al. (2003) Dopita, M. A., Groves, B. A., Sutherland, R. S., & Kewley, L. J. 2003, ApJ, 583, 727
- Dopita et al. (2005) Dopita, M. A., Groves, B. A., Fischera, J., et al. 2005, ApJ, 619, 755
- Dopita et al. (2006) Dopita, M. A., Fischera, J., Sutherland, R. S., et al. 2006, ApJ, 647, 244
- Draine (2011) Draine, B. T. 2011, ApJ, 732, 100
- Elmegreen & Chiang (1982) Elmegreen, B. G., & Chiang, W.-H. 1982, ApJ, 253, 666
- Fall et al. (2010) Fall, S. M., Krumholz, M. R., & Matzner, C. D. 2010, ApJ Let, 710, L142
- Freyer et al. (2006) Freyer, T., Hensler, G., & Yorke, H. W. 2006, ApJ, 638, 262
- Harper-Clark & Murray (2009) Harper-Clark, E., & Murray, N. 2009, ApJ, 693, 1696
- Hopkins et al. (2011) Hopkins, P. F., Quataert, E., & Murray, N. 2011, MNRAS, 417, 950
- Kewley & Dopita (2002) Kewley, L. J., & Dopita, M. A. 2002, ApJS, 142, 35
- Koo & McKee (1992) Koo, B.-C., & McKee, C. F. 1992, ApJ, 388, 93
- Krumholz & Matzner (2009) Krumholz, M. R., & Matzner, C. D. 2009, ApJ, 703, 1352
- Krumholz & Thompson (2012) Krumholz, M. R., & Thompson, T. A. 2012, ApJ, 760, 155
- Leitherer et al. (1999) Leitherer, C., Schaerer, D., Goldader, J. D., et al. 1999, ApJS, 123, 3
- Mac Low & McCray (1988) Mac Low, M.-M., & McCray, R. 1988, ApJ, 324, 776
- Mathews (1967) Mathews, W. G. 1967, ApJ, 147, 965
- Mathews (1969) Mathews, W. G. 1969, ApJ, 157, 583
- Matzner (2002) Matzner, C. D. 2002, ApJ, 566, 302
- Nath & Silk (2009) Nath, B. B., & Silk, J. 2009, MNRAS, 396, L90
- Novak et al. (2012) Novak, G. S., Ostriker, J. P., & Ciotti, L. 2012, MNRAS, 427, 2734
- Oey (1996) Oey, M. S. 1996, ApJ, 467, 666
- Osterbrock (1989) Osterbrock, D. E. 1989, Astrophysics of gaseous nebulae and active galactic nuclei, Mill Valley, CA, 422 pp.
- Rigby & Rieke (2004) Rigby, J. R., & Rieke, G. H. 2004, ApJ, 606, 237
- Rogers & Pittard (2013) Rogers, H., & Pittard, J. M. 2013, MNRAS, 431, 1337
- Sharma & Nath (2012) Sharma, M., & Nath, B. B. 2012, ApJ, 750, 55
- Silich & Tenorio-Tagle (2013) Silich, S., & Tenorio-Tagle, G. 2013, ApJ, 765, 43
- Silich et al. (2007) Silich, S., Tenorio-Tagle, G., & Muñoz-Tuñón, C. 2007, ApJ, 669, 952
- Silich et al. (2009) Silich, S., Tenorio-Tagle, G., Torres-Campos, A., et al. 2009, ApJ, 700, 931
- Silich (1992) Silich, S. A. 1992, Ap&SS, 195, 317
- Silich et al. (1996) Silich, S. A., Franco, J., Palous, J., & Tenorio-Tagle, G. 1996, ApJ, 468, 722
- Smith et al. (2006) Smith, L. J., Westmoquette, M. S., Gallagher, J. S., et al. 2006, MNRAS, 370, 513
- Snijders et al. (2007) Snijders, L., Kewley, L. J., & van der Werf, P. P. 2007, ApJ, 669, 269
- Strömgren (1939) Strömgren, B. 1939, ApJ, 89, 526
- Tenorio-Tagle et al. (2006) Tenorio-Tagle, G., Muñoz-Tuñón, C., Pérez, E., Silich, S., & Telles, E. 2006, ApJ, 643, 186
- Tenorio-Tagle & Palous (1987) Tenorio-Tagle, G., & Palous, J. 1987, A&A, 186, 287
- Tenorio-Tagle et al. (2013) Tenorio-Tagle, G., Silich, S., Martínez-González, S., et al. 2013, ApJ, 778, 159
- Tenorio-Tagle et al. (2005) Tenorio-Tagle, G., Silich, S., Rodríguez-González, A., & Muñoz-Tuñón, C. 2005, ApJ Let, 628, L13
- Weaver et al. (1977) Weaver, R., McCray, R., Castor, J., Shapiro, P., & Moore, R. 1977, ApJ, 218, 377
- Wünsch et al. (2011) Wünsch, R., Silich, S., Palouš, J., Tenorio-Tagle, G., & Muñoz-Tuñón, C. 2011, ApJ, 740, 75
- Yeh & Matzner (2012) Yeh, S. C. C., & Matzner, C. D. 2012, ApJ, 757, 108