Evolution of the Fraction of Clumpy Galaxies at
in the COSMOS field**affiliation: Based on observations with the NASA/ESA
Hubble Space Telescope, obtained at the Space Telescope Science
Institute, which is operated by AURA Inc, under NASA contract NAS
5-26555. Also based on observations made with the Spitzer Space
Telescope, which is operated by the
Jet Propulsion Laboratory, California Institute of Technology,
under NASA contract 1407. Also based on data collected at;
the Subaru Telescope, which is operated by the National Astronomical
Observatory of Japan; the XMM-Newton, an ESA science mission with
instruments and contributions directly funded by ESA Member States and
NASA; the European Southern Observatory under Large
Program 175.A-0839, Chile; Kitt Peak National Observatory, Cerro
Tololo Inter-American Observatory and the National Optical Astronomy
Observatory, which are operated by the Association of Universities for
Research in Astronomy, Inc. (AURA) under cooperative agreement with
the National Science Foundation; and the Canada-France-Hawaii
Telescope with MegaPrime/MegaCam operated as a joint project by the
CFHT Corporation, CEA/DAPNIA, the NRC and CADC of Canada, the CNRS
of France, TERAPIX and the Univ. of Hawaii.
Abstract
Using the Hubble Space Telescope/Advanced Camera for Surveys data in the COSMOS field, we systematically searched clumpy galaxies at and investigated the fraction of clumpy galaxies and its evolution as a function of stellar mass, star formation rate (SFR), and specific SFR (SSFR). The fraction of clumpy galaxies in star-forming galaxies with decreases with time from at to at irrespective of the stellar mass, although the fraction tends to be slightly lower for massive galaxies with at each redshift. On the other hand, the fraction of clumpy galaxies increases with increasing both SFR and SSFR in all the redshift ranges we investigated. In particular, we found that the SSFR dependences of the fractions are similar among galaxies with different stellar masses, and the fraction at a given SSFR does not depend on the stellar mass in each redshift bin. The evolution of the fraction of clumpy galaxies from to seems to be explained by such SSFR dependence of the fraction and the evolution of SSFRs of star-forming galaxies. The fraction at a given SSFR also appears to decrease with time, but this can be due to the effect of the morphological K-correction. We suggest that these results are understood by the gravitational fragmentation model for the formation of giant clumps in disk galaxies, where the gas mass fraction is a crucial parameter.
Subject headings:
galaxies: evolution — galaxies: irregular — galaxies: star formation1. INTRODUCTION
In the present universe, most bright galaxies have regular and symmetric morphologies, which can be classified in the framework of the Hubble sequence (Hubble 1936). On the other hand, using the high-resolution imaging capability of the Hubble Space Telescope (), it has been found that many star-forming galaxies at have irregular shapes with asymmetric structures, (e.g., Cowie et al. 1995; Steidel et al. 1996; Kajisawa & Yamada 2001; Elmegreen et al. 2007; Cameron et al. 2011). Although these high-redshift irregular galaxies show a variety of morphologies, they commonly have giant (kpc scale) star-forming clumps (e.g., Elmegreen et al. 2009a; Förster Schreiber et al. 2011). Recent NIR integral field spectroscopy observations of star-forming clumpy galaxies at revealed that a significant fraction of these galaxies show coherent rotation with a relatively large turbulent velocity in their ionized gas kinematics (e.g., Förster Schreiber et al. 2006; Wright et al. 2007; Genzel et al. 2008; Cresci et al. 2009; Förster Schreiber et al. 2009). Several studies of the radio CO line observations also found that actively star-forming galaxies at have large gas mass fractions of – 0.8 (Daddi et al. 2010; Tacconi et al. 2010; Tacconi et al. 2013). While some of these galaxies are galaxy mergers (e.g., Somerville et al. 2001; Lotz et al. 2004; Puech 2010), these results can be explained by theoretical models where gas-rich rotational disks are gravitationally unstable for the fragmentation and lead to the formation of giant star-forming clumps (e.g., Noguchi 1998; Immeli et al. 2004; Bournaud et al. 2007; Dekel et al. 2009a). The high gas mass fraction of these galaxies is considered to be maintained by the rapid and smooth cosmic infall of gas along large-scale filaments. Since the accretion rate of gas is expected to decrease with time, especially at , the gas fraction of these clumpy galaxies declines at lower redshifts as the gas consumption by the star formation proceeds, which results in the stabilization of the gas disks (Cacciato et al. 2012). In this view, these high-redshift clumpy galaxies are considered to be progenitors of normal (disk) galaxies at low redshifts. Therefore, it is important to study the evolution of these clumpy galaxies in order to understand the formation process of normal galaxies in the present universe.
However, the number of systematic surveys for clumpy galaxies is very limited, because wide-field imaging data with high spatial resolution are required. While Elmegreen et al. (2007) claimed that clumpy galaxies are dominated at high redshift based on the morphological analysis of galaxies in the HUDF field, Tadaki et al. (2014) reported that 40% of 100 H emitters at and in the UKIDSS/UDS-CANDELS field show clumpy morphologies. Wuyts et al. (2012) measured the fraction of clumpy galaxies in star-forming galaxies with at in the GOODS-South field, and found that the fraction is 74% for clumps selected at the rest-frame 2800 Å and 42% for those selected at the rest-frame band, which suggests that the morphological K-correction can be important for the selection of clumpy galaxies. Although systematic surveys of clumpy galaxies at lower redshifts are also important for understanding the connection between clumpy galaxies at high redshifts and normal galaxies in the nearby universe, there is few survey for clumpy galaxies at . In this paper, we systematically search clumpy galaxies at in the COSMOS field (Scoville et al. 2007) and investigate their physical properties. The high spatial resolution images taken with /Advanced Camera for Surveys (ACS) over the very wide field allow us to construct a large sample of clumpy galaxies at and to investigate the fraction of clumpy galaxies and its evolution as a function of physical properties such as stellar mass and star formation rate for the first time. Section 2 describes our sample and details of the selection method for clumpy galaxies. We present the physical properties of clumpy galaxies and investigate the fraction of these galaxies and its evolution in Section 3. In Section 4, we summarize our results and discuss their implications. Throughout this paper, magnitudes are given in the AB system. We adopt a flat universe with , , and km s-1 Mpc-1.
2. SAMPLE AND ANALYSIS
2.1. Sample
In this study, we used a sample of galaxies with photometric redshifts of from the COSMOS photometric redshift catalog (Ilbert et al. 2009). We basically analyzed galaxies with in order to securely select clumpy galaxies in the /ACS -band images (see the next subsection). The photometric redshift is estimated with more than 30 bands data from UV to MIR wavelength in the COSMOS field, and its uncertainty is very small () for galaxies with at (Ilbert et al. 2009), which is sufficiently accurate for our purpose.
In order to investigate the fraction of clumpy galaxies as a function of the physical properties of galaxies, we used the stellar mass (Mstar) and the star formation rate (SFR) of our sample galaxies estimated from the spectral energy distribution (SED) fitting technique (Ilbert et al. 2010; Ilbert et al. 2013). The multi-band photometric data from UV to MIR wavelength were fitted with the population synthesis model by Bruzual & Charlot (2003). The exponentially declining star formation histories and the Calzetti et al. (2000) extinction law were assumed, and the Chabrier (2003) IMF was adopted (see Ilbert et al. 2013 for details). The best-fit model was used to convert the luminosities to the stellar mass and the SFR. We excluded X-ray sources detected in the Chandra or XMM-Newton images (Hasinger et al. 2007; Elvis et al. 2009) and galactic stars classified in the SED fitting from our sample.
| Redshift | All () | Clumpy () |
|---|---|---|
| 7392 (3826) | 363 (106) | |
| 5742 (4221) | 464 (304) | |
| 6297 (5597) | 895 (781) | |
| 4596 (4500) | 1081 (1055) | |
| total | 24027 (18144) | 2803 (2246) |
2.2. Selection for Clumpy Galaxies
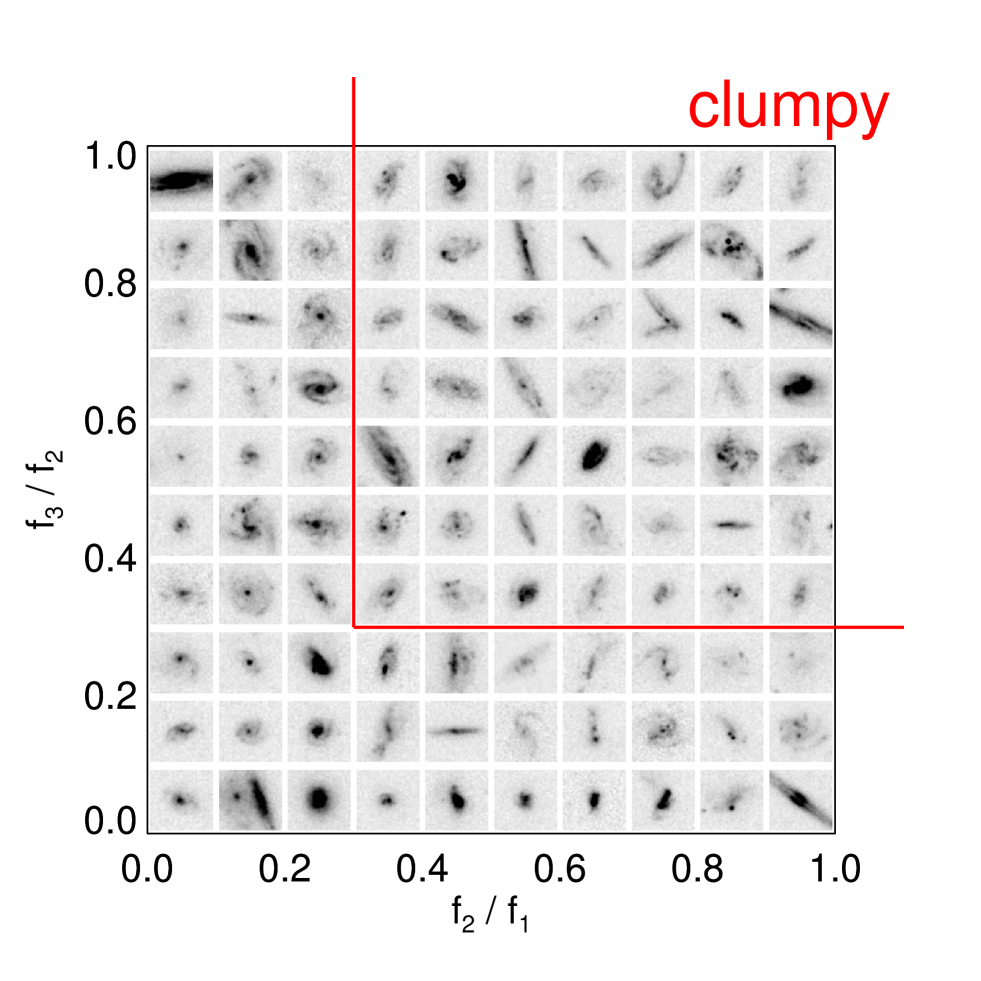
Using the /ACS -band data of the COSMOS survey (version 2.0, Koekemoer et al. 2007), we examined the morphology of our sample galaxies and selected clumpy galaxies quantitatively. The pixel scale of the reduced ACS images is 0.03 arcsec and the FWHM of the Point Spread Function is arcsec. The clumpy galaxy is characterized by several relatively bright components (clumps) in a galaxy. We here consider galaxies with more than two such clumps () as clumpy galaxies. In order to select clumpy galaxies, we first detected galaxies on the -band data, using the SExtractor software (Bertin & Arnouts 1996). A detection threshold of 2.0 times the local background root mean square over 15 connected pixels was used. We adopted the DEBREND_NTHRESH parameter of 64 and the DEBLEND_MINCONT parameter of 0.1 in the first SExtractor run. We then searched counterparts of our sample galaxies mentioned above on the -band image, and found the counterparts for 24027 galaxies out of 24176 galaxies with at . Next, we changed the DEBLEND_MINCONT parameter to 0.001 and rerun the SExtractor to more aggressively deblend each galaxy and detect relatively bright clumps in the galaxy. The resulting catalog in this second SExtractor run was cross-matched with that in the first run. We then selected sample galaxies which are deblended into more than two components as clumpy galaxy candidates. In order to ensure that at least three clumps are comparatively bright, we set further criteria for clumpy galaxies as
| (1) |
and
| (2) |
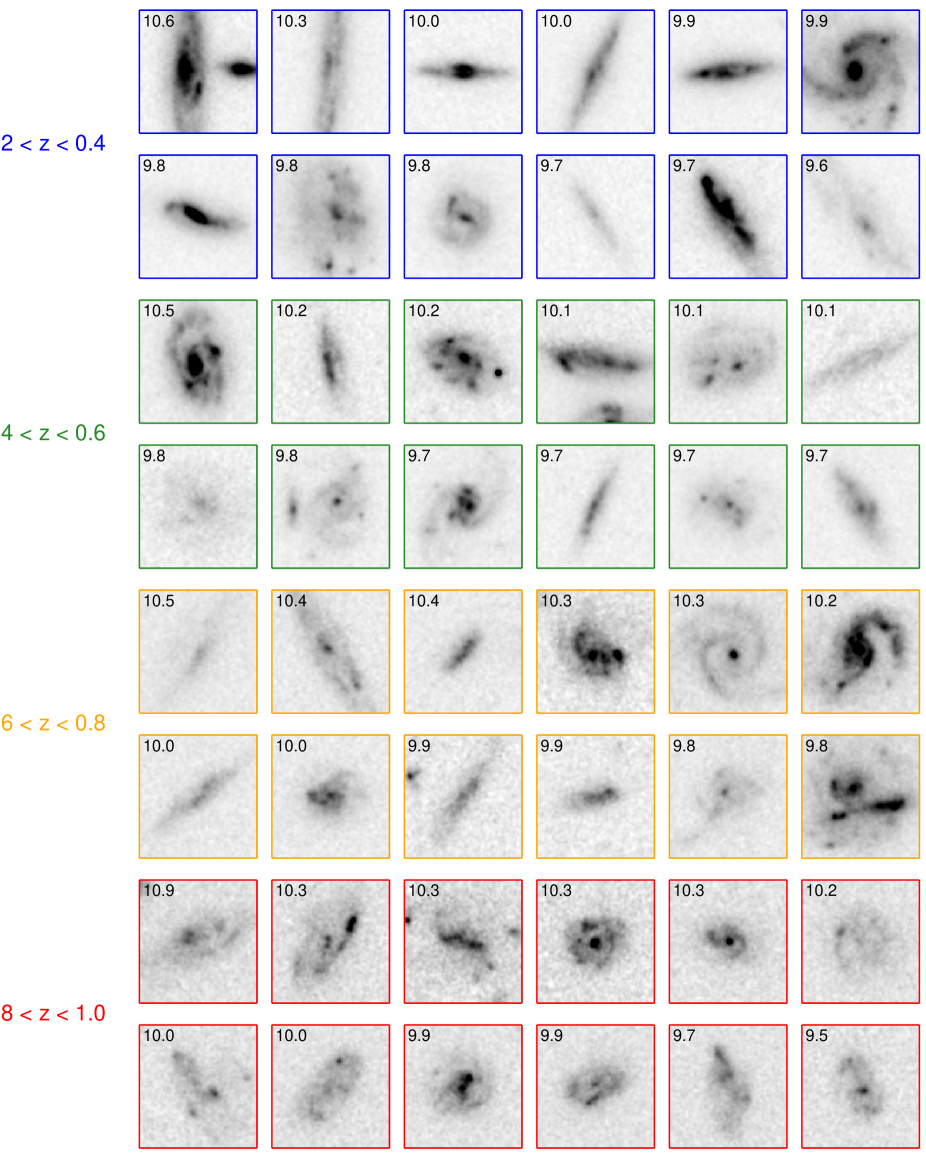
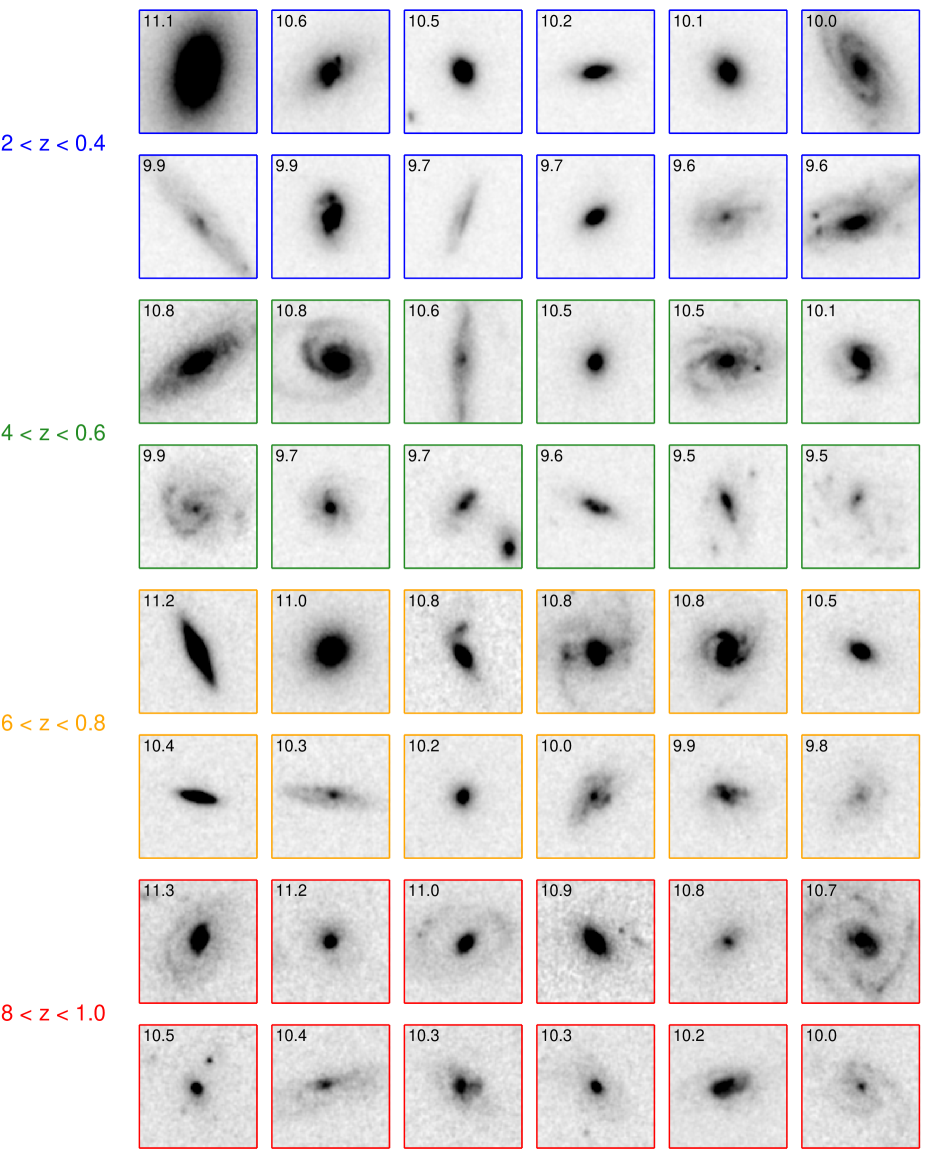
where , , and are -band fluxes of the brightest, the second brightest, and the third brightest clumps, respectively, in the galaxy. In Figure 1, we show examples of galaxies with more than two clumps as a function of these flux ratios among the brightest three clumps to demonstrate our classification. One can see that our selection enable to pick up sources with several significant clumps. On the other hand, galaxies with one dominant component, which corresponds to a bulge in some cases, lie at the left side in the figure, while those with only two bright components are located at the bottom right. In this paper, we refer to all galaxies which are not satisfied by the criteria for clumpy galaxies as “non-clumpy” galaxies.
3. RESULTS
3.1. Stellar Mass and SFR of Clumpy Galaxies
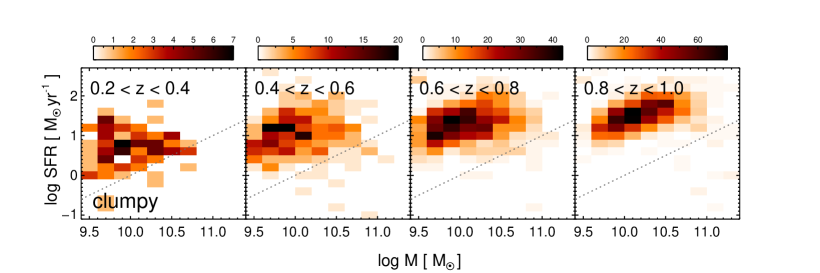
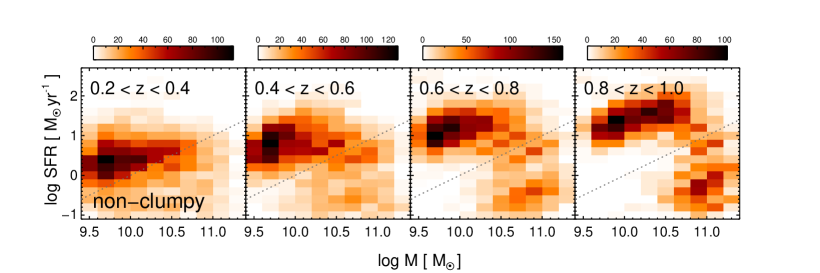
We show the Mstar–SFR diagram for the clumpy and non-clumpy galaxies, respectively, in Figure 4. Relatively small number of galaxies around in the both samples is due to the magnitude limit of . Since the observed band samples a shorter rest-frame wavelength at higher redshift, low-mass galaxies with lower SFRs in the high redshift bins tend to be missed by this magnitude limit. We discuss possible systematic effects of the magnitude limit on our results in Section 3.3.
The distribution of non-clumpy galaxies in the Mstar–SFR diagram shows a bimodality, which consists of passively evolving galaxies mainly located at higher stellar mass around and star-forming galaxies located at . The SFRs of star-forming galaxies increase with increasing stellar mass, and they form a sequence in the Mstar–SFR plane, namely, the “main sequence” of star-forming galaxies (e.g., Noeske et al. 2007). The SFRs of star-forming galaxies at a given stellar mass increase with increasing redshift over . Such distribution of galaxies in the Mstar–SFR plane and its evolution at are consistent with previous studies (e.g., Noeske et al. 2007; Santini et al. 2009; Kajisawa et al. 2010).
On the other hand, the clumpy galaxies are preferentially located on the main sequence of star-forming galaxies. In Figure 4, we plot the boundary line of the Gyr-1, which divides galaxies into the passively evolving and star-forming populations, for reference. Since almost all clumpy galaxies lie above the boundary line, especially, at high redshift, they are star-forming galaxies. The range of the SFRs of clumpy galaxies at a given stellar mass is similar to that of the other star-forming galaxies in all the mass and redshift ranges, although their SFRs tend to be higher values as we will show in detail in the following subsection.
3.2. Fraction of Clumpy Galaxies as a Function of Physical Properties
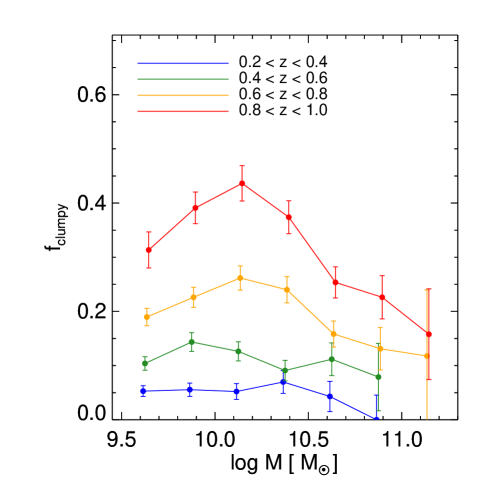
We investigated the fraction of clumpy galaxies in our sample at as a function of stellar mass, SFR, and specific SFR ( SFR/Mstar, hereafter SSFR), to study their role in the galaxy evolution and the origins of their morphology. Figure 5 shows the fraction of clumpy galaxies in star-forming galaxies with Gyr-1 as a function of stellar mass for the different redshift bins. The fraction does not strongly depend on stellar mass in all the redshift bins, although it tends to be slightly lower at . We also note that the fraction at becomes slightly higher around . In Figure 4 we can see a concentration of clumpy galaxies at and yr-1, and therefore some fluctuation in the number density of such galaxies in our survey field may cause such high fraction of clumpy galaxies around at . There may also be the effect of the bias for galaxies with relatively high SSFR near the limiting mass at high redshift caused by the magnitude limit of , as we show in Section 3.3. The fraction of clumpy galaxies decreases with time from at to at . This is consistent with the results in the previous studies that bright clumpy galaxies are rare in the present universe, while many such galaxies have been observed at (e.g., Elmegreen et al. 2007; Elmegreen et al. 2009b).
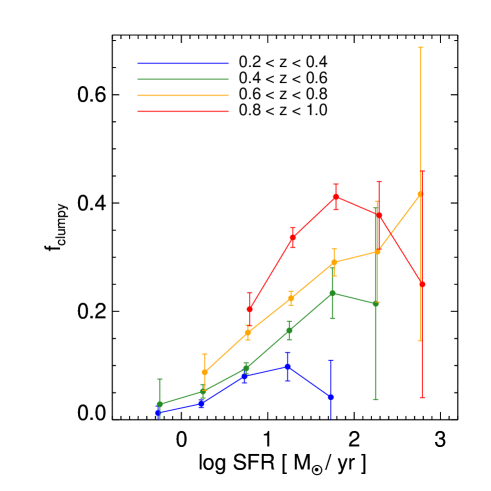
We show the fraction of clumpy galaxies in star-forming galaxies with Gyr-1 as a function of SFR in Figure 6. It is shown that the fraction of clumpy galaxies clearly increases with increasing SFR in all the redshift ranges. The fraction at a given SFR decreases with time over the wide range of SFR, although the strength of the evolution seems to depend on SFR. The fraction at yr-1 decreases from at to at , while that at yr-1 changes from to in the same redshift range. A slightly higher fraction around yr-1 for galaxies at probably corresponds to that at in Figure 5 mentioned above.
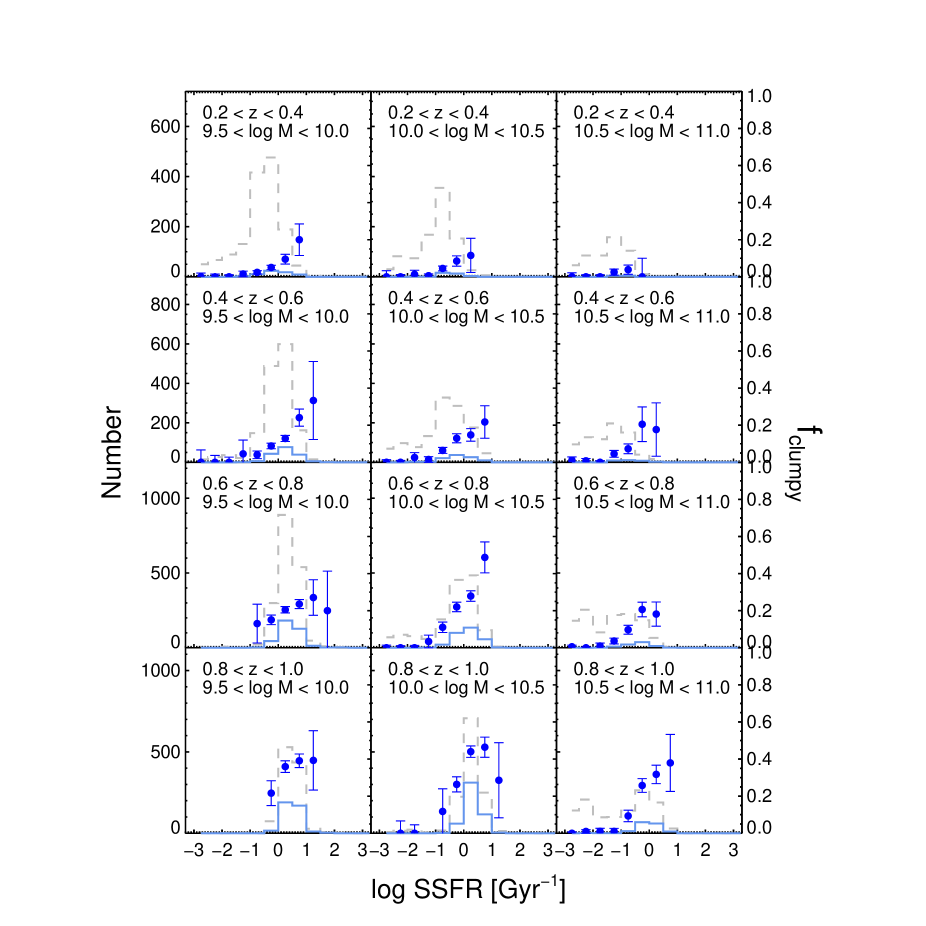
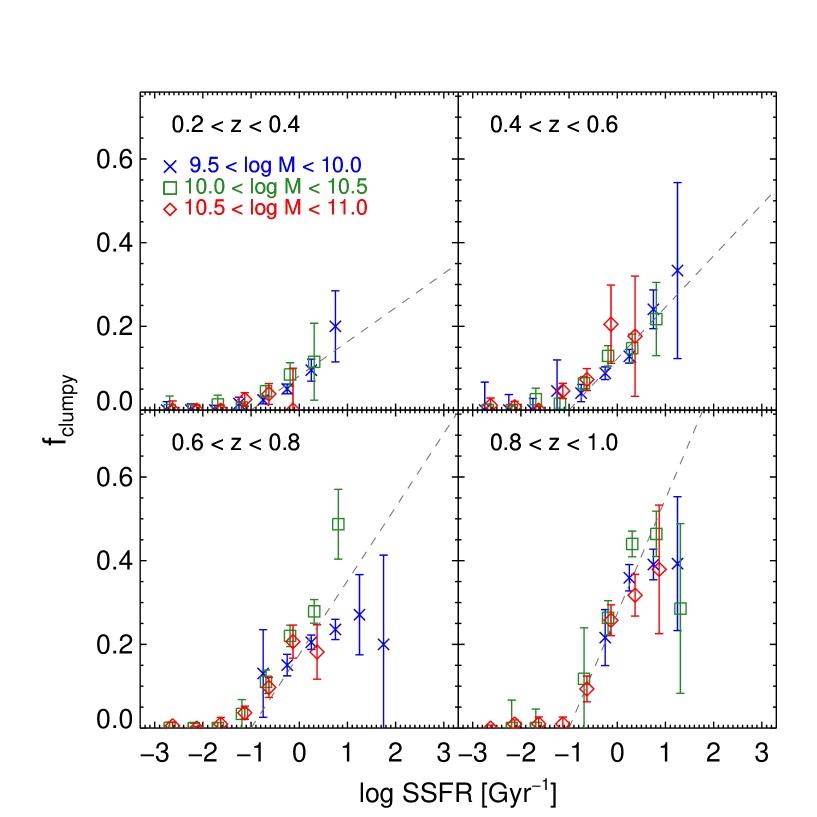
Furthermore, we investigated the fraction of clumpy galaxies as a function of SSFR in each mass and redshift range. Figure 7 shows the SSFR distribution and the fraction of clumpy galaxies as a function of SSFR. In this figure, we used all sample galaxies, including galaxies with Gyr-1. While the range of SSFRs of clumpy galaxies is similar to that of the other (non-clumpy) star-forming galaxies as shown in Figure 4, the distribution of SSFR of clumpy galaxies tends to be skewed toward higher values. In fact, the fraction of clumpy galaxies clearly increases with increasing SSFR in all the stellar mass and redshift ranges. Interestingly, we found that the fraction at a given SSFR is nearly independent of stellar mass in each redshift bin. In Figure 8, we show the fraction of clumpy galaxies as a function of SSFR for the different mass ranges in the same panel. The SSFR dependences of the fractions for the different stellar mass ranges are similar in each redshift bin, although the uncertainty of each data point is relatively large, especially at very high SSFR. In all the redshift ranges, we can see that the fraction increases with SSFR at Gyr-1, while it is negligible at Gyr-1. We can also see that the fraction of clumpy galaxies at a given SSFR decreases with time. For example, the fraction at Gyr-1 changes from at to at , while that at Gyr-1 decreases from to in the same redshift range. We fit the data points at Gyr-1 in each panel of Figure 8 with a linear line of , which satisfies at (the dashed lines in the figure). The best-fit slope of the linear line on the – plane clearly becomes steeper with redshift. Therefore, the fraction of clumpy galaxies at a given SSFR does not depend on stellar mass at each redshift, but evolves with time from to .
3.3. Possible Biases in Our Analysis
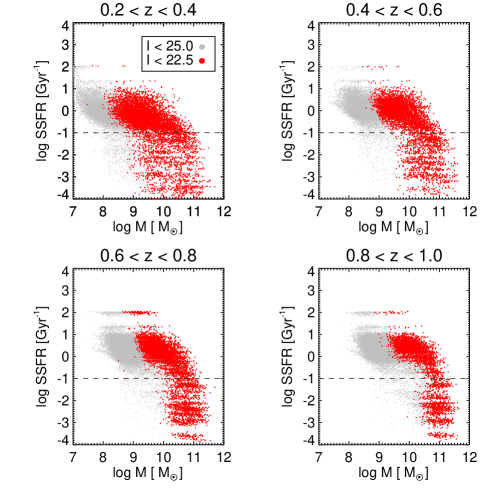
In this section, we checked the effects of possible biases on our results in the previous subsections. First, we considered the effects of our magnitude limit of , which is set to ensure a secure selection of clumpy galaxies. Since the observed band samples the rest-frame band at , the relatively bright -band magnitude limit can lead to a bias for galaxies with higher SSFRs at lower stellar mass. Therefore we may preferentially miss low-mass galaxies with relatively low SSFRs at higher redshift. In order to check this point in more detail, we show the SSFR-Mstar diagram for galaxies with and those with in Figure 9. It is shown that galaxies with relatively low SSFRs are missed by the -band magnitude limit at in the bin, while almost all galaxies with Gyr-1 are picked up down to at lower redshifts. In Figure 10, we show the fraction of clumpy galaxies in star-forming galaxies as in Figure 5 but for galaxies with . It is shown that the relatively high fraction around for galaxies at seen in Figure 5 becomes lower, and the fraction is consistent with a constant value of . This is because we include low-mass galaxies with relatively low SSFRs at high redshift by using galaxies down to . Although we can mitigate the bias against low-mass galaxies with low SSFRs by including more faint galaxies into the sample, we note that the selection of clumpy galaxies becomes less secure for galaxies at . On the other hand, the bias caused by the -band magnitude limit does not seem to affect the results in Figures 7 and 8, because the fraction of clumpy galaxies at a given SSFR is not changed by this effect. In fact, we performed the same analysis by using the different -band magnitude limits and confirmed that the trends seen in Figures 7 and 8 do not depend on the magnitude limit.
Second, we examined the effect of the morphological K-correction in our analysis. Since we selected our clumpy galaxies in the /ACS -band images, the morphological selection was done at the rest-frame band at , while galaxies at were classified at the rest-frame band. If the clumps tend to be more conspicuous in shorter wavelengths (e.g., Elmegreen et al. 2009a; Wuyts et al. 2012; see also Guo et al. 2012), our ability to select clumpy galaxies could be weaker at lower redshifts. In order to check this effect, we performed the same selection of clumpy galaxies at , using /ACS -band images, which correspond to the rest-frame band for these galaxies. The -band data were obtained in the CANDELS survey (Grogin et al. 2011; Koekemoer et al. 2011) and cover a field of arcmin2 in the COSMOS field. Although the area is 3.6% of the 1.64 deg2 field of the -band data, we can roughly estimate the effect of the morphological K-correction. For 100 star-forming galaxies with Gyr-1 at , we performed the same morphological analysis with the -band data and found that the fraction of clumpy galaxies increases from at the rest-frame band (the observed band) to 0.3–0.4 at the rest-frame band. Wuyts et al. (2012) also pointed out that the morphological K-correction significantly affects the fraction of clumpy galaxies at . Taking account of these results, we keep in mind the effect of the morphological K-correction when discussing the evolution of the fraction of clumpy galaxies in the following section.
4. DISCUSSION
In this study, we constructed a large sample of clumpy galaxies at in the COSMOS field using the /ACS data and investigated the fraction of these galaxies and its evolution as a function of stellar mass, SFR, and SSFR. This is the first systematic search for clumpy galaxies at . Our main results are as follows.
-
•
The fraction of clumpy galaxies in star-forming galaxies decreases with time from at to at irrespective of stellar mass, although the fraction tends to be slightly lower at in each redshift bin.
-
•
The fraction of clumpy galaxies increases with increasing both SFR and SSFR in all the redshift ranges we investigated. In particular, the SSFR dependences of the fractions are similar among galaxies with different stellar masses. Moreover, the fraction at a given SSFR does not depend on stellar mass in each redshift bin.
-
•
The fraction of clumpy galaxies at a given SSFR decreases with time at Gyr-1. This can be explained by the effect of the morphological K-correction.
We discuss these results and their implications for both origins and evolution of clumpy galaxies in the following subsections.
4.1. SSFR dependence of the fraction of clumpy galaxies
We found that the fraction of clumpy galaxies increases with increasing both SFR and SSFR. The similar fractions at a given SSFR among galaxies with different stellar masses may indicate that the SSFR is more important and fundamental physical parameter for the origin of the clumpy morphology. Among previous studies on clumpy galaxies, Bournaud et al. (2012) studied 14 clumpy galaxies and 13 smooth disk galaxies at selected by an eyeball classification, and found that the average and median SSFRs of clumpy galaxies are higher than those of smooth disk galaxies. Salmi et al. (2012) also reported that clumpy galaxies at have systematically higher SSFRs than the other star-forming galaxies at the same redshifts. They selected clumpy galaxies with a quantitative clumpiness parameter, but their measurement of the clumpiness includes the surface brightness fluctuation on relatively small scales. The SSFR dependence of the fraction of clumpy galaxies seen in Figure 7 is consistent with the results of these previous studies, although the selection methods for clumpy galaxies are different among the studies.
Since the SSFR is a current birth rate of stars relative to the integrated past star formation rate, it can be considered to represent the evolutionary stages of the stellar mass assembly by the star formation. In this view, the relatively high SSFRs of clumpy galaxies indicates that these galaxies may be systematically in younger stages in their star formation history. We can also consider the SSFR as a proxy for the gas mass to stellar mass ratio, Mgas/Mstar, if we naively assume that the SFRs of galaxies roughly reflect their gas mass. Clumpy galaxies are expected to be (probably young) objects with relatively high gas mass fraction in this case. Recently, the gravitational instability and fragmentation in gas-rich disks is often proposed as a possible origin of the clumpy morphology of high-redshift galaxies, which show both coherent rotation and relatively large velocity dispersion in their gas (e.g., Immeli et al. 2004; Bournaud et al. 2007; Dekel et al. 2009a; Bournaud et al. 2010; Genzel et al. 2012). Gas-rich rotational disks are gravitationally unstable for the fragmentation and lead to the formation of large clumps. In this framework, the gas mass fraction is a key physical parameter. The stability for the gravitational fragmentation of the disks and the maximum unstable mass scale strongly depend on the gas mass fraction (e.g., Escala & Larson 2008; Cacciato et al. 2012). If the SSFR is closely related to the gas mass fraction, the strong SSFR dependence of the fraction of clumpy galaxies in Figure 7 can be explained by the relationship between the gravitational fragmentation and the gas mass fraction of the rotational disks.
Escala (2011) also discussed that a large maximum unstable mass of gas-rich disks corresponds to a large velocity dispersion of turbulent motions of gas in the self-regulated quasi-stationary state with the Toomre parameter . They also claimed that the large velocity dispersion can cause an enhancement of star formation activity. In fact, the correlation between the mass of the most massive clump of galaxies and their surface SFR density has been observed at (Livermore et al. 2012; Swinbank et al. 2012). This scenario may explain the relatively higher SSFRs of clumpy galaxies.
Another possible origin of the clumpy morphology is the galaxy merger (e.g., Somerville et al. 2001; Lotz et al. 2004). For example, Di Matteo et al. (2008) performed extensive numerical simulations of major mergers and found that gas-rich major mergers can cause the greater disk fragmentation than the cases of isolated gas-rich galaxies. Morphological studies of high-redshift galaxies and comparisons of these objects with merger galaxies in the nearby universe suggested that some fraction of clumpy and irregular galaxies at are ongoing mergers (e.g., Lotz et al. 2008; Petty et al. 2009; Overzier et al. 2010). Mandelker et al. (2013) suggested that a non-negligible fraction of large clumps in high-redshift clumpy galaxies come from minor mergers, based on a numerical cosmological simulation of disk galaxies. Puech (2010) reported that a significant fraction of intermediate-mass clumpy galaxies at have complex kinematics, which is compatible with major mergers. In this scenario, the SSFR dependence of the fraction of clumpy galaxies can be understood by the enhancement of star formation caused by the galaxy mergers. The galaxy interaction/merger does not only cause disturbed and clumpy morphologies, but also triggers intense star formation. Thus the SSFRs of clumpy galaxies tend to be enhanced from the main sequence of star-forming galaxies. However, it is unclear whether such starbursts by mergers are consistent with the relatively tight SFR-Mstar relation or not (e.g., Noeske et al. 2007; Elbaz et al. 2007; Renzini 2009; Wuyts et al. 2011; Rodighiero et al. 2011).
4.2. Evolution of the fraction of clumpy galaxies
We found that the overall fraction of clumpy galaxies in star-forming galaxies with decreases from at to at . While many actively star-forming galaxies with clumpy morphologies have been observed at (e.g., Elmegreen et al. 2007; Genzel et al. 2008; Förster Schreiber et al. 2011), most relatively bright galaxies belong to the Hubble sequence and clumpy galaxies are very rare at (e.g., Overzier et al. 2010). Our result naturally connects between these previous studies in the early universe and those in the nearby universe, although the morphological K-correction may affect the result (Section 3.3). Wuyts et al. (2012) reported that the fraction of clumpy galaxies in star-forming galaxies at is 27 % when the selection for clumps was performed at the rest-frame band. Our result at (%), which was obtained at the rest-frame band (see Section 3.3), is consistent with their result, although the selection criteria for clumpy galaxies are different.
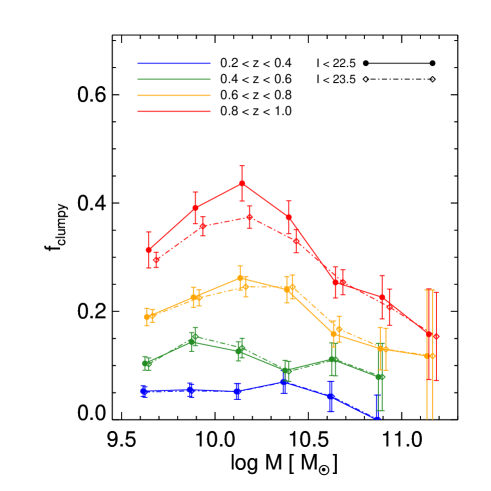
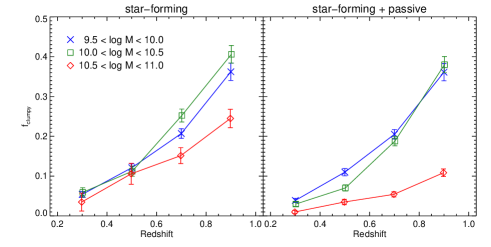
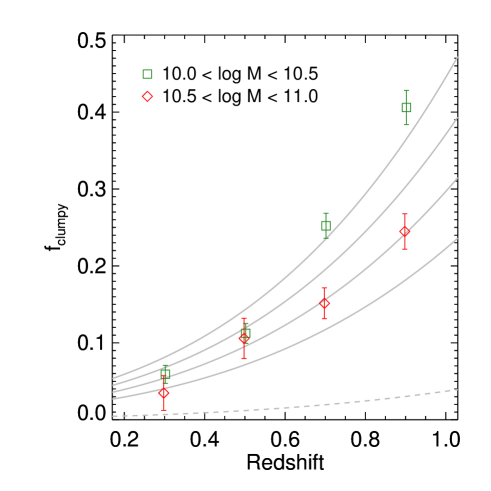
Several authors pointed out that the clumpy morphology persists to lower redshifts in lower-mass galaxies, so called “down-sizing effect” in the clumpy morphology (e.g., Elmegreen et al. 2009b; Elmegreen 2011). There are many bright/massive clumpy galaxies at , while such clumpy morphology can be seen only in low-mass systems such as dwarf irregular galaxies in the present universe. In Figure 11, we show the evolution of the fraction of clumpy galaxies with different stellar masses in order to investigate the down-sizing effect. The evolution is similar among the different mass samples, while the fraction of clumpy galaxies is slightly lower in massive galaxies with . The differences of the fraction among galaxies with different masses become larger when we include passive galaxies with Gyr-1 into the samples (the right panel of Figure 11). If we extrapolate the trend in Figure 11 to the present, the fraction of clumpy galaxies in more massive galaxies is expected to become negligible earlier. Therefore, our result is not inconsistent with the down-sizing picture, but the mass dependence of the evolution is weak in the stellar mass range we investigated. The lower fraction of clumpy galaxies in massive star-forming galaxies with at each redshift may be explained by lower SSFR of these massive galaxies (Figure 9).
Another our result of the SSFR dependence of the fraction of clumpy galaxies seen in all the mass and redshift ranges indicates that the evolution of the SSFRs of galaxies leads to the evolution of the fraction of clumpy galaxies. In fact, the median SSFR of star-forming galaxies decreases by dex from to (Figure 7). For example, if we assume the relation between the fraction of clumpy galaxies and SSFR at shown in Figure 8, the decrease of the SSFR from Gyr-1 (median value at ) to Gyr-1 (that at ) corresponds to the evolution of the fraction from to . Thus the evolution of the fraction of clumpy galaxies in star-forming galaxies at appear to be explained by the evolution of the SSFR. On the other hand, from such correlation between the fraction of clumpy galaxies and SSFR, the fraction of clumpy galaxies is expected to be higher at higher redshifts, because galaxies tend to have higher SSFRs than those at . Wuyts et al. (2012) found that the fraction of clumpy galaxies in star-forming galaxies with at is 42% when the morphological selection was done at the rest-frame band. Tadaki et al. (2014) also reported that 42% of H emitters at and 2.5 have clumpy morphology, although their clump selection was performed with both rest-frame UV and optical-bands images. The average SSFRs of star-forming galaxies at in both studies are Gyr-1, and therefore the fractions of clumpy galaxies of % in these studies seem to be consistent with the relation between the fraction of clumpy galaxies and SSFR at shown in Figure 8.
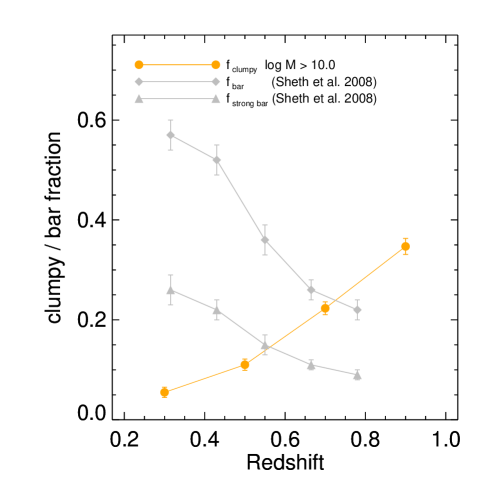
In the gravitational fragmentation model for the formation of giant clumps in disk galaxies, the rapid and smooth streams of gas along filaments effectively penetrate halos of galaxies at high redshift (e.g., Kereš et al. 2005; Dekel et al. 2009b). This “cold accretion” keeps active star formation and a high gas mass fraction of these galaxies, which leads to the formation of the clumpy morphology. In fact, such high gas mass fraction of star-forming galaxies at have been observed (e.g., Daddi et al. 2010; Tacconi et al. 2013), and the observed high turbulent velocity of gas in high-redshift clumpy galaxies also supports this scenario (e.g., Cresci et al. 2009; Förster Schreiber et al. 2009). Using an analytic model, Cacciato et al. (2012) predicted that such disks tend to stabilize at mainly due to the decrease of the gas mass fraction. They suggested that the decrease is attributed to the gradual decline of the cosmological accretion rate into halos of galaxies with time (e.g., Genzel et al. 2008), the gas consumption by the star formation, the inflows of clumps into the center of galaxies by the gravitational torque (e.g, Dekel et al. 2009a), and the gas outflows by the supernova feedback. If the SSFRs of galaxies are closely related to the gas mass fraction as discussed above, the evolution of the fraction of clumpy galaxies at could be explained by this scenario. The decrease of the gas mass fraction with time at causes the stabilization of galactic disks, while it also leads to the decrease of the SSFRs of these galaxies. Interestingly, several studies reported that the fraction of barred spiral galaxies increases with time in the same redshift range (e.g., Abraham et al. 1999; Sheth et al. 2008; Melvin et al. 2014). The bar instability is considered to occur in “mature”systems where stellar disk is dynamically cold and rotationally supported, and the surface stellar density is sufficiently high. Clumpy galaxies may evolve to these barred galaxies when the gas fraction becomes lower and the stellar disk is stabilized (e.g., Immeli et al. 2004; Sheth et al. 2012; Kraljic et al. 2012). In Figure 12, we compare the fraction of clumpy galaxies with the fraction of barred spiral galaxies in the same COSMOS field from Sheth et al. (2008). Note that since the bar fraction in Sheth et al. (2008) is the fraction of barred galaxies in face-on spiral galaxies with excluding irregular galaxies, it is difficult to directly compare the absolute values of the both fractions. Nevertheless, we can see the fraction of barred spiral galaxies increases with time, as the fraction of clumpy galaxies decreases in the figure. The transition from clumpy galaxies to barred spiral galaxies may gradually occur from to .
On the other hand, in the major merger scenario for the origin of the clumpy morphology, the evolution of the major merger rate may explain the evolution of the fraction of clumpy galaxies at . Many observational studies have found that the major merger rate decreases with time at (e.g., Le Fèvre et al. 2000; Conselice et al. 2003; Lin et al. 2008; de Ravel et al. 2009; Xu et al. 2012; see also Lotz et al. 2011). In particular, several studies reported that the gas-rich wet major merger, which is considered to be important for making the clumpy morphology (Di Matteo et al. 2008), decreases with time in the redshift range (Chou et al. 2011; Puech et al. 2012; López-Sanjuan et al. 2013). Figure 13 compares the observed fraction of clumpy galaxies at with that expected from the wet major merger rate of galaxies with by López-Sanjuan et al. (2013). We multiplied the major merger rate from López-Sanjuan et al. (2013) by an arbitrary time scale when the merged galaxies are seen as clumpy galaxies to estimate the expected fraction of clumpy galaxies. The evolution of clumpy galaxies can be roughly explained by the evolution of the major merger rate with the time scales of 3–6 Gyr. However, these time scales seem to be too long for the merger time scale during which the morphology is disturbed and clumpy (e.g., Di Matteo et al. 2008; Lotz et al. 2010). If we assume a typical merger time scale of Gyr, the expected fraction of clumpy galaxies become much lower than the observed fraction at (the dashed line in Figure 13). It seems to be difficult to explain the fraction of clumpy galaxies at only by the wet major merger.
Finally, we note that the fraction of clumpy galaxies at a given SSFR decreases with time from to . This can be due to the morphological K-correction because we selected clumpy galaxies at the observed band as discussed in Section 3.3. If this is the case, the intrinsic fraction of clumpy galaxies at a given SSFR could not depend on redshift. There may be the universal relation between the fraction of clumpy galaxies and SSFR.
We would like to thank the anonymous referee for valuable comments and suggestions. We also thank Tsutomu T. Takeuchi at Nagoya University for his generous support to K. L. M. and for useful discussion. The HST COSMOS Treasury program was supported through NASA grant HST-GO-09822. We greatly acknowledge the contributions of the entire COSMOS collaboration consisting of more than 70 scientists. This work was financially supported in part by the Japan Society for the Promotion of Science (Nos. 17253001, 19340046, 23244031, and 23740152).
References
- Abraham et al. (1999) Abraham, R. G., Merrifield, M. R., Ellis, R. S., Tanvir, N. R., & Brinchmann, J. 1999, MNRAS, 308, 569
- Bertin & Arnouts (1996) Bertin, E., & Arnouts, S. 1996, A&AS, 117, 393
- Bournaud et al. (2007) Bournaud, F., Elmegreen, B. G., & Elmegreen, D. M. 2007, ApJ, 670, 237
- Bournaud et al. (2010) Bournaud, F., Elmegreen, B. G., Teyssier, R., Block, D. L., & Puerari, I. 2010, MNRAS, 409, 1088
- Bournaud et al. (2012) Bournaud, F., Juneau, S., Le Floc’h, E., et al. 2012, ApJ, 757, 81
- Bruzual & Charlot (2003) Bruzual, G., & Charlot, S. 2003, MNRAS, 344, 1000
- Cacciato et al. (2012) Cacciato, M., Dekel, A., & Genel, S. 2012, MNRAS, 421, 818
- Calzetti et al. (2000) Calzetti, D., Armus, L., Bohlin, R. C., et al. 2000, ApJ, 533, 682
- Cameron et al. (2011) Cameron, E., Carollo, C. M., Oesch, P. A., et al. 2011, ApJ, 743, 146
- Chabrier (2003) Chabrier, G. 2003, PASP, 115, 763
- Chou et al. (2011) Chou, R. C. Y., Bridge, C. R., & Abraham, R. G. 2011, AJ, 141, 87
- Conselice et al. (2003) Conselice, C. J., Bershady, M. A., Dickinson, M., & Papovich, C. 2003, AJ, 126, 1183
- Cowie et al. (1995) Cowie, L. L., Hu, E. M., & Songaila, A. 1995, AJ, 110, 1576
- Cresci et al. (2009) Cresci, G., Hicks, E. K. S., Genzel, R., et al. 2009, ApJ, 697, 115
- Daddi et al. (2010) Daddi, E., Bournaud, F., Walter, F., et al. 2010, ApJ, 713, 686
- Dekel et al. (2009a) Dekel, A., Sari, R., & Ceverino, D. 2009a, ApJ, 703, 785
- Dekel et al. (2009b) Dekel, A., Birnboim, Y., Engel, G., et al. 2009b, Nature, 457, 451
- de Ravel et al. (2009) de Ravel, L., Le Fèvre, O., Tresse, L., et al. 2009, A&A, 498, 379
- Di Matteo et al. (2008) Di Matteo, P., Bournaud, F., Martig, M., et al. 2008, A&A, 492, 31
- Elbaz et al. (2007) Elbaz, D., Daddi, E., Le Borgne, D., et al. 2007, A&A, 468, 33
- Elmegreen (2011) Elmegreen, B. G. 2011, EAS Publications Series, 51, 59
- Elmegreen et al. (2009a) Elmegreen, B. G., Elmegreen, D. M., Fernandez, M. X., & Lemonias, J. J. 2009a, ApJ, 692, 12
- Elmegreen et al. (2009b) Elmegreen, D. M., Elmegreen, B. G., Marcus, M. T., et al. 2009b, ApJ, 701, 306
- Elmegreen et al. (2007) Elmegreen, D. M., Elmegreen, B. G., Ferguson, T., & Mullan, B. 2007, ApJ, 663, 734
- Elvis et al. (2009) Elvis, M., Civano, F., Vignali, C., et al. 2009, ApJS, 184, 158
- Escala & Larson (2008) Escala, A., & Larson, R. B. 2008, ApJ, 685, L31
- Escala (2011) Escala, A. 2011, ApJ, 735, 56
- Förster Schreiber et al. (2006) Förster Schreiber, N. M., Genzel, R., Lehnert, M. D., et al. 2006, ApJ, 645, 1062
- Förster Schreiber et al. (2009) Förster Schreiber, N. M., Genzel, R., Bouché, N., et al. 2009, ApJ, 706, 1364
- Förster Schreiber et al. (2011) Förster Schreiber, N. M., Shapley, A. E., Genzel, R., et al. 2011, ApJ, 739, 45
- Genzel et al. (2008) Genzel, R., Burkert, A., Bouché, N., et al. 2008, ApJ, 687, 59
- Genzel et al. (2012) Genzel, R., Tacconi, L. J., Combes, F., et al. 2012, ApJ, 746, 69
- Grogin et al. (2011) Grogin, N. A., Kocevski, D. D., Faber, S. M., et al. 2011, ApJS, 197, 35
- Guo et al. (2012) Guo, Y., Giavalisco, M., Ferguson, H. C., Cassata, P., & Koekemoer, A. M. 2012, ApJ, 757, 120
- Hasinger et al. (2007) Hasinger, G., Cappelluti, N., Brunner, H., et al. 2007, ApJS, 172, 29
- Hubble (1936) Hubble, E. P. 1936, Realm of the Nebulae, by E.P. Hubble. New Haven: Yale University Press, 1936. ISBN 9780300025002,
- Ilbert et al. (2013) Ilbert, O., McCracken, H. J., Le Fèvre, O., et al. 2013, A&A, 556, A55 q
- Ilbert et al. (2010) Ilbert, O., Salvato, M., Le Floc’h, E., et al. 2010, ApJ, 709, 644
- Ilbert et al. (2009) Ilbert, O., Capak, P., Salvato, M., et al. 2009, ApJ, 690, 1236
- Immeli et al. (2004) Immeli, A., Samland, M., Westera, P., & Gerhard, O. 2004, ApJ, 611, 20
- Kajisawa & Yamada (2001) Kajisawa, M., & Yamada, T. 2001, PASJ, 53, 833
- Kajisawa et al. (2010) Kajisawa, M., Ichikawa, T., Yamada, T., et al. 2010, ApJ, 723, 129
- Kereš et al. (2005) Kereš, D., Katz, N., Weinberg, D. H., & Davé, R. 2005, MNRAS, 363, 2
- Koekemoer et al. (2007) Koekemoer, A. M., Aussel, H., Calzetti, D., et al. 2007, ApJS, 172, 196
- Koekemoer et al. (2011) Koekemoer, A. M., Faber, S. M., Ferguson, H. C., et al. 2011, ApJS, 197, 36
- Kraljic et al. (2012) Kraljic, K., Bournaud, F., & Martig, M. 2012, ApJ, 757, 60
- Le Fèvre et al. (2000) Le Fèvre, O., Abraham, R., Lilly, S. J., et al. 2000, MNRAS, 311, 565
- Lin et al. (2008) Lin, L., Patton, D. R., Koo, D. C., et al. 2008, ApJ, 681, 232
- Livermore et al. (2012) Livermore, R. C., Jones, T., Richard, J., et al. 2012, MNRAS, 427, 688
- López-Sanjuan et al. (2013) López-Sanjuan, C., Le Fèvre, O., Tasca, L. A. M., et al. 2013, A&A, 553, A78
- Lotz et al. (2004) Lotz, J. M., Primack, J., & Madau, P. 2004, AJ, 128, 163
- Lotz et al. (2008) Lotz, J. M., Davis, M., Faber, S. M., et al. 2008, ApJ, 672, 177
- Lotz et al. (2010) Lotz, J. M., Jonsson, P., Cox, T. J., & Primack, J. R. 2010, MNRAS, 404, 590
- Lotz et al. (2011) Lotz, J. M., Jonsson, P., Cox, T. J., et al. 2011, ApJ, 742, 103
- Mandelker et al. (2013) Mandelker, N., Dekel, A., Ceverino, D., et al. 2013, arXiv:1311.0013
- Melvin et al. (2014) Melvin, T., Masters, K., Lintott, C., et al. 2014, MNRAS, 438, 2882
- Noeske et al. (2007) Noeske, K. G., Weiner, B. J., Faber, S. M., et al. 2007, ApJ, 660, L43
- Noguchi (1998) Noguchi, M. 1998, Nature, 392, 253
- Overzier et al. (2009) Overzier, R. A., Heckman, T. M., Tremonti, C., et al. 2009, ApJ, 706, 203
- Overzier et al. (2010) Overzier, R. A., Heckman, T. M., Schiminovich, D., et al. 2010, ApJ, 710, 979
- Petty et al. (2009) Petty, S. M., de Mello, D. F., Gallagher, J. S., III, et al. 2009, AJ, 138, 362
- Puech (2010) Puech, M. 2010, MNRAS, 406, 535
- Puech et al. (2012) Puech, M., Hammer, F., Hopkins, P. F., et al. 2012, ApJ, 753, 128
- Renzini (2009) Renzini, A. 2009, MNRAS, 398, L58
- Rodighiero et al. (2011) Rodighiero, G., Daddi, E., Baronchelli, I., et al. 2011, ApJ, 739, L40
- Salmi et al. (2012) Salmi, F., Daddi, E., Elbaz, D., et al. 2012, ApJ, 754, L14
- Santini et al. (2009) Santini, P., Fontana, A., Grazian, A., et al. 2009, A&A, 504, 751
- Scoville et al. (2007) Scoville, N., Aussel, H., Brusa, M., et al. 2007, ApJS, 172, 1
- Sheth et al. (2008) Sheth, K., Elmegreen, D. M., Elmegreen, B. G., et al. 2008, ApJ, 675, 1141
- Sheth et al. (2012) Sheth, K., Melbourne, J., Elmegreen, D. M., et al. 2012, ApJ, 758, 136
- Somerville et al. (2001) Somerville, R. S., Primack, J. R., & Faber, S. M. 2001, MNRAS, 320, 504
- Steidel et al. (1996) Steidel, C. C., Giavalisco, M., Dickinson, M., & Adelberger, K. L. 1996, AJ, 112, 352
- Swinbank et al. (2012) Swinbank, A. M., Smail, I., Sobral, D., et al. 2012, ApJ, 760, 130
- Tacconi et al. (2010) Tacconi, L. J., Genzel, R., Neri, R., et al. 2010, Nature, 463, 781
- Tacconi et al. (2013) Tacconi, L. J., Neri, R., Genzel, R., et al. 2013, ApJ, 768, 74
- Tadaki et al. (2014) Tadaki, K.-i., Kodama, T., Tanaka, I., et al. 2014, ApJ, 780, 77
- Wright et al. (2007) Wright, S. A., Larkin, J. E., Barczys, M., et al. 2007, ApJ, 658, 78
- Wuyts et al. (2011) Wuyts, S., Förster Schreiber, N. M., Lutz, D., et al. 2011, ApJ, 738, 106
- Wuyts et al. (2012) Wuyts, S., Förster Schreiber, N. M., Genzel, R., et al. 2012, ApJ, 753, 114
- Xu et al. (2012) Xu, C. K., Shupe, D. L., Béthermin, M., et al. 2012, ApJ, 760, 72