Rummaging inside the Eskimo’s parka: Variable asymmetric PN fast wind and a binary nucleus?
Abstract
We report on high-resolution optical time-series spectroscopy of the central star of the ‘Eskimo’ planetary nebula NGC 2392. Datasets were secured with the ESO 2.3m in 2006 March and CFHT 3.6m in 2010 March to diagnose the fast wind and photospheric properties of the central star. The Hei and Heii recombination lines reveal evidence for clumping and temporal structures in the fast wind that are erratically variable on timescales down to 30 min. (i.e. comparable to the characteristic wind flow time). We highlight changes in the overall morphology of the wind lines that cannot plausibly be explained by line-synthesis model predictions with a spherically homogeneous wind. Additionally we present evidence that the UV line profile morphologies support the notion of a high-speed, high-ionization polar wind in NGC 2392. Analyses of deep-seated, near-photospheric absorption lines reveals evidence for low-amplitude radial velocity shifts. Fourier analysis points tentatively to a 0.12-d modulation in the radial velocities, independently evident in the ESO and CFHT data. We conclude that the overall spectroscopic properties support the notion of a (high inclination) binary nucleus in NGC 2392 and an asymmetric fast wind.
keywords:
stars: mass-loss stars: evolution stars: individual: NGC 2392 optical: stars1 Introduction
Planetary nebulae (PNe) are a key pathway in the evolution of low to intermediate mass stars, and their central stars are the immediate precursors of white dwarfs. Studies of PN central stars (herein CSPNe) are motivated by: The desire to understand the origin of the rich variety of PN morphologies; to establish the mass-loss process via fast winds driven by radiation pressure by spectral lines; and to secure fundamental stellar parameters that can test post-AGB stellar evolution models.
Time-series spectroscopy is an important diagnostic tool in developing our understanding of CSPNe. Recently, far-UV and UV datasets have revealed signatures of large-scale wind structures and evidence for modulated temporal behaviour that may provide a handle on the central star rotation rates (e.g. Prinja et al. 2012a, 2012b). Similarities between the wind properties of H-rich CSPNe and those of massive Population I OB stars (which also have line-driven winds) suggest that instabilities in variable fast winds may result in shock heated gas which emits X-rays in the central cavities of PNe (e.g. Guerrero 2006; Kastner et al. 2012). In the optical waveband, time-series data are requisite for establishing systematic radial velocity shifts in CSPNe absorption lines. De Marco et al. (2004) have for example conducted a radial velocity survey of 11 CSPNe to provide constraints on the binary properties of the parent AGB population and thus the extent to which binarity may play a causal role in shaping non-spherical nebulae.
In this paper we present time-series optical spectra of the central star of NGC 2392 (Eskimo nebula). Our study is motivated by several interesting characteristics, discrepancies and scenarios for this PN: (i) The central star of NGC 2392 exhibits high He, N and low C, O abundances suggesting that the photosphere has been processed (Méndez et al. 2012). A possible scenario is that the abnormal central star abundances are due to a common-envelope evolutionary phase thus implying a close binary companion; (ii) Danehkar et al. (2011) employ photoionization models of high excitation PN emission lines to argue that NGC 2392 has a hot white dwarf ( 1 M⊙) companion; (iii) Detailed kinematic modelling of the (Eskimo) nebula by Garcia-Diaz et al. (2012) supports a near-pole orientation, complex nebula morphology with multiple kinematic components, and an evolution path that may invoke a common-envelope binary; (iv) The extended and point X-ray emission from NGC 2392 (e.g. Kastner et al. 2012) is not entirely consistent with the predicted thermal energy converted from the kinetic energy of the fast wind. Additional coronal energy from a binary companion may explain the observed high X-ray temperatures.
Despite all the implications of the above studies, there is no definitive evidence so far of a binary nucleus in NGC 2392, and the time-variable and geometric characteristics of its fast wind are not established. In this study we present the analysis of high-resolution optical time-series datasets secured over two epochs in 2006 and 2010 using the 3.6m ESO and Canada-France-Hawaii (CFHT) observatories. Our goal is to investigate for the first time hourly changes in the fast wind of NGC 2392 and fluctuations close to the surface of the central star. We characterise here evidence for evolving structure in the outflow and indications of radial velocity changes in deep-seated absorption lines.
2 Optical spectroscopy
A log of the time-series spectra of the central star of NGC 2392 is given in Table 1. Thirteen spectra were secured over 3 consecutive nights in 2010 March using the ESPaDonS echelle spectrograph (Manset & Donati, 2003; Donati et al. 1997) on the 3.6m CFHT at Mauna Kea, Hawaii. The continuum signal-to-noise ratio (S/N) of an individual spectrum is 100 for 30 min exposures, with a spectral resolution, R, 68000. The data were reduced using the standard CFHT pipeline Upena. The CFHT data are complemented in this study by 18 spectra obtained at the ESO La Silla 3.6m telescope using the HARPS echelle spectrograph (Mayor et al., 2003). The ESO observations were carried out by us during 2006 March over 3 consecutive nights (Table 1). Typical individual HARPS spectra have S/N 40 (for 30 min exposures) and R 110,000. The ESO automatic online pipeline was used for homogeneous reduction.
| Observatory | MJD range (days) | No. of spectra |
|---|---|---|
| ESO HARPS | 53818.002 53818.109 | 6 |
| 53818.995 53819.101 | 6 | |
| 53820.002 53820.108 | 6 | |
| CFHT ESPaDOnS | 55256.358 55256.447 | 5 |
| 55257.271 55257.337 | 4 | |
| 55258.270 55258.336 | 4 |
All the spectra were normalised by fitting a low-order polynomial through continuum windows. The line profiles discussed here have been corrected for a radial velocity of 82 km s-1, measured in weak absorption lines. The fundamental central star parameters adopted in this study are listed in Table 2.
| Parameter | Value | Reference |
|---|---|---|
| Sp. type | Of (H-rich) | Méndez et al. (1991) |
| 400 km s-1 | Kaschinski et al. (2012) | |
| sin() | 50 km s-1 | Méndez et al. (2012) |
| Teff | 43000 K | Méndez et al. (2012) |
| R⋆ | 1.9 R⊙ | Méndez et al. (2012) |
| Radial velocity | 82 km s-1 | This paper |
= wind terminal velocity; sin() = projected rotation velocity.
3 Time-variable fast wind
As is generally the case with hot stars, radiation pressure driven winds are ideally diagnosed via UV resonance lines formed by the re-distribution of the stellar continuum radiation through line scattering. High-resolution International Ultraviolet Explorer () and Far-Ultraviolet Spectroscopic Explorer () satellite data of the central star in NGC 2392 have been presented by e.g. Patriarchi & Perinotto (1995); Herald & Bianchi (2011) and Kaschinski et al. (2012). The consensus is that the fast wind has a terminal velocity, , 400 km s-1 and (smooth wind) mass-loss rate 35 10-8 M⊙ yr-1.
|
 |
|---|---|
|
 |
|
 |
|
 |
|---|---|
|
 |
|
 |
There are no archival FUV or UV time-series datasets available for NGC 2392 that permit an investigation of systematic variability on time-scales comparable to the wind flow time (i.e. hours). Patriarchi & Perinotto (1995) show sparse spectra separated by 7 years which suggest some fluctuations in the Civ and Nv lines, and Guerrero & De Marco (2013) comment on the two FUSE spectra available for the central star.
The optical time-series data of the nuclei of NGC 2392 that we present here provide access to the fast wind via excited transitions arising from Hei and Heii. (Note that the H and H lines are heavily affected by nebular emission.) The He lines are primarily the result of recombination from a higher ionization stage followed by a radiative de-excitation. Since recombination is sensitive to the square of wind density (), the optical lines form in the densest region of the wind (in contrast to the UV lines). Furthermore the Hei 5876 (23P0 33D) transition is a potential exception if large populations are acquired in its lower level such that it effectively becomes the ground level and consequently behaves as a scattering or resonance line.
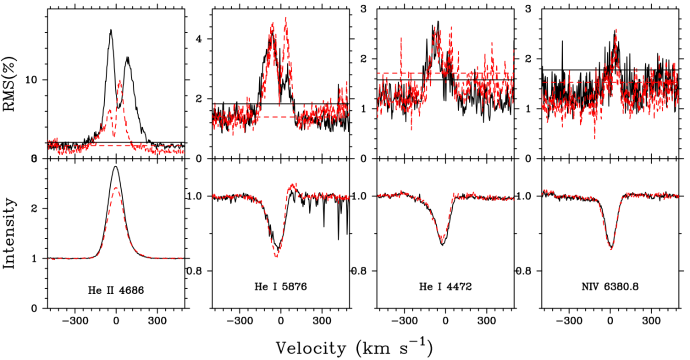
We find that the stellar lines in the optical spectra of NGC 2392 are undoubtedly variable within hours, with peak-to-peak amplitude changes of 5% in Hei 5876 and Heii 4686. The corresponding equivalent width and standard deviations for the combined ESO and CFHT datasets are 0.32Å s.d. 0.12Å and 3.8Å s.d. 0.6Å. The line profile variability is quantified in Fig. 1 where we employ the Temporal Variance Spectrum (TVS) method (e.g. Fullerton et al. 1996) to estimate the statistical significance of the changes, having accounted for differences in the data quality at spectrum and pixel levels. The variability level is higher in Heii 4686 than Hei 5876 or Hei 4472; note that numerous other stellar lines are also weakly variable in the night-to-night data. Significant variability extends to 180 km s-1 (i.e. 0.45 ) in the ESO (2006) and CFHT (2010) spectra of Heii 4686, but the redward extend of these changes is lower in 2010 compared to 2006. For both epochs the Hei 5876 weak P Cygni profile varies between 150 km s-1 to 100 km s-1. An important feature of the TVS in Fig. 1 is that it is double-peaked in the Heii and Hei lines for the ESO and CFHT datasets. Typically the peaks in the TVS are separated by 100 to 120 km s-1. The amplitude of the TVS peaks are not systematically stronger or weaker in either the blue or red sides. For line profile variability dominated by clumps we may expect small-scale structure to be distributed evenly over the whole inner wind thus presenting a broadly symmetrical single-peak TVS. One possibility for the double-peak TVS is that it results from radial velocity shifts perhaps due to a binary nature in NGC 2392. We return to the issue of radial velocity changes in Sect. 4.
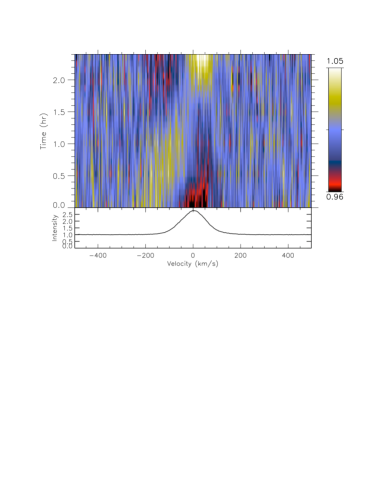
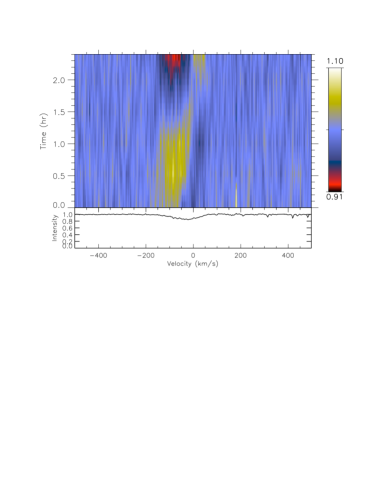
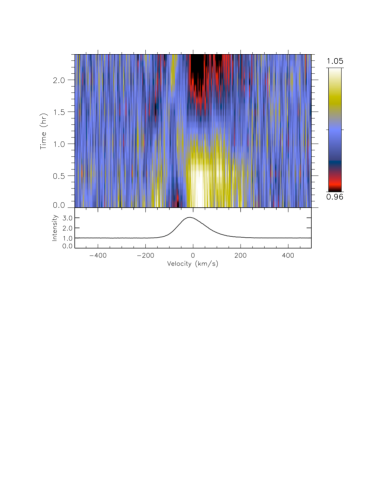
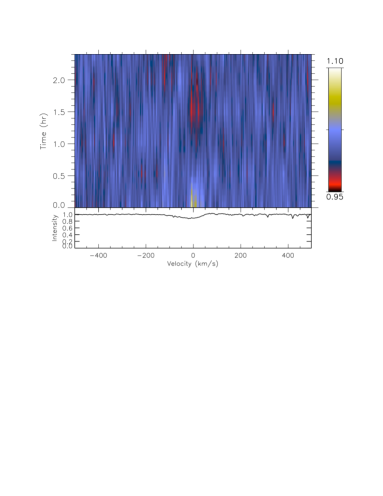
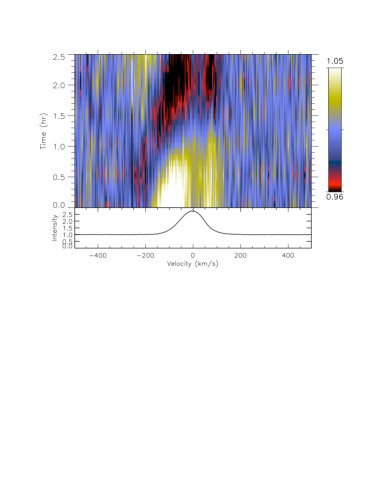
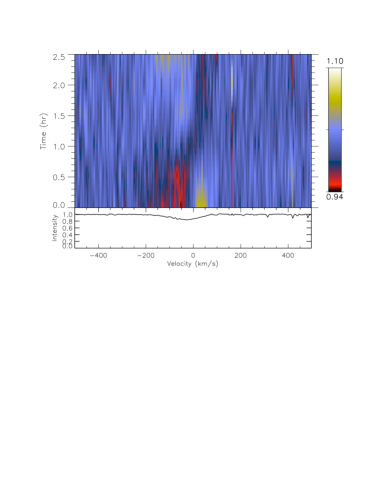
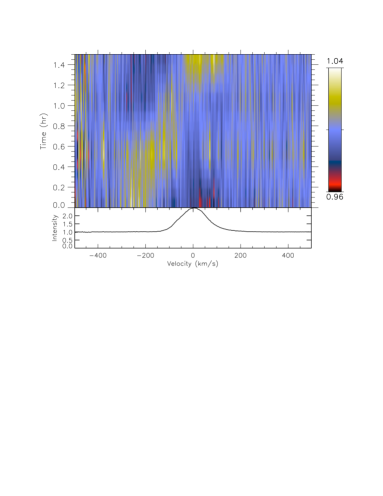
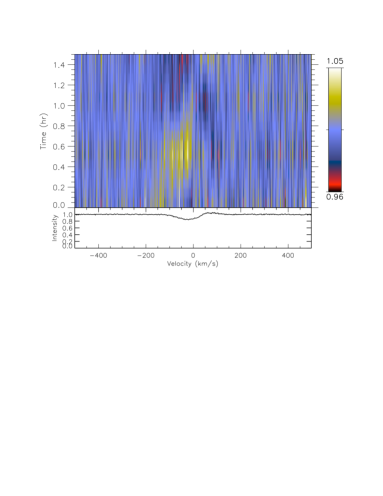
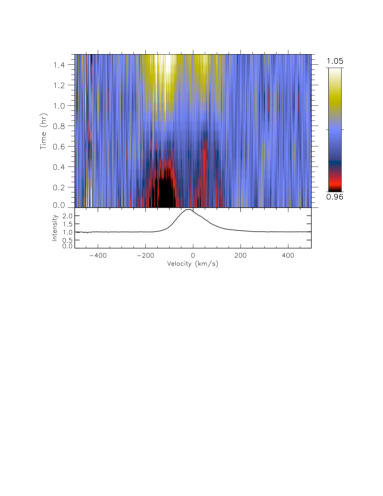
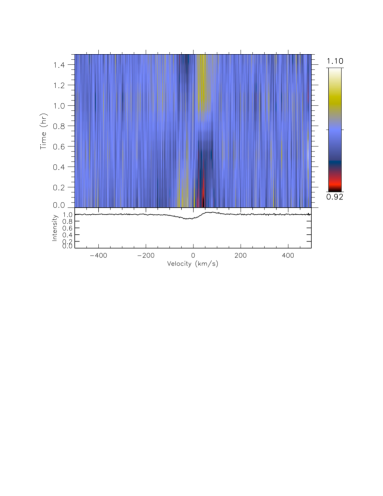
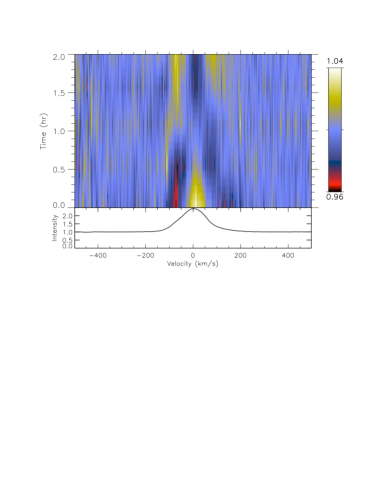
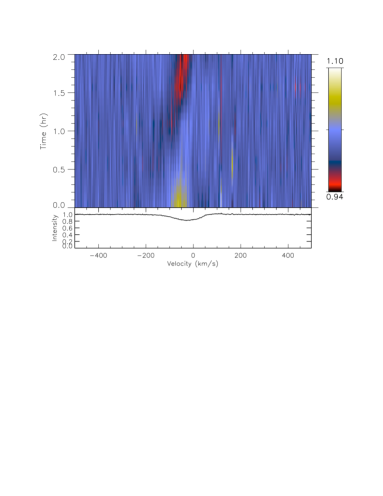
The systematics of the Heii 4686 and Hei 5876 profile changes are examined further in Figs. 2 and 3 where the data are displayed in two-dimensional velocitytime dynamic spectra (images). The intensity levels of individual spectra are determined as differences with respect to the average spectrum for each observing night, and represented by a colour scale from minimum (black) to maximum (white) intensity cut level. The features seen in Figs. 2 and 3 therefore represent pseudo-absorption and pseudo-emission features relative to the mean. The fast wind in NGC 2392 is undoubtedly variable on very short time-scales and can switch between an overall pseudo-emission to pseudo-absorption pattern in the dynamic spectra in less than 30 minutes (i.e. time lengths comparable to the characteristic wind flow time, ).
The evidence from Figs. 2 and 3 is that episodes of strong blue and red changes in Heii 4686 are mimicked in Hei 5876 at the same velocities. For example enhanced redward emission in Heii 4686 is accompanied by an increase in the (weak) P Cygni emission component in Hei 5876. A substantial low velocity blueward emission increase in Heii 4686 is ‘matched’ by an increase in the P Cygni absorption strength in Hei 5876. The overall impression from our optical time-series is that the fast wind in NGC 2392 is stochastically variable over hours as opposed to revealing coherent modulated behaviour. We do not for example see signs of blueward and/or redward migrating features during each night, nor is there evidence for much slower evolving (large-scale) structures in the wind that persist over 3 nights.
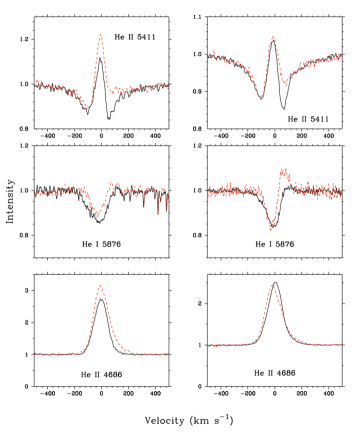
The overall line profile morphology can change in complex manners from night-to-night. We show in Fig. 4 corresponding pairs of Hei 5876, Heii 5411 and Heii 4686 spectra. Each pair is separated by 1 day. The left-hand panel in Fig. 4 shows a case where as the total Hei 5876 absorption increases across all velocities, in the corresponding Heii 4686 pair the overall emission decreases. For this same pair, the changes in Heii 5411 are however clearly asymmetric toward redward velocities. In a further twist, the right-hand panels in Fig. 4 show a case where the Hei 5876 line profile transforms from an absorption profile to a clear P Cygni profile with redward emission. In this case the corresponding Heii 4686 pair exhibit almost no change in total equivalent width but the peak emission shifts blueward by 30 km s-1. But, once more, the Heii 5411 profile changes are almost entirely at redward velocities.
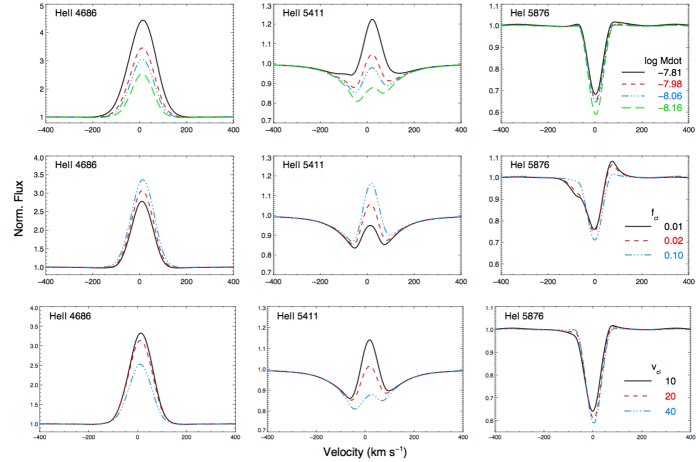
To gain further insights into the implications of these overall profile changes, we examined model predictions using the unified non-LTE, line-blanketed model atmosphere code CMFGEN (e.g. Hillier & Miller 1998). Briefly, CMFGEN solves the non-LTE radiation transfer problem assuming a chemically homogeneous, spherically symmetric, steady-state outflow. Each model is defined by the stellar radius, the luminosity, the mass-loss rate, the wind terminal velocity (), the stellar mass and by the abundances of the species included in the calculations. The code does not solve for the hydrodynamical structure, hence the velocity field has to be defined using the output of a plane-parallel model (TLUSTY in this case; see Hubeny & Lanz, 1995) to define the pseudo-static photosphere, connected just below the sonic point to a beta-type velocity law to describe the wind regime. We calculated a substantial grid of CMFGEN model atmosphere spectra and explored sequences of different mass-loss and clumping. The mass-loss rate has been incremented between 7 10-9 M⊙ yr-1 to 1.6 10-8 M⊙ yr-1. We also adjusted the clumping factor, , which measures the over-density inside the clumps with respect to the average wind density. Finally, the velocity at which optically thin clumping starts () near the stellar surface was adjusted between 10 km s-1 to 40 km s-1, using an exponential law defined by the parameters and . In each sequence all but one of the above parameters are kept fixed. The model sequences are shown in Fig. 5 for Heii 4686, Heii 5411 and Hei 5876. Comparisons between this grid with variable mass-loss rates and wind clumping sequences lead us to conclude that the absorption versus emission strength changes seen in the CFHT and ESO data in the left-hand panels in Fig. 4 may qualitatively be explained by (global) mass-loss differences, but not the asymmetric behaviour evident in Heii 5411. Furthermore the relatively large emission line shift seen in the right-hand panels in Fig. 4 cannot be explained by line-synthesis model predictions with a spherically homogeneous wind.
4 Deep-seated and photospheric changes
Ordinarily the search for radial velocity shifts in symmetric photospheric absorption lines would be a relatively straightforward exercise in hot stars. Trends in velocity changes may then betray for example the causal role of stellar binarity or multiplicity. The situation in NGC 2392 is more complex however for two key reasons; (i) we have demonstrated in Sect. 3 that the nucleus of NGC 2392 drives a highly variable fast wind, and the origin of these changes are deep-seated and close to the stellar surface. This means that a large selection of the He i, He ii and metal absorption lines in the optical spectra may be disturbed by the effects of a variable wind; (ii) in their analysis of the 3-D and kinematic structure of the nebula, Garcia-Diaz et al. (2012) present evidence that the inner nebular shell has an almost pole-on orientation, such that the inclination angle with respect to the line-of-sight is only . Assuming that the central star has the same orientation, the geometry is obviously not favourable for the detection of binary induced radial velocity motion of the nucleus.
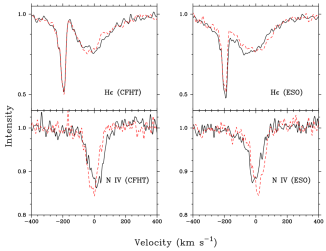
Taking up this challenge nevertheless, we have examined weak, relatively symmetrical stellar absorption lines in NGC 2392 for evidence of radial velocity shifts. The CMFGEN line-synthesis models (Sect. 3) suggest that most of the optical lines in NGC 2392 are potentially affected by mass-loss and wind clumping changing. Our grid of models points to the Niv 6380.8 absorption line as a rare example of a primarily photospheric absorption line, suitable for a study of subtle radial velocity fluctuations. Inspection of the time-series data suggests that the Niv line does in fact shift in central velocity by 10 to 15 km s-1 in the ESO and CFHT datasets, over hourly timescales. Pairs of Niv profiles separated by 2 hours are shown in Fig. 6 where the central minimum and blue and red wings are shifted by 15 km s-1. A particularly useful consistency check is provided by H, since the Caii H 3968.5 interstellar/circumsystem lines provide an excellent nearby fiducial for the accuracy of the wavelength scale close to H. We note in Fig. 6 that the velocity behaviour seen in Niv is systematically mimicked in H, thus firming confidence in the notion that there is a genuine radial velocity shift in NGC 2392.
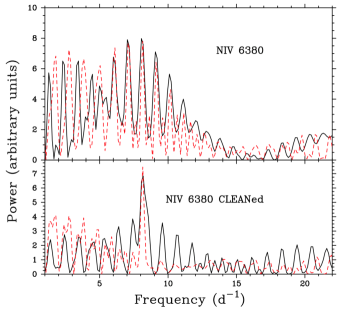
The Niv line profiles were fitted with Gaussian model profiles with least squares to estimate the central absorption velocities. For a typical internal fitting error of 1 km s-1, the mean and median absolute deviation (MAD) of the ESO and CFHT data are 6.4; MAD 3.7 km s-1 and 3.9; MAD 3.4 km s-1. The time-series data are unfortunately not intensive enough over a sufficiently extensive time-scale to allow for a confident search for periodic behaviour in the recorded radial velocities. With this caveat, Fourier power spectra were calculated independently for the CFHT and HARPS measurements and the results are shown in Fig. 7 (upper panel). There are undoubtedly spurious features and aliases throughout the power spectrum, but it is interesting to note that in both datasets the maximum power occurs at very similar frequencies i.e. 8.1 d-1.
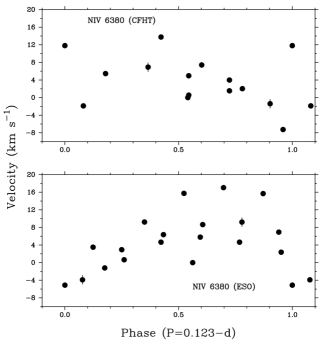
For a slightly more sophisticated treatment we also employed the CLEAN algorithm (Roberts et al. 1987) which is more suited to the temporal analysis of unequally spaced finite data samples. Using a gain of 0.5 and 100 iterations, the spectral window function was iteratively subtracted in the Fourier domain from the raw power spectrum shown in the upper panel in Fig. 7. The resultant ‘CLEANed’ power spectrum is shown in the bottom panel in Fig. 7, where the strongest peak frequency is at 8.13 d-1, for both datasets. We estimate an uncertainty of at least 10% in this frequency based on the half-width at half-maximum of the main peak in the window function. These results provide tentative evidence for a period of 0.123-day in the Niv radial velocity changes, with a semi-amplitude of 10 km s-1. Figure 8 shows the Niv central velocities phased on 0.123-day. (In each case phase 0 is arbitrarily set to the timing of the first observation.) The results in Fig. 8 suggest some coherency on the 0.123-day period independently for the ESO (2006) and CFHT (2010) datasets, though there is relatively larger scatter (in the very small velocity displacements) at some phases. Ultimately a more intensive, very high-resolution time-series dataset of the central star is needed to confirm the significance of this signal.
5 Discussion
We have provided evidence and demonstrated that in two independently secured optical spectroscopic time-series separated by 3 years, both datasets reveal for the central star of NGC 2392; (i) stochastic variations in the fast wind-formed recombination lines on timescales down to 30 min., (ii) changes in the overall morphology of the Hei and Heii line profiles that cannot be accounted for by 1-D line-synthesis predictions for a spherically homogeneous wind, (iii) radial velocity shifts of semi-amplitude 10 km s-1 in Niv 6380.8 (and tentatively in H) that show maximum Fourier power spectra signal at 0.123-d in ESO (2006) and CFHT (2010) data.
Our detection of radial velocity motion of the central star in NGC 2392 is obviously tentative. Cross-correlation with the majority of stellar absorption lines in the optical range is not fruitful since most of features are ‘contaminated’ by the imprints of stellar wind variability which we have established here. In advance of more definitive optical spectroscopy and photometry being secured, we can only speculate on the potential binary components in NGC 2392: For an assumed circular orbit and line-of-sight inclination (e.g. Garcia-Diaz et al. 2012); semi-amplitude of 10 km s-1 and period = 0.123-d (Figs. 8 and 9); assumed (primary) central star mass = 0.6 M⊙, the implied dynamical mass of the secondary in circular Keplerian orbit is 0.1 M⊙. Such a low-mass companion would for example correspond to a late M-dwarf of 2000 - 3000K.
5.1 Constraints from UV line profile morphologies
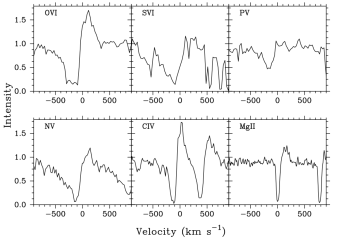
The morphologies of the FUV and UV lines are complex in NGC 2392 and provide additional signatures for an asymmetric geometry. The CMFGEN line-synthesis models (Sect. 3) do not provide consistent matches to Doppler widths, and absorption and emission strengths across all the UV ion stages observed in the fast wind. A selection of UV wind line profiles in NGC 2392 is presented in Fig. 9, ranging from Ovi 1031.9 and Svi 944.5, to Pv 1118.0 and Nv 1238.8, and Civ 1548.2 and Mgii 2795.5. (The data have been retrieved from the FUSE and IUE archives.) There are some key points to note in Fig 9: (i) All the wind lines get weaker with increasing outflow velocity. It may be that the wind plasma is shifting to a very high ionization state (beyond Ovi) as it travels to larger radii. Alternatively, the line shapes in Fig. 9 could be an indication that the fast wind of NGC 2392 is moving out of the line-of-sight, somewhat as may be expected for a polar, high-latitude wind in an asymmetric geometry; (ii) The low excitation Mgii line is very narrow ( 100 km s-1; as is Siiii 1206.5) and consistent with a low-velocity equatorial wind (see e.g. Bjorkman et al. 1994; Massa 1995); (iii) The presence of Pv most likely indicates that the wind is optically very thick, since phosphorous has a low cosmic abundance and this line would otherwise not be so clearly detected. However Civ and Nv are weak at intermediate velocities ( 200 to 300 km s-1). An optically very thick wind that causes weak absorption can arise in a scenario where the wind is not covering the entire stellar disk, as may be expected from a polar wind.
We conclude that UV lines provide evidence for an asymmetric, two-component outflow in NGC 2392, where high-speed high-ionization gas forms preferentially in the polar region. Slower, low ionization material is then confined primarily to a cooler equatorial component of the outflow.
Acknowledgments
Based on observations obtained at the Canada-France-Hawaii Telescope (CFHT) which is operated by the National Research Council of Canada, the Institut National des Sciences de l’Univers of the Centre National de la Recherche Scientique of France, and the University of Hawaii, and on observations collected at the European Southern Observatory, La Silla (programme ID ESO 076.D-0207(A). We thank Derck Massa for discussions about the fast wind of NGC 2392. We acknowledge the helpful comments of the referee.
References
- [1] Bjorkman, J,E., Ignance, R., Tripp, T.M., Cassinelli, J.P. 1994, ApJ, 435, 416
- [2] Danehkar, A., Frew, D.J., Parker, Q.A., De Marco, O. 2011, in Interacting Binaries to Exoplanets: Essential Modeling Tools, IAU Symp. 282, Eds. M. T. Richards and I. Hubeny, p. 470
- [3] Donati, J.-F., Semel, M., Carter, B.D., Rees, D.E., Collier Cameron, A. 1997, MNRAS, 291, 658
- [4] Fullerton, A.W., Gies, D.R., Bolton, C.T 1996, ApJS, 103, 475
- [5] Garcia-Diaz, M.T., López, J.A., Steffen, W., Richer, M.G. 2012, ApJ, 761, 172
- [6] Guerrero, M.A., De Marco, O. 2013, A&A, 553, 126
- [7] Guerrero, M.A. 2006, in Planetary Nebulae in our Galaxy and Beyond, Proceedings of the International Astronomical Union, Symposium 234. Eds. M.J. Barlow and R.H. Méndez, Cambridge University Press, 2006., p.153
- [8] Herald, J.E., Bianchi, L. 2011, MNRAS, 417, 2440
- [9] Hillier, D.J., Miller, D., 1998, ApJ, 496, 407
- [10] Hubeny, I., Lanz, T. 1995, ApJ, 439, 875
- [11] Kaschinski, C.B., Pauldrach, A.W. A., Hoffmann, T.L., 2012, A&A, 542, 45
- [12] Kastner, J.H., Montez, R., Balick, B. 2012, AJ, 144, 58
- [13] Manset, N., Donati, J.-F., 2003, in Polarimetry in Astronomy, Proceedings of the SPIE. Ed. S. Fineschi, 4843, p. 425
- [14] Massa, D.L. 1995, ApJ, 438, 376
- [15] Mayor, M. et al. 2003, The Messenger 114, 20
- [16] Méndez, R.H. 1991, in Evolution of Stars: the Photospheric Abundance Connection, IAU Symp. 145, eds. G. Michaud and A.V. Tutukov, Kluwer Academic Publishers, Dordrecht, p.375
- [17] Méndez, R.H., Urbaneja, M.A., Kudritzki, R.-P., Prinja, R.K. 2012, in Planetary Nebulae: An Eye to the Future, IAU Symp. 283, Eds. A. Manchado, L. Stanghellini and D. Schoenberner, Cambridge University Press, p. 436
- [18] De Marco, O., Bond, H.E., Harmer, D., Fleming, A.J. 2004, ApJ, 602, 93
- [19] Patriarchi, P., Perinotto, M. 1995, A&S, 110, 353
- [20] Prinja, R.K., Massa, D.L., Urbaneja, M.A., Kudritzki, R.-P. 2012a, MNRAS, 422, 3142
- [21] Prinja, R.K., Massa, D.L., Cantiello, M. 2012b, ApJ, 759, L28
- [22] Roberts, D.H., Lehár, J., Dreher, J.W. 1987, AJ, 93, 968