X-ray reflection in oxygen-rich accretion discs of ultra-compact X-ray binaries
Abstract
We present spectroscopic X-ray data of two candidate ultra-compact X-ray binaries: 4U 0614+091 and 4U 1543624. We confirm the presence of a broad O VIII Ly reflection line (at ) using XMM-Newton and Chandra observations obtained in 2012 and 2013. The donor star in these sources is carbon-oxygen or oxygen-neon-magnesium white dwarf. Hence, the accretion disc is enriched with oxygen which makes the O VIII Ly line particularly strong. We also confirm the presence of a strong absorption edge at Å so far interpreted in the literature as due to absorption by neutral neon in the circumstellar and interstellar medium. However, the abundance required to obtain a good fit to this edge is times solar, posing a problem for this interpretation. Furthermore, modeling the X-ray reflection off a carbon and oxygen enriched, hydrogen and helium poor disc with models assuming solar composition likely biases several of the best-fit parameters. In order to describe the X-ray reflection spectra self-consistently we modify the currently available xillver reflection model. We present initial grids that can be used to model X-ray reflection spectra in UCXBs with carbon-oxygen-rich (and hydrogen and helium poor) accretion disc. We find that the new reflection model provides a better overall description of the reflection spectra of 4U 0614+091 and 4U 1543624 than the reflection models that assume solar abundances. Besides a strong O VIII Ly line the new reflection model also shows a strong O VIII K-edge (at Å). We find that the absorption edge at Å present in the data can be described by a O VIII K-edge formed due to reflection in the accretion disc and a Ne I K-edge originating mostly (if not entirely) in the interstellar medium, mitigating the problem of the apparent very high neon abundance. Additionally, based on the spectral properties of 4U 1543624 we consider a scenario in which this source is accreting near the Eddington limit.
keywords:
X-rays: binaries accretion, accretion discs1 Introduction
X-ray reflection is a common phenomenon in accreting X-ray sources. X-rays originating from the neutron star (NS), in flares above an accretion disc or at the bottom of a jet irradiate the disc. Some of this X-ray radiation is then reflected off the disc leading to an X-ray continuum spectrum and emission lines formed in the fluorescent and recombination process. The shape of the reflected continuum spectrum is determined by photoelectric absorption which is dominant at lower energies, electron scattering which is dominant at higher energies, and the continuum emission from the reflecting material itself. If the reflection spectrum originates close to the compact object relativistic effects such as gravitational redshift and the relativistic Doppler effect broaden the reflection signatures in a characteristic way (Fabian et al., 1989). By modeling the relativistically broadened reflection spectra one can in principle infer the inner radius of the accretion disc. The signatures of X-ray reflection such as the relativistically broadened Fe K-shell emission line have been observed in the X-ray spectra of a number of accreting compact objects e.g. Active Galactic Nuclei (e.g. Tanaka et al., 1995) and X-ray binaries (Miller, 2007; Cackett
et al., 2009).
The most frequently used reflection models: reflionx (Ross &
Fabian, 2005) and xillver (García
& Kallman, 2010; García
et al., 2013) are best suited for spectra of AGN or X-ray binaries in the low (luminosity), hard (spectrum) state. These models assume a power-law incident spectrum and solar abundances in the accretion disc (with the sole exception of the Fe abundance which can vary). X-ray reflection in X-ray binaries in the high (luminosity), soft (spectrum) state was considered by Ross &
Fabian (2007). In this model the disc is no longer assumed to be cold like it is assumed in e.g. reflionx but its emission is described by a black body with a variable temperature. A chemical composition of the accretion disc that differs from solar has not yet been considered when calculating the reflection spectra (with the said exception of Fe). Given that there is a growing number of sources showing X-ray reflection signatures from a disc with non-solar composition, there is need for reflection models which would be able to describe these reflection features self-consistently.
In this study we consider two sources: 4U 0614+091 and 4U 1543624 that likely belong to the subclass of low-mass X-ray binaries (LMXBs) called ultra-compact X-ray binaries (UCXBs). UCXBs consist of a white dwarf donor star that transfers mass to a NS or a black hole (BH) accretor. They have an orbital period of min. The accretor in the case of 4U 0614+091 is a NS given the presence of type I X-ray bursts (Swank et al., 1978; Brandt et al., 1992). In the case of 4U 1543624 the nature of the accretor is uncertain (it could either be a NS or a BH). For the two sources studied in this paper tentative periods have been suggested: min for 4U 0614+091 (Shahbaz et al. 2008) and min for 4U 1543624 (Wang &
Chakrabarty, 2004). The optical spectra of both of these sources show emission lines of carbon and oxygen indicating that the donor star is either a carbon-oxygen (CO) or an oxygen-neon-magnesium (ONeMg) white dwarf (Nelemans et al., 2004). Furthermore, Madej et al. (2010) and Madej &
Jonker (2011) have discovered a relativistically broadened O VIII Ly reflection line in the X-ray spectra of these two sources.
The aim of this study is to investigate the potential changes in the properties of the reflected emission when considering CO-rich discs instead of disc material consisting of elements with solar abundances. The first sample of reflection models assuming CO-rich reflecting material are compared to archival as well as new observations of 4U 0614+091 and 4U 1543624 obtained using the XMM-Newton and Chandra satellites.
2 X-ray reflection models: adaptation to the spectra of UCXBs
| Parameter | Grid 1: 4U 0614+091 | Grid 2: 4U 1543-624 |
|---|---|---|
| [keV] | 300 | |
| [keV] | ||
| 100 |
In order to adapt the reflection models to the case of X-ray reflection in UCXB with CO-rich disc we start from the xillver code. This is a slightly modified version of xillver published by García
et al. (2013) designed to analyze the spectra of X-ray binaries in low/hard and high/soft states. The disc emission is included as a boundary condition at the bottom of the illuminated atmosphere. The parameters of this model include the flux of the power-law divided by the flux of the black body and the temperature of the black body representing the disc emission . The other parameters include the power-law index , the power-law cutoff energy , the abundance of C and O . Additionally, the incident power-law spectrum has a cutoff at the peak energy of the black body spectrum.
The optical spectra of 4U 0614+091 and 4U 1543624 indicate an overabundance of C and O in the disc (Nelemans et al., 2004). Therefore, the first modification we introduce is that we allow the abundance of C and O to vary in the new reflection models. In order to reduce the number of model calculations the abundance of C and O are assumed to be equal. The optical spectra of the analyzed sources also indicate a lack of hydrogen and helium (Nelemans et al., 2004). Therefore, in order to mimic this physical characteristic we increase the abundances of all the elements except He, C and O by a factor of ten with respect to the solar photospheric value of Lodders (2003). The hydrogen number density of the slab where the reflection occurs in the modified reflection models is . Given that the continuum spectrum in 4U 1543624 shows a rollover at the energy of a few keV (Schultz, 2003; Madej &
Jonker, 2011), we also consider a cutoff power-law incident spectrum in the reflection models where the cutoff energy is in the range keV. We further refer to the new xillver model as xillverCO.
It is not our goal to present detailed modeling of the X-ray reflection signatures in the spectra of the studied UCXBs using this new model. Such a detailed study would require exploring a larger parameter space and would be too time consuming at this point in time as those models do not exist yet. Instead, we calculate preliminary xillverCO grids that would provide some idea on the shape of the reflection spectrum in the regime of high abundances of elements heavier than He, in particular high abundance of C and O. Table 1 shows two xillverCO grids and the ranges of parameters we have calculated in order to describe the spectra of 4U 0614+091 and 4U 1543624. The parameter values for grid 1 and grid 2 have been chosen based on the spectral properties of 4U 0614+091 observed in 2001 (Madej et al., 2010) and 4U 1543624 observed in 2001 (Madej &
Jonker, 2011), respectively.
2.1 xillverCO
2.1.1 Two ionization regimes: low-ionization case and high-ionization case
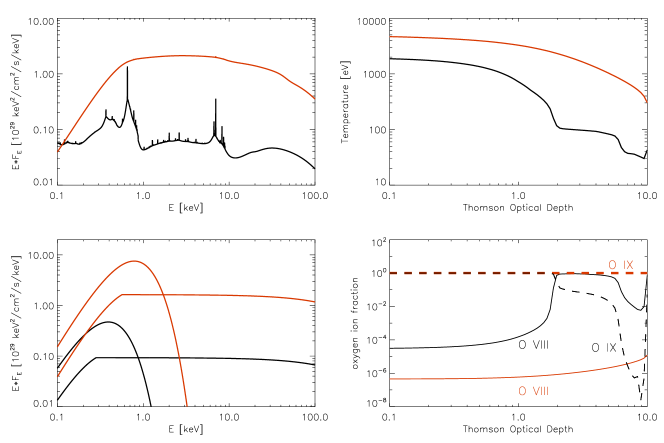
As an illustration of shape of the CO-rich reflection spectrum in the low-ionization and high-ionization regime we have plotted grid 1 for two different temperatures of the slab and two different illuminating power-law fluxes. In the first case the temperature of the black body representing the disc emission is keV and in the second case keV (see Fig. 1). The other input parameters are set at: , keV, , . Apart from the X-ray reflection spectra we also plot the temperature profiles and O ion fractions across the slab of the reflecting material. The position in the slab of reflecting material is defined in terms of the Thomson optical depth (, where is the Thomson cross section and is the electron number density). Case 1; the emerging spectrum is a combination of strong emission lines and a continuum that is significantly modified with respect to the incident power-law. The O VIII ions are dominant in and O becomes completely ionized in the outer layers for . Case 2; the entire slab of reflecting material is hotter (material much more ionized) than in Case 1 resulting in weaker emission lines and a continuum which starts resembling the incident power-law spectrum. Most of the O atoms appear to be completely ionized in the entire slab of the reflecting material, hence the emission lines of O are not visible in the reflection spectrum.
2.1.2 Abundance of C and O
We illustrate the influence of the overabundance of C and O with respect to the solar value on the shape of the X-ray reflection spectrum in the xillverCO model. Fig. 2 shows the grid 1 for the abundance of C and O with respect to the solar abundance. The remaining parameters of the model are: , keV, , keV. Note that as the increases the upper layers of the disc get hotter because of the increased opacity (bound-bound and bound-free). However, due to the increased continuum absorption, the transition to a colder regime occurs at a lower Thomson depth. The net effect in the spectrum with increased is a lower continuum, deeper edges and more intense emission features.
3 Observations and data reduction
3.1 4U 0614+091
4U 0614+091 was observed by the XMM-Newton satellite on 09/03/2013 and 09/09/2013 for ksec and ksec, respectively. During both observations the Reflection Grating Spectrometer (RGS) and the European Photon Imaging Cameras (EPIC): pn and the Metal Oxide Semi-conductor 2 (MOS2) were used. The EPIC-MOS1 camera was switched off. RGS was operated in the Spectroscopy mode with High Event Rate (HER) and Single Event Selection configuration (SES; only isolated pixels, without energy contained in the neighboring pixels, are selected for transmission) in order to reduce the instrument telemetry. The EPIC-pn and MOS2 cameras were operated in Timing mode.
Additionally, we use the XMM-Newton data of 4U 0614+091 obtained in 13/03/2001, previously analyzed by Madej et al. (2010), for comparison purposes. In this paper we refer to observations obtained in 13/03/2001, 09/03/2013 and 09/09/2013 as observation 1, 2 and 3, respectively.
We extract the XMM-Newton spectra using SAS version 13.0. The EPIC event files are extracted using the epproc command. We extract the EPIC-pn light curves in the keV range using evselect. The light curves reveal no signs of X-ray flares or a type I X-ray burst during these observations. The source and background spectra of EPIC-pn are also extracted using the evselect command, requiring the pixel pattern to be in the rawx range and , respectively. In these observations the EPIC-pn spectra have the best signal-to-noise ratio compared to the EPIC-MOS spectra. Additionally, we note that there are differences in calibration of the EPIC-MOS instruments operated in the imaging and timing mode (the EPIC-MOS in timing mode is not as well calibrated as imaging mode). Hence, for comparison purposes, we decide to use EPIC-pn instrument which was operated in the same mode (timing mode) in all of the analyzed observations. The EPIC-pn spectra are binned using the specgroup command in order to have at least 25 counts for each background-subtracted spectral channel and not to oversample the intrinsic energy resolution by a factor larger than 3. We note narrow instrumental features around keV in the EPIC-pn spectrum occurring due to a calibration inaccuracy in the energy scale when the EPIC-pn is operated in Timing mode. Hence, during the analysis we exclude the energy range keV. The RGS event files, source spectra, background spectra and instrument response matrices are extracted using the rgsproc command. The RGS spectra are binned with a factor of 2 which gives a bin size roughly of the full width half maximum (FWHM) of the spectral resolution of the first order RGS spectrum.
3.2 4U 1543624
4U 1543624 was observed by the Chandra satellite on: 05/06/2012 for ksec, 07/06/2012 for ksec. During the observation the Low Energy Transmission Grating Spectrometer (LETGS) was used to disperse the source light and the High Resolution Camera (HRC) was used to detect the dispersed light. We obtain the source spectra and response matrices from the Transmission Grating Catalog and Archive (tgcat, http://tgcat.mit.edu/). The LETGS spectra are binned with a factor of 2 (the resulting bin size corresponds to FWHM of the spectral resolution of LETGS). We use all the positive and negative spectral orders in the analysis.
We fit the XMM-Newton: RGS and EPIC-pn data of 4U 0614+091 using the xspec package (Arnaud, 1996) and the Chandra: LETGS data of 4U 1543624 using the isis package (http://space.mit.edu/cxc/isis). Errors on the fit parameters reported throughout this paper correspond to (corresponding to -single parameter).
| Parameter | Obs. 1 | Obs. 2 | Obs. 3 |
|---|---|---|---|
| continuum | |||
| [phot cm-2 s-1 keV-1] | |||
| [keV] | |||
| [] | |||
| [keV] | |||
| [] | |||
| rdblur*xillver | |||
| [GM/c2] | |||
| [deg] | |||
| [erg cm s-1] | |||
| <0.51 | |||
| d.o.f. | 2756/1711 | 2230/1713 | 2597/1713 |
| continuum | |||
| rdblur*xillverCO | |||
| [keV] | |||
| d.o.f. | 2330/1710 | 2008/1712 | 2199/1712 |
∗ parameter fixed during fitting.


4 Spectral results
4.1 4U 0614+091
4.1.1 Observation 1
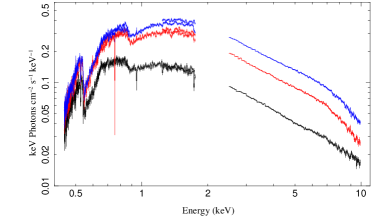
In order to describe the continuum spectrum of 4U 0614+091 in observation 1 we use an absorbed power-law model. The absorption by the neutral interstellar medium (ISM) and circumstellar medium (CSM) is modeled using tbnew model (Wilms in prep., 2011) with the Lodders (2003) (photospheric) set of abundances. A constant model is also added to the fit-model in order to account for possible uncertainties in the cross-calibration of the RGS and EPIC-pn instruments. The absorbed X-ray flux is erg cm-2 s-1 in the keV energy range. The unfolded RGS and EPIC-pn spectrum of the observation 1 is shown in Fig. 3.
We fit the RGS data in the energy range keV ( Å) and the EPIC-pn data in the energy range keV using an absorbed power-law model, excluding the energy range keV ( Å) and keV. Fig. 4, top panel part 1 shows the broad emission features present around keV (O VIII Ly line) and keV (Fe K-shell lines) after subtracting the best-fit continuum model.
We note that the value of the X-ray flux and the fact that the continuum spectrum is dominated by a power-law indicate that during observation 1 the source was in the low/hard (island) state.
4.1.1.1 Fit using the xillver model
We use the xillver model in order to describe the X-ray reflection signatures present around keV ( Å) and keV in observation 1 (see residuals in Fig. 4). Additionally, we use a convolution model rdblur which is commonly used to describe the relativistic effects close to a non-rotating compact object (BH/NS). The outer radius in the rdblur model is fixed to 1000 . The best-fit parameters are shown in Table 2. The best-fit ionization parameter is erg cm s-1, consistent with the value found by Madej et al. (2010). The best-fit parameters of the relativistic broadening , inclination and are also similar to the values found by Madej et al. (2010). We note, however, that the value of for 1711 d.o.f. for the fit using the relativistically broadened xillver model on the RGS and EPIC-pn data is higher than the value we obtain in the fit using a relativistically broadened reflionx model on the RGS and EPIC-MOS2 data. This discrepancy could be caused by the differences between the two reflection models and the better quality of the EPIC-pn (including the improved calibration of the instrument) with respect to the EPIC-MOS2 data analyzed in Madej et al. (2010). We note that there are clear residuals still remaining around the position of the O VIII Ly emission line. These residuals, although less prominent, were also seen in the fit using the reflionx model (Madej et al., 2010). Additionally, residuals are also present around keV (see Fig. 4). These residuals may well be due to the presence of broadened emission lines from reflection of elements like e.g. Ne, Si, S.
4.1.1.2 Fit using the xillverCO model
We replace the xillver model with the new xillverCO model and fit the RGS and EPIC-pn data. The fit improves with respect to the fit obtained using the xillver model from for 1711 d.o.f. to for 1710 d.o.f. (the best-fit parameters are in Table 2). The best-fit parameters of the relativistic broadening are similar to those found using the xillver model. The ionization parameter in this case can be estimated using the formula erg cm s-1 (where ) and appears to be much higher than the value obtained using the xillver model. It needs to be stressed, however, that the properties of the reflecting material itself have been changed in the xillverCO with respect to the xillver model by increasing the abundances of most of the elements and including the black body emission from the reflecting material. The best-fit abundance of C and O is with respect to the solar abundances indicating that a overabundance of O is indeed required in order to describe the O VIII Ly line at 19 Å. The abundance of Ne in the neutral absorption model decreases in the fit using xillverCO in comparison with the fit using the xillver model (see Table 2).
We note that a residual is still present around 19 Å (peak of the O VIII Ly line) in the fit using xillverCO model (see Fig. 4). This residual can be further reduced by increasing the value of in the rdblur model. Given that parameter is not well constrained we fix the value to (approximate position of the outer disc edge in 4U 0614+091, van Haaften et al., 2012). The fit improves from for 1710 d.o.f. to for 1710 d.o.f. (see Fig 4, panel 1a).
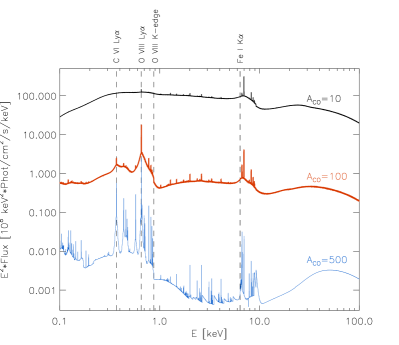
The best-fit xillver and xillverCO models are shown in Fig. 5. The strong emission lines of e.g. Ne, Si, S around keV present in the best-fit xillver model are much weaker in the xillverCO model. The residuals around keV obtained when fitting xillver model to the 4U 0614+091 are due to the presence of the strong emission lines in this reflection model which are not detected in the data.

4.1.2 Observation 2 and 3
We find that the continuum model for the X-ray spectrum of 4U 0614+091 which includes a disc black body, a power-law and a black body (Piraino et al., 1999; Migliari
et al., 2010) provides the best continuum description for observation 2 and 3. The disc black body represents the disc emission and the black body represents the emission from the boundary layer where the accretion flow meets the NS. The absorbed X-ray flux in observation 2 and 3 has increased with respect to that of observation 1 to erg cm-2 s-1 and erg cm-2 s-1 ( keV), respectively. The unfolded RGS and EPIC-pn spectra of observation 2 and 3 are shown in Fig. 3. The value of the X-ray flux in observation 2 and 3 together with the properties of the spectrum: the presence of a significant disc and boundary layer emission component, indicate that during observation 2 and 3 the source was close to or already in the high/soft (banana) state.
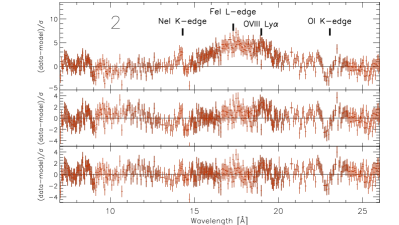
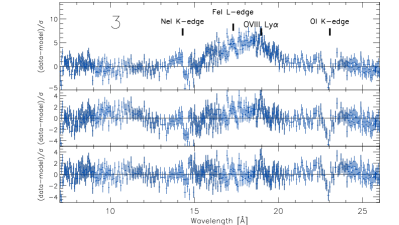
We fit the RGS data in the energy range keV and the EPIC-pn data in the energy range keV using the continuum model excluding the energy range keV ( Å) and keV (see Fig. 4). We confirm the presence of the broad O VIII Ly line in observation 2 and 3 detected before in observation 1 (Madej et al., 2010). Additionally, the residual around keV in observation 2 and 3 could also indicate the presence of broad Fe K-shell lines.
4.1.2.1 Fit using the xillver model
We use the rdblur*xillver model in order to describe the relativistically broadened X-ray reflection signatures present in observation 2 and 3. Similar to observation 1 the residuals are present around keV which could be caused by the presence of reflection lines in the xillver model that are not present in the data. While fitting the observation 2 we have noticed a tendency for the flux of the reflection spectrum to become significantly higher than the flux of the power-law. We have obtained the best-fit for 1712 d.o.f with a negligible value of the power-law normalization and the best-fit erg cm s-1, indicating a significantly higher ionization of the disc than measured in observation 1 and 3. It is possible to obscure part of the incident power-law making the reflected component more prominent. However, we find it unlikely that the incident power-law spectrum would be obscured almost completely. Therefore, during the fit we fix the power-law normalization in order to keep the power-law to reflection flux ratio .
The fit also shows a prominent residual around keV in observation 3 (see Fig. 4). It is possible that the X-rays emitted by the boundary layer get reflected off the accretion disc as well and contribute to the emission line around keV and keV.
4.1.2.2 Reflection from the boundary layer ?
We investigate whether the addition of the reflection component from the boundary layer could improve the fit in observation 3. For this purpose we use the bbreflvaryFe model (Ballantyne, 2004) which gives the reflection spectrum assuming the black body incident spectrum. The abundance of C and O in this model is assumed to be solar but the Fe abundance is variable. We find that the addition of the bbreflvaryFe model improves the fit ( for 3 additional parameters) in observation 3 and the residual around keV is significantly reduced. However, the reflection component from the boundary layer appears to have higher flux by a factor of (measured over the keV energy range) than the incident black body spectrum. Furthermore, the contribution from the reflection component assuming the power-law incident spectrum decreases making the reflection component assuming the black body incident spectrum a major contribution to the description of the reflection features around keV and keV. Similarly to the case of the fit in observation 2 it is possible though contrived to obscure part of the emission from the boundary layer making the reflected component more prominent than the incident black body spectrum. Therefore, we conclude that although the addition of the reflection component from the boundary layer improves the fit, it appears unlikely that such a large fraction of the incident spectrum is obscured from view.
4.1.2.3 Fit using the xillverCO model
We replace the xillver and bbreflvaryFe model with the new xillverCO model. The fits to observation 2 and 3 improve with respect to the fits obtained using the xillver model (see Table 2). The measured abundance of C and O is around a few hundred times the solar value. The temperature of the black body component in the reflection model has increased for observation 2 and 3 with respect to the value obtained for observation 1. This tendency for the temperature of the disc to increase is expected when the source is moving from the low/hard (island) to the high/soft (banana) state. We stress, however, that the black body temperature in the reflection model is inconsistent with the disc temperature in the disc black body model. It is possible that the region of the accretion disc where the reflection occurs has a different temperature than the one estimated by the disc black body model. On the other hand we note that the calculated grids have a limited number of points and assume a fixed single-temperature black body model in order to describe the disc emission. Furthermore, we note that lack of a xillverCO grid which assumes a black body incident spectrum prevents us from testing for the presence of reflection component from the boundary layer assuming O-rich reflection material.
4.2 4U 1543624
Madej &
Jonker (2011) have found that the continuum spectrum in the XMM-Newton data of 4U 1543624 can be described by the combination of a disc black body with keV and power-law with a break around 6 keV. Schultz (2003) has also shown that the BeppoSAX and ASCA spectra of 4U 1543624 can be described using a Comptonization model with a high optical depth and a black body (representing boundary layer emission) with keV. These characteristics of the spectrum of 4U 1543624 appear unusual for typical LMXBs, however, similar to the characteristics of spectra of ultra-luminous X-ray sources (ULXs) when observed in the ultraluminous state (Gladstone
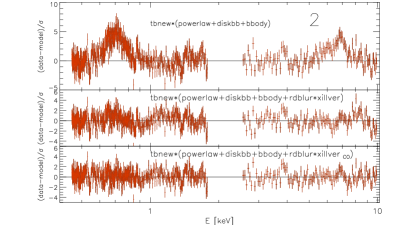
et al., 2009). The disc black body spectrum with a temperature of keV in the spectrum of a ULX in the ultraluminous state is interpreted as a cool disc and the cutoff power-law (or Comptonization model with a high optical depth) is interpreted as an optically thick corona. Therefore, we adopt two continuum models: tbnew*(cutoffpl+diskbb) which we call Model 1 and tbnew*(cutoffpl+diskbb+bbody) which we call Model 2 (a constant function is also included in the fit-model).
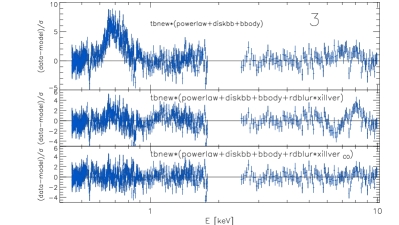
First, we fit the data in the wavelength range Å ( keV) using Model 1 excluding the wavelength range Å (see Fig. 6, panel a1). The emission feature around 18 Å resembles the feature found by Madej &
Jonker (2011) in the XMM-Newton data of 4U 1543624 and interpreted as a relativistically broadened O VIII Ly reflection line. Additionally, looking at the spectrum between Å we find no clear evidence of the presence of a C VI Ly line (at Å, see Fig. 6, panel b). We note that the narrow features near Å and Å (Fig. 6, panel a1) are caused by uncertainties in the instrumental calibration near Al, Cs and I absorption edges.
Given that there are no xillver models with an incident power-law that has a cutoff at the energy between keV as yet, we cannot compare our results to such a model. Instead we include our custom made reflection component xillverCO (grid 2, see Table 1) in the fit model. Additionally, we use the convolution model kdblur which is commonly used to describe the relativistic effects close to a rotating BH for Model 1 given that Model 1 is constructed based on the spectral characteristics of a typical ULX with a BH compact object. We choose the rdblur model in Model 2 since Model 2 is constructed based on the spectral characteristics of a typical UCXB with a NS compact object. The best-fit parameters are given in Table 3.


| Model 1 | Model 2 | |
| Parameter | continuum | continuum |
| [keV] | ||
| [phot cm-2 s-1 keV-1] | ||
| [keV] | ||
| [] | ||
| [keV] | ||
| [] | ||
| kdblur*xillverCO | rdblur*xillverCO | |
| [GM/c2] | ||
| [deg] | ||
| [keV] | ||
| d.o.f. | 5500/4523 | 5347/4521 |
∗ parameter fixed during fitting
4.3 Ne I K-edge or O VIII K-edge ?
We find that the fit using the relativistically broadened xillver to the data of 4U 0614+091 and 4U 1543624 requires an overabundance of neutral Ne in order to describe a strong absorption edge around 14 Å present in the data. The Ne I K-edge originating partly in the ISM and partly in CSM has already been suggested by Juett
et al. (2001) in the data of both sources and confirmed by e.g. Madej et al. (2010), Madej &
Jonker (2011) and Schulz et al. (2010). However, we have found (see Sec 4.1 and 4.2) that the fit to the data of 4U 0614+091 and 4U 1543624 using the fit model which includes the new xillverCO model is causing the abundance of Ne in the tbnew model to decrease compared to the fit using only the continuum model. The position of the Ne I K-edge ( Å) is close to the position of the O VIII K-edge ( Å keV) and looking at the best-fit xillverCO models obtained when fitting the data of 4U 0614+091 and 4U 1543624 the O VIII K-edge is evidently present together with the O VIII Ly emission line (see Fig. 5). It is important to note, however, that the relativistic broadening included in the fit model can smear the O VIII K-edge significantly as is the case in the fit to the RGS and EPIC-pn data and hence fails to fully describe the sharp edge around 14 Å present in the data.
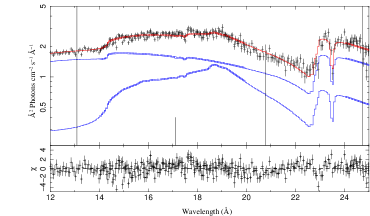
We investigate whether the xillverCO reflection model would be able to provide a self-consistent description of the O VIII Ly line and the O VIII K-edge without the need of an overabundance of neutral Ne in 4U 0614+091. We fit the tbnew*(powerlaw+rdblur*xillverCO) model to the RGS data of observation 1 only in the wavelength range Å ( keV). We find the best-fit with for 1289 d.o.f. and the parameters of the fit: (for cm-2), , , , , keV, . The best-fit is shown in Fig. 7. The abundance of Ne decreases further with respect to the fit obtained using RGS and EPIC-pn data, however, it is still not consistent with the solar value. Furthermore, we note, that the abundance of Fe in this fit is . The tbnew model uses solid-state cross-section measurements for Fe (Kortright &
Kim, 2000). However, due to the complexity of the Fe L-shell absorption (see e.g. Lee et al., 2009), it is difficult to constrain the abundance of Fe using the tbnew model only.
5 Discussion
We have taken the first steps to adapt the xillver model (García
& Kallman, 2010; García
et al., 2013) to the case of reflection in UCXBs with CO-rich accretion discs. We have increased the abundances of all the elements except He and allow the abundance of C and O to vary during the fit. Additionally, we have considered a cutoff power-law incident spectrum with a cutoff energy in the range keV. As expected, the new reflection model (xillverCO) shows stronger C and O emission lines. On the other hand the strength of the other emission lines e.g. Ne, Si, S, Fe is decreased. In contrast to the xillver model which assumes the reflecting material to be cold, the reflecting material in the new xillverCO model has a higher temperature which provides a better physical description of the gas in the accretion disc in X-ray binaries.
We have tested the modified reflection model xillverCO using archival and new XMM-Newton spectra of 4U 0614+091 and Chandra spectra of 4U 1543624. In the case of 4U 0614+091 we find that the new reflection model can describe the reflection signatures in the spectra and it indicates an overabundance of C and O of with respect to the solar photospheric value of Lodders (2003). We note, however, that the current xillverCO model is preliminary as it has a limited number of grid points. We have found that some of the parameters of this model e.g. , , settle on the upper or lower limit values in the current grid which suggests that more grid points will need to be calculated before robust conclusions about the various parameter values can be drawn. Additionally, given that there are no significant C emission lines visible in the RGS and LETGS spectra of the studied sources, it is difficult to establish whether the overabundance of C is also required in order to describe the reflection spectra. We note that the xillverCO model absorbed by the ISM also does not show significant C emission lines for the best-fit abundance. Hence, it is possible that the C emission is not strong enough if the C is overabundant.
Considering the parameters of the relativistic broadening obtained when fitting the xillverCO model to observations 1, 2 and 3 of 4U 0614+091, we find that the value of the inner radius of the accretion disc is close to the innermost stable circular orbit (ISCO) in both low/hard and high/soft states. This result contradicts the standard accretion disc model (Esin
et al., 1997) in which the accretion disc is truncated further from the ISCO in the low/hard state. It needs to be mentioned, however, that it is possible that the properties of the reflecting material assumed in the xillverCO (e.g. the abundances of elements or ionization structure of the disc) still deviate from the properties of the accretion disc in the UCXB 4U 0614+091 which prevent us from obtaining a self-consistent description of the data. Additionally, as mentioned above the caveat about the incomplete grid applies here as well.
5.1 Ne I K-edge/O VIII K-edge and O VIII Ly line
We confirm the presence of a strong absorption edge at Å in the XMM-Newton spectra of 4U 0614+091 obtained in 2013 and LETGS spectra of 4U 1543624 obtained in 2012 found before by Juett et al. (2001), Madej et al. (2010), Madej & Jonker (2011), Schulz et al. (2010). Our results suggest that the absorption edge at Å can be partly described by the Ne I K-edge present in the neutral absorption model and partly by the O VIII K-edge present in the xillverCO model. The possible presence of an O VIII K-edge or radiative recombination continuum (RRC) in the X-ray spectra of 4U 0614+091 has been suggested before by Schulz et al. (2010). We find that the abundance of Ne decreases when the xillverCO model is used. The best-fit parameters suggest, however, that the overabundance of Ne with respect to the solar photospheric value of Lodders (2003) is still required. It is important to stress that the value of the Ne abundance can be uncertain, given the difficulty in measuring the abundance of this element in the Sun. We measure with respect to the solar photospheric value of Lodders (2003) when fitting the RGS data (see Sec. 4.3.1). However, the solar photospheric abundance of Ne in Lodders (2003) is for example lower by a factor of and with respect to the solar abundance of Ne in Anders & Grevesse (1989) and Anders & Ebihara (1982), respectively. Hence, it is possible that the measured is much closer to (or even consistent with) the abundance of Ne in the ISM. Additionally, we note that part of the Ne in ISM is thought to be in the ionized form (e.g. Ne II, Ne III, see Juett et al., 2006) which is currently not taken into account in the tbnew model. As a result the measurement of the neutral Ne abundance could be affected to some degree.
5.2 4U 1543624: UCXB accreting near
the Eddington limit ?
We have found that the combination of a cutoff power-law with a cutoff energy of keV and a black body with a temperature of keV can describe the LETGS data of 4U 1543624. These characteristics of the spectrum of 4U 1543624 appear similar to the characteristics of spectra of ultra-luminous X-ray sources when observed in the ultraluminous state (Gladstone
et al., 2009). Accretion near the Eddington limit can happen in UCXBs when the system comes into contact (van Haaften et al., 2012). Theory predicts that this stage happens in BH or NS UCXB for orbital periods of around min depending on the type of the accretor and the influence of the thermal pressure on the donor star radius (Lennart van Haaften, private communication). This limit on the orbital period is around half of the period observed so far in the lightcurve of 4U 1543624 (, Wang &
Chakrabarty, 2004). The unabsorbed flux of the UCXB 4U 1543624 measured using the LETGS spectra is ( keV energy range). Assuming that this source is accreting near the Eddington limit , we estimate the distance to the source to be . Given the source Galactic coordinates () and the estimated distance, 4U 1543624 could be in the outskirts of the Galaxy and possibly belong to a halo population of LMXBs, implying that this source was kicked out of our Galaxy at formation.
We note that if 4U 1543624 is indeed accreting near the Eddington limit, the parameter measured using the relativistically broadened reflection model might not represent the true inner radius of the accretion disc. An optically thick corona present above the inner part of the accretion disc can modify the reflection spectrum (through absorption and multiple scattering events) in a way that will destroy the characteristic, inner-disc signatures.
5.3 Assumptions in the reflection models & Future prospects
We have taken the first steps into describing the X-ray reflection spectra of UCXBs with CO-rich disc. However, apart from the issues already mentioned before in this section such as the limited number of grid points in the new model there are still questions remaining on the details of the X-ray reflection process and accretion disc physics in UCXBs. Those questions will need to be addressed before we are able to provide robust constraints on e.g. the geometry of the accretion disc or the abundances of elements in the accretion disc using X-ray reflection signatures.
For example, we have no robust observational constraints on the hydrogen number density in the inner regions of the accretion discs in UCXBs. Therefore, we have assumed in this analysis a hydrogen number density of cm-3. However, the ionization state of the reflecting material and hence the shape of the reflection spectrum depends on this parameter. Given the quality of the current data, introducing the density as a free parameters would probably reveal many degenerate solutions for the same dataset. However, future missions e.g. Astro-H, Athena+ with higher spectral resolution and effective area than XMM-Newton and Chandra will reveal more details of the X-ray reflection signatures observed in the spectra and potentially be able to constrain the density of the reflecting material along with the currently considered parameters.
Another concern is the underabundance of H in the accretion disc of UCXBs. In our analysis we mimic the underabundance of H by increasing the abundance of all the other elements. Given the uncertainly on the exact abundance of H in UCXBs and the capabilities of the currently available reflection models we fixed the abundance of all the elements except He, C and O at ten times the solar value. However, future reflection models should be able to provide reflection spectra for the abundances of H even lower with respect to the other elements than currently assumed.
References
- Anders & Ebihara (1982) Anders E., Ebihara M., 1982, Geoch.Cosm.Act., 46, 2363
- Anders & Grevesse (1989) Anders E., Grevesse N., 1989, Geoch.Cosm.Act., 53, 197
- Arnaud (1996) Arnaud K. A., 1996, in Jacoby G. H., Barnes J., eds, Astronomical Data Analysis Software and Systems V Vol. 101 of Astronomical Society of the Pacific Conference Series, XSPEC: The First Ten Years. p. 17
- Ballantyne (2004) Ballantyne D. R., 2004, MNRAS, 351, 57
- Brandt et al. (1992) Brandt S., Castro-Tirado A. J., Lund N., Dremin V., Lapshov I., Syunyaev R., 1992, A&A, 262, L15
- Cackett et al. (2009) Cackett E. M., et al. 2009, ApJ, 690, 1847
- Esin et al. (1997) Esin A. A., McClintock J. E., Narayan R., 1997, ApJ, 489, 865
- Fabian et al. (1989) Fabian A. C., Rees M. J., Stella L., White N. E., 1989, MNRAS, 238, 729
- García et al. (2013) García J., Dauser T., Reynolds C. S., Kallman T. R., McClintock J. E., Wilms J., Eikmann W., 2013, ApJ, 768, 146
- García & Kallman (2010) García J., Kallman T. R., 2010, ApJ, 718, 695
- Gladstone et al. (2009) Gladstone J. C., Roberts T. P., Done C., 2009, MNRAS, 397, 1836
- Juett et al. (2001) Juett A. M., Psaltis D., Chakrabarty D., 2001, ApJ, 560, L59
- Juett & Chakrabarty (2003) Juett, A. M. and Chakrabarty, D., 2003, ApJ, 599, 498
- Juett et al. (2006) Juett A. M., Schulz N. S., Chakrabarty D., Gorczyca T. W., 2006, ApJ, 648, 1066
- Kortright & Kim (2000) Kortright J. B., Kim S.-K., 2000, Phys.Rev.B, 62, 12216
- Lee et al. (2009) Lee J. C., Xiang J., Ravel B., Kortright J., Flanagan K., 2009, ApJ, 702, 970
- Lodders (2003) Lodders K., 2003, ApJ, 591, 1220
- Madej & Jonker (2011) Madej O. K., Jonker P. G., 2011, MNRAS, 412, L11
- Madej et al. (2010) Madej O. K., Jonker P. G., Fabian A. C., Pinto C., Verbunt F., de Plaa J., 2010, MNRAS, 407, L11
- Migliari et al. (2010) Migliari S., Tomsick J. A., Miller-Jones J. C. A., Heinz S., Hynes R. I., Fender R. P., Gallo E., Jonker P. G., Maccarone T. J., 2010, ApJ, 710, 117
- Miller (2007) Miller J. M., 2007, ARAA, 45, 441
- Nelemans et al. (2004) Nelemans G., Jonker P. G., Marsh T. R., van der Klis M., 2004, MNRAS, 348, L7
- Pinto et al. (2010) Pinto C., Kaastra J. S., Costantini E., Verbunt F., 2010, A&A, 521, A79+
- Piraino et al. (1999) Piraino S., Santangelo A., Ford E. C., Kaaret P., 1999, A&A, 349, L77
- Ross & Fabian (2005) Ross R. R., Fabian A. C., 2005, MNRAS, 358, 211
- Ross & Fabian (2007) Ross R. R., Fabian A. C., 2007, MNRAS, 381, 1697
- Schultz (2003) Schultz J., 2003, A&A, 397, 249
- Schulz et al. (2010) Schulz N. S., Nowak M. A., Chakrabarty D., Canizares C. R., 2010, ApJ, 725, 2417
- Swank et al. (1978) Swank J. H., Boldt E. A., Holt S. S., Serlemitsos P. J., Becker R. H., 1978, MNRAS, 182, 349
- Tanaka et al. (1995) Tanaka Y., Nandra K., Fabian A. C., Inoue H., Otani C., Dotani T., Hayashida K., Iwasawa K., Kii T., Kunieda H., Makino F., Matsuoka M., 1995, Nature, 375, 659
- van Haaften et al. (2012) van Haaften L. M., Nelemans G., Voss R., Wood M. A., Kuijpers J., 2012, A&A, 537, A104
- Wang & Chakrabarty (2004) Wang Z., Chakrabarty D., 2004, ApJ, 616, L139
- Wilms in prep. (2011) Wilms J., Juett A. M., Schulz S. S, Nowak M. A., 2011, http://pulsar.sternwarte.uni-erlangen.de/wilms/research/tbabs/
6 Acknowledgements
OKM thanks John Raymond and Ciro Pinto for useful discussions and comments on the paper.