FUSION14
Mapping from quasi-elastic scattering to fusion reactions
Abstract
The fusion barrier distribution has provided a nice representation for the channel coupling effects on heavy-ion fusion reactions at energies around the Coulomb barrier. Here we discuss how one can extract the same representation using the so called sum-of-differences (SOD) method with quasi-elastic scattering cross sections. In contrast to the conventional quasi-elastic barrier distribution, the SOD barrier distribution has an advantage in that it can be applied both to non-symmetric and symmetric systems. It is also the case that the correspondence to the fusion barrier distribution is much better than the quasi-elastic barrier distribution. We demonstrate its usefulness by studying 16O+144Sm, 58Ni+58Ni, and 12C+12C systems.
1 Introduction
The fusion barrier distribution RSS91 has by now been a standard representation for heavy-ion fusion cross sections at energies around the Coulomb barrier DHRS98 ; LDH95 ; BT98 ; HT12 . It can directly be obtained from measured fusion cross sections as , that is, by taking the second derivative of with respect to , where is the incident energy in the center of mass frame RSS91 . The fusion barrier distribution has been experimentally extracted for a number of systems. These experimental data have indicated that the fusion barrier distribution is sensitive to the channel coupling effects and it thus provides a powerful method to study the energy dependence of fusion cross sections at subbarrier energies DHRS98 ; LDH95 .
A similar barrier distribution has been proposed also for quasi-elastic scattering cross sections TDH94 , that is, a sum of elastic, inelastic, and transfer cross sections. The quasi-elastic barrier distribution is defined as the first derivative of the ratio of the quasi-elastic cross section to the Rutherford cross section , that is, , in which both and are evaluated at the scattering angle of . It has been demonstrated both experimentally and theoretically that the quasielastic barrier distribution behaves similarly to the fusion barrier distribution TDH94 ; HR04 .
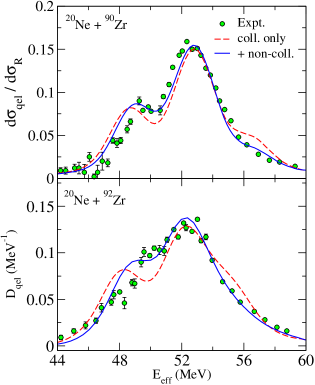
As an example of recent applications of the quasi-elastic barrier distribution, Fig. 1 shows a comparison between the quasi-elastic barrier distribution for the 20Ne + 90Zr system and that for the 20Ne + 92Zr systems YHR13 . One striking thing is that the experimental quasi-elastic barrier distribution for the 20Ne + 92Zr system is much more smeared than that for the 20Ne + 90Zr system Piasecki . The dashed lines in the figure show the results of the coupled-channels calculations that include the rotational excitations in 20Ne as well as the collective phonon excitations in 90,92Zr. This calculation reproduces the experimental data for the 20Ne + 90Zr system but not for the 20Ne + 92Zr system. The solid lines, on the other hand, take into account also the non-collective excitations in 90,92Zr with a random matrix model. One can see that the smearing of quasi-elastic barrier distribution for the 20Ne + 92Zr system is now well reproduced by the non-collective excitations of the 92Zr nucleus, whose level density is much larger than that of 90Zr due to the two extra neutrons outside the shell closure.
2 The sum-of-differences method
While a similar barrier distribution can be obtained both from fusion and from quasi-elastic cross sections, the quasi-elastic barrier distribution has several experimental advantages over the fusion barrier distribution, such as the fact that less accuracy is required in the data for taking the first derivative rather than the second derivative HR04 . However, at the same time, it also has two drawbacks. Firstly, the quasi-elastic barrier distribution is somewhat smeared and thus less sensitive to the nuclear structure effect compared to the fusion barrier distribution. This is due to the effect of nuclear distortion of a classical trajectory HR04 , which is not taken into account in the definition of quasi-elastic barrier distribution. This sometimes leads to a large difference between the fusion and the quasi-elastic barrier distributions, a well known example being the 16O+144Sm system TDH94 ; ZH08 . Secondly, the quasi-elastic barrier distribution cannot be applied to symmetric systems, because the quasi-elastic cross sections diverge at due to the (anti-)symmetrization effect.
In order to avoid these drawbacks, we here propose to use the so called sum-of-differences (SOD) method. This method was proposed many years ago by Holdeman and Thaler HT65 , who argued that the reaction cross section is obtained from the elastic cross section as,
| (1) |
where is an angle such that the difference between the elastic and the Rutherford cross sections is negligibly small for . See also Refs. M83 ; Hussein ; BA85 ; L87 ; WMD77 ; OHHS79 ; Yamaya . Since the reaction cross section is given by , where and are inelastic and transfer cross sections, respectively, Eq. (1) can be transformed also to HR14
| (2) |
where the quasi-elastic cross section is given by . We define the SOD barrier distribution, , as the fusion barrier distribution with fusion cross sections so obtained.
3 SOD barrier distributions
3.1 Non-symmetric systems
Let us now examine the performance of the SOD barrier distribution. We first consider the 16O+144Sm system as an example for non-symmetric systems. We take into account the one phonon couplings with the quadrupole and octupole phonons in 144Sm while 16O is assumed to be inert. The coupled-channels equations are solved with a version of the computer code CCFULL HRK99 . We use an imaginary potential with the Woods-Saxon form for the internuclear potential, whose imaginary part is well confined inside the Coulomb barrier.
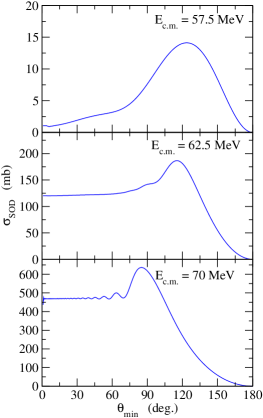
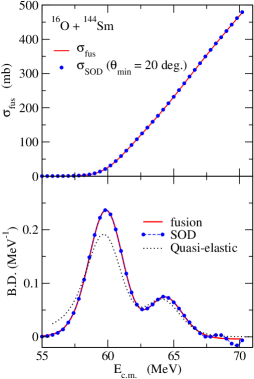
Figure 2 shows the fusion cross sections obtained with Eq. (2) at three different incident energies as a function of the minimum angle, . One can see that the fusion cross section is insensitive to the choice of , as long as it is smaller than about 40 degrees. The dots in the upper panel of Fig. 3 shows the fusion excitation function evaluated with . For a comparison, the solid line shows the exact fusion cross sections directly obtained with the coupled-channels calculations. The fusion cross sections obtained with the SOD method are almost indistinguishable from the exact fusion cross sections in the scale shown in the figure.
The lower panel of Fig. 3 shows the fusion barrier distributions obtained by taking the second derivative of the fusion cross sections shown in the upper panel. We normalize the exact fusion barrier distribution between 55 70 MeV and multiply the same normalization factor to the SOD barrier distribution. One can see that the SOD barrier distribution well reproduces the exact fusion barrier distribution, except for the high energy region. The deviation in this energy region is due to the finite value of , as one can infer from the small oscillations shown in the bottom panel of Fig. 2. In fact, if one takes a larger value of , e.g., , the deviation becomes even larger although the main structure of fusion barrier distribution is still reproduced.
For a comparison, Fig. 3 also shows the corresponding quasi-elastic barrier distribution by the dotted line. While the SOD barrier distribution reproduces the exact fusion barrier distribution almost perfectly, the quasi-elastic barrier distribution does not coincide with the fusion barrier distribution, although the main structure is qualitatively reproduced. The main peak is somewhat lowered and the peak position is slightly shifted towards a lower energy. At the same time, the peaks have a larger tail on the low energy side. These features can be attributed to the nuclear distortion effect, as has been demonstrated in Fig. 1 in Ref. HR04 . Evidently, the SOD barrier distribution has a much better correspondence to the fusion barrier distribution as compared with the quasi-elastic barrier distribution.
Of course, at energies well below the Coulomb barrier, the SOD cross sections are difficult to obtain, both theoretically and experimentally, since the quasi-elastic and the Rutherford cross sections are almost the same. Fortunately, this energy region does not contribute to the structure of fusion barrier distribution, as shown in the lower panel of Fig. 3.
3.2 Symmetric systems
Let us next discuss symmetric systems. For such systems, the elastic cross section is given by
| (4) |
where is the scattering amplitude for elastic scattering and the sign on the right hand side of this equation depends on whether the spatial part of wave function is symmetric (+) or anti-symmetric () with respect to the exchange between the projectile and the target. Apparently this cross section diverges at , as the Rutherford cross section diverges at . For symmetric systems, this prevents the use of the quasi-elastic barrier distribution, which is defined at . Even in that situation, however, one can still map quasi-elastic cross sections to fusion cross sections by using the SOD method given by Eq. (3).
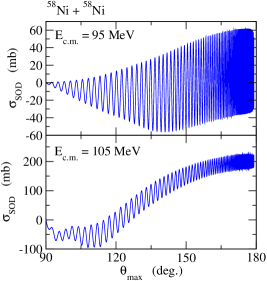
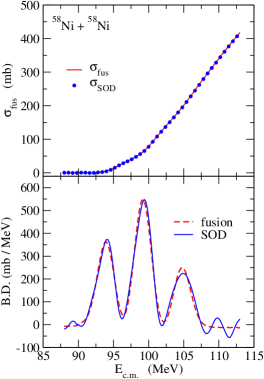
In order to demonstrate the performance of the SOD barrier distribution for symmetric systems, we consider the 58Ni + 58Ni system. We include the one quadrupole phonon excitations at 1.45 MeV in the projectile and the target nuclei as well as the mutual excitation channel. Fig. 4 shows the fusion cross sections obtained with Eq. (3) as a function of at two different incident energies. In contrast to the non-symmetric system shown in Fig. 2, the SOD cross sections oscillates rapidly as a function of . This of course is due to the oscillatory nature of the Mott scattering HAT07 , which is caused by the interference between the forward and the backward amplitudes, that is, and , respectively.
Since it is meaningless to evaluate the SOD cross sections at a fixed value of , due partly to a finite angle resolution in actual experiments, we obtain fusion cross sections for this system by averaging the SOD cross sections within a small range of . The dots in the upper panel of Fig. 5 are so obtained by averaging an upper integration limit between 176.5∘ and 179.5∘. Again, these reproduce almost perfectly the exact fusion cross sections shown by the solid line. The lower panel of Fig. 5 shows the corresponding fusion barrier distributions. Although the agreement is slightly worse than that for the non-symmetric system shown in Fig. 3, one can still see that the SOD barrier distribution well reproduces the exact fusion barrier distribution.
4 Fusion oscillations in light symmetric systems
An interesting application of the SOD method may be to light symmetric systems, such as 12C+12C and 16O+16O. Fig. 6 shows the experimental fusion cross sections for the 12C+12C system. See Fig. 1 in Ref. SKUO13 for a similar figure for the 16O+16O system. One can see a large scatter in the experimental data. This is partly due to systematic errors in the experiments and partly due to missing evaporation channels. That is, some of these experimental data were obtained by measuring -rays from evaporation residues, where it may be hard to detect all the evaporation channels. The SOD method provides a good alternative way to experimentally determine fusion cross sections, as a detection of quasi-elastic cross sections is presumably much simpler than a direct detection of evaporation residues, although measurements at many scattering angles may be time consuming.
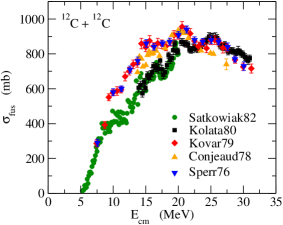
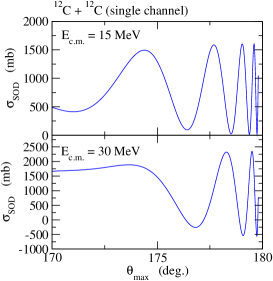
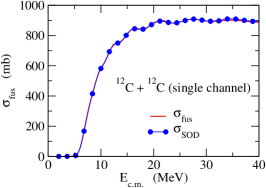
Figure 7 shows the SOD cross sections for the 12C+12C system obtained with Eq. (3) as a function of . To this end, we carry out single-channel calculations with an exponential potential with the diffuseness parameter of =0.8 fm and the depth parameter of MeV. Since the Sommerfeld parameter is smaller, the SOD cross sections are much less oscillatory for this system as compared to the 58Ni+58Ni system shown in Fig. 4. We then obtain the fusion cross sections by averaging the maximum and minimum in the SOD cross section close to . The fusion cross sections so obtained are shown in Fig. 8 by the dots. As for the 58Ni+58Ni system shown in Fig. 5, these calculations well reproduce the exact fusion cross sections, including the oscillatory character.
The fusion oscillations observed in light symmetric systems can be interpreted as due to the addition of successive individual partial waves as the energy increases PRL83 ; KKR83 (see also Refs.SKUO13 ; E12 ; W12 ). This effect is enhanced in systems with identical spin-zero bosons. In such systems, only even-partial waves contribute, increasing the energy spacing between successive contributing angular momenta. Within the parabolic approximation, one can derive the oscillatory part of fusion cross sections as PRL83 ; HT12
| (5) |
where the positive (negative) sign corresponds to the spatially symmetric (asymmetric) case with respect to the exchange of the projectile and the target nuclei. In this equation, and are the barrier position and the curvature of the Coulomb barrier, respectively, is the reduced mass of the system, and is the grazing angular momentum. The oscillatory part of fusion cross sections, , is to be added to the smooth part of fusion cross sections given by the well-known Wong formula Wong . Notice that, although the original form of the Wong formula does not work for light systems, because the angular momentum dependence of and is strong, the Wong formula itself as well as Eq. (5) still work as long as the barrier parameters and are evaluated at the grazing angle rather than at RKL89 ; RH14 .
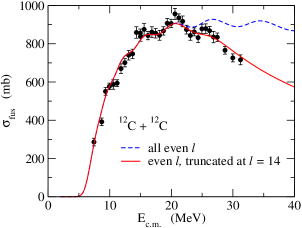
Lastly, we present our potential model fit to the experimental cross sections for the 12C+12C system. The dashed line in Fig. 9 shows the fusion cross sections obtained by including all even partial waves. It reproduces fairly well the experimental data up to around =25 MeV. At higher energies, however, the calculation overestimates fusion cross sections, a possible explanation for this being the failure of higher partial waves to fuse RH14 . As shown by the solid line in Fig. 9, one can in fact obtain a nice fit to the data by phenomenologically reducing the penetrability of the Coulomb barrier for by a factor of 2 and setting the penetrabilities for all the higher partial waves to be zero. Such an assumption may be justified given that the excitation energy for the compound nucleus, 24Mg, at energies corresponding to the barrier height for each partial wave is estimated to be below and for high partial waves, where and are one neutron and one proton separation energies, respectively, and is the yrast energy. Particle emission decays from the compound nucleus formed at such low non-collective excitation energies do not take place and the compound nucleus decays only by fission (that is, a reseparation into the entrance channel) or by the relatively slow process of decay, hindering the measured fusion cross sections.
5 Summary
We have advocated a use of the sum-of-differences (SOD) method as a promising method to deduce fusion cross sections from quasi-elastic cross sections. The barrier distribution with the fusion cross sections obtained by the SOD method, that is, the SOD barrier distribution, has a much better correspondence to the fusion barrier distribution as compared to the conventional quasi-elastic barrier distribution. Moreover, the SOD barrier distribution can be applied also to symmetric systems, whereas the quasi-elastic barrier distribution is not applicable due to the divergence of quasi-elastic cross sections at the scattering angle of . We have demonstrated these attractive features by carrying out the coupled-channels calculations for the 16O+144Sm, 58Ni+58Ni, and 12C+12C systems. The price to pay is that quasi-elastic cross sections have to be measured over many scattering angles with a small angle step so that one can perform the angle integral, whereas the conventional quasi-elastic barrier distribution requires experimental data at only a few backward angles. An interesting application of the SOD method may be to light symmetric systems, where fusion oscillations have been observed. For such systems, the experimental fusion cross sections often show significant discrepancies among each other, due partly to a difficulty to detect all the evaporation channels. For such systems, compared to a direct detection of evaporation residues, it might be easier to measure quasi-elastic cross sections, with which one can construct fusion cross sections using the SOD method.
Acknowledgment
We thank M. Dasgupta and D.J. Hinde for useful discussions. This work was supported by JSPS KAKENHI Grand Number 25105503.
References
- (1) N. Rowley, G. R. Satchler and P. H. Stelson, Phys. Lett. B 254, 25 (1991).
- (2) M. Dasgupta, D. J. Hinde, N. Rowley and A. M. Stefanini, Annu. Rev. Nucl. Part. Sci. 48, 401 (1998).
- (3) J. R. Leigh et al., Phys. Rev. C 52, 3151 (1995).
- (4) A. B. Balantekin and N. Takigawa, Rev. Mod. Phys. 70, 77 (1998).
- (5) K. Hagino and N. Takigawa, Prog. Theo. Phys. 128, 1061 (2012).
- (6) H. Timmers et al., Nucl. Phys. A 584, 190 (1994).
- (7) K. Hagino and N. Rowley, Phys. Rev. C 69, 054610 (2004).
- (8) S. Yusa, K. Hagino, and N. Rowley, Phys. Rev. C 88, 054621 (2013).
- (9) E. Piasecki et al., Phys. Rev. C80, 054613 (2009).
- (10) M. Zamrun F. and K. Hagino, Phys. Rev. C77, 014606 (2008).
- (11) J.T. Holdeman and R.M. Thaler, Phys. Rev. Lett. 14, 81 (1965); Phys. Rev. 139, B1186 (1965).
- (12) C. Marty, Z. Phys. A 309, 261 (1983); 322, 499 (1985).
- (13) M.S. Hussein et al., Phys. Lett. 114B, 1 (1982).
- (14) J. Barrette and N. Alamanos, Phys. Lett. 153B, 208 (1985).
- (15) R. Lipperheide, Nucl. Phys. A469, 190 (1987).
- (16) H. Wojciechowski, L.R. Medsker, and R.H. Davis, Phys. Rev. C16, 1767 (1977).
- (17) H. Oeschler et al., Nucl. Phys. A325, 463 (1979).
- (18) T. Yamaya et al., Phys. Lett. B417, 7 (1998).
- (19) K. Hagino and N. Rowley, to be published.
- (20) A.N. Ostrowski, W. Tiereth, and H. Voit, Phys. Rev. C44, 2082 (1991).
- (21) K. Hagino, N. Rowley and A. T. Kruppa, Comp. Phys. Commun. 123, 143 (1999).
- (22) D.J. Hinde et al., Phys. Rev. C76, 014617 (2007).
- (23) L.J. Satkowiak et al., Phys. Rev. C26, 2027 (1982).
- (24) J.J. Kolata et al., Phys. Rev. C21, 579 (1980).
- (25) D.G. Kovar et al., Phys. Rev. C20, 1305 (1979).
- (26) M. Conjeaud et al., Nucl. Phys. A309, 515 (1978).
- (27) P. Sperr et al., Phys. Rev. Lett. 37, 321 (1976).
- (28) C. Simenel et al., Phys. Rev. C88, 024617 (2013).
- (29) N. Poffe, N. Rowley and R. Lindsay, Nucl. Phys. A 410, 498 (1983).
- (30) A. Kabir, M. W. Kermode and N. Rowley, Nucl. Phys. A 481, 94 (1988).
- (31) H. Esbensen, Phys. Rev. C 85, 064611 (2012).
- (32) C.Y. Wong, Phys. Rev. C86, 064603 (2012).
- (33) C.Y. Wong, Phys. Rev. Lett. 31, 766 (1973).
- (34) N. Rowley, A. Kabir, and R. Lindsay, J. of Phys. G15, L269 (1989).
- (35) N. Rowley and K. Hagino, to be published.