Ba2phenanthrene is the main component in the Ba-doped phenanthrene sample
Abstract
We systematically investigate the crystal structure of Ba-doped phenanthrene with various Ba doping levels by the first principle calculation method combining with the X-ray diffraction (XRD) spectra simulation. The optimized lattice parameters and the simulated XRD spectra of Ba2phenanthrene are in good agreement with the experiment ones, and the strength difference of a few of XRD peaks can be explained by the existence of undoped phenanthrene in the experimental sample. Although the stoichiometry ratio of Ba atom and phenanthrene molecule is 1.5:1, the simulated XRD spectra, space group symmetry and the optimized lattice parameters of Ba1.5phenanthrene are not consistent to the measured values. The sample of Ba-doped phenanthrene is deduced to be the mixture of Ba2phenanthrene and some amount of undoped phenanthrene, instead of uniform Baphenanthrene. Our calculations indicate that Ba2phenanthrene is a semiconductor with a small energy gap less than 0.05 eV. Our findings provide the fundamental information of crystal structure and electronic properties of Ba-doped phenanthrene superconductor.
pacs:
74.70.Kn, 74.20.Pq, 61.66.Hq, 61.48.-cRecently, the discovery of superconductivity in potassium intercalated picene (C22H11) Mitsuhashi et al. (2010) by R. Mitsuhashi et al. in 2010 provides a new platform to explore the relationship of crystal structure, electronic property, magnetism and superconductivity. Subsequently, phenantherene (C14H10) Wang et al. (2011a) and dibenzopentacene (C30H18)Xue et al. (2012) were intercalated by potassium to synthesize new superconductors, which had similar molecular structure to picene just with the different number of benzene rings. On the other hand, alkaline earth and rare earth metal in place of alkaline metal were adopted to intercalated into phenanthrene crystal to explore their superconductivity. In experiment, the high quality Ba1.5phenanthreneWang et al. (2011b) and La1phenanthrene Wang et al. (2012) superconductors are obtained with superconductive shielding fractions and .
Although some new progresses on the aromatic superconductors have been made in experiment, such as new synthesis method for K3picene Kambe et al. (2012), confirmation of superconductivity from resistivity measurement Teranishi et al. (2013) and pressure effect on superconductivityChen et al. (2013); Kambe et al. (2012), there still remains lots of uncertainty in this new class of organic superconductor. Firstly, the detailed crystal structures of doped aromatic molecular solids have not yet been reported in experiment, especially the metal atom position, due to the sample degradation in air and the limit of measurement techniques Wang et al. (2012). And for the previous theoretical simulation on the crystal structure, the optimized lattice parameters for metal doped picene and phenantherene have large discrepancy to the experimental ones Kosugi et al. (2011); de Andres et al. (2011a, b); Naghavi et al. (2013); Yan et al. (2013). Secondly, the importance of electronic correlation and magnetism in metal doped aromatic solid were emphasized by several research groups Kim et al. (2011); Giovannetti and Capone (2011); Kim et al. (2013); Huang et al. (2012); Vergés et al. (2012) and they thought that their superconductivity is unconventional, but other groups thought the mechanism of superconductivity in aromatic superconductors could be explained in the framework of Bardeen-Cooper-Schrieffer (BCS) theory Bardeen et al. (1957) Kato et al. (2011). Thirdly, whether metal or insulator is the parent compounds of aromatic superconductor is in debat. Many experimental and theoretical researches think charge transferring from metal to molecular unoccupied orbits lead to metallicity and further to superconductivity in the class of compounds. However, Andreas Ruff et al. investigated the absence of metallicity in K-doped picene film on the Si substrate by photoelectron spectroscopy and ab initio density functional theory combined with dynamical mean-field theory (DFT + DMFT) Ruff et al. (2013). The insulating K-doped picene on the Au substrate Caputo et al. (2012)and insulating La-doped phenanthrene Naghavi et al. (2013); Yan et al. (2013) were also reported in experiment and theoretical simulation.
But anyway, it is noticed that the determination of the atomic structure for metal doped aromatic crystal is the first step to explore the electronic properties and the superconducting mechanism. Unfortunately, the simulated lattice parameters in the recent theoretical researches on the K- or La-intercalated phenanthrene or picene do not reproduce the experimental lattice. In this paper, we focus on alkaline earth metal barium doped phenanthrene, for which there is no theoretical exploration on the crystal structure and its electronic structure remains unknown. We perform the optimization of the crystal structure of Ba-doped phenanthrene under different doped concentration, and find that the lattice parameters of Ba2phenanthrene are in perfect agreement with the measurements. The simulated XRD spectra of Ba2phenanthrene indicate the doped Ba atom positions are also consistent to the experiment. But the case of Ba1.5phenanthrene is not good as Ba2phenanthrene. We can conclude that the experimental sample is mainly composed of Ba2phenanthrene mixed with some pristine phenanthrene, instead of unifrom Ba1.5phenanthrene.
In our calculations the generalized gradient approximation (GGA) with Perdew-Burke-Ernzerhof (PBE) formula Perdew et al. (1996) was adopted for the exchange-correlation potentials. The projector augmented-wave method (PAW) pseudopotentials were used to model the electron-ion interactions Blöchl (1994). The C, H, Ba psudopotentials are from the subfolder C, H, Ba, K, La in the pseudopotential package potpawPBE.52 supplied by Vienna Ab initio simulation package (VASP) website Kresse and Hafner (1993); Kresse and Furthmüller (1996). The plane wave basis cutoff is set to 300 eV. The Gaussian broadening technique was used and a mesh of k-points were sampled for the Brillouin-zone integration. The convergence thresholds of the total energy, force on atom and pressure on cell are 10-4 eV, 0.01 eV/Å and 0.1 KBar respectively, which criteria are all satisfied in calculation.
.
.
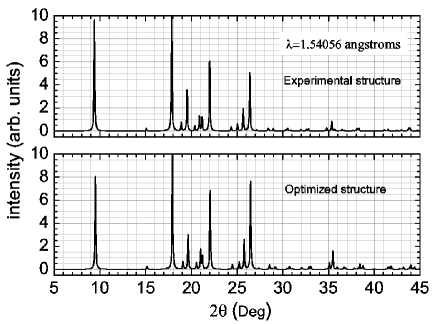
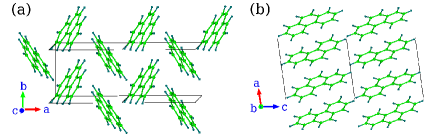
Pristine phenanthrene is a typical kind of molecular solid and crystallizes in the space group . Each unit cell contains two molecules which are arranged with a herringbone pattern, and phenanthrene molecules form a layer parallel to plane and then molecular layers are stacked along the axis. The crystal geometry is shown in Fig. 1. We first simulate the crystal structure of pristine phenanthrene, which can examine the applicability of C and H pseudopotentials in our calculation and can provide a reference for exploring the structure of the Ba-doped phenanthrene. After cell parameters and inner atom positions relaxation, we obtain the lattice parameters of pristine phenanthrene Å, Å, Å and , in a perfect agreement with the experimental parameters Å, Å, Å and Kay et al. (1971). For the experimental structure and our optimized structure of phenanthrene, we have calculated the XRD sepectra with Mercury program Mercury (2014), shown in Fig. 2. The consistency between two spectra demonstrate that the molecular positions in the cell in our calculation are in accord with the experiment measurement.
Although phenanthrene and Ba power are mixed with a stoichiometric ratio of in experiment, for the synthesized Baxphenanthrene there are several possible values of , such as , , , due to structural phase separation or non-uniform mixing in practice. So we explore the crystal structure of Baxphenanthrene with .
| a | b | c | space group | ||||
|---|---|---|---|---|---|---|---|
| Ba1phenanthrene(A) | 8.81(+0.32) | 6.19(+0.01) | 9.50(+0.0) | 89.48 | 99.77 | 87.61 | P1 |
| Ba1phenanthrene(B) | 8.45(-0.03) | 6.54(+0.36) | 9.41(-0.09) | 90.0 | 102.45 | 90.0 | P21 |
| Ba1.5phenanthrene | 8.43(-0.05) | 6.68(+0.50) | 9.40(-0.10) | 88.97 | 104.26 | 88.42 | P1 |
| Ba2.0phenanthrene | 8.64(+0.16) | 6.40(+0.22) | 9.76(+0.26) | 90.00 | 102.55 | 90.00 | P21 |
| ExperimentWang et al. (2011b) | 8.48 | 6.18 | 9.50 | 90.0 | 97.49 | 90.0 | P21 |
.
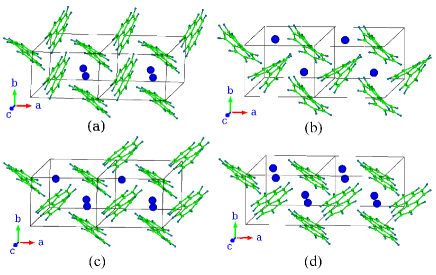
In a molecular layer of phenanthrene crystal, phenanthrene molecules are arranged in a herringbone manner and the regular interstitial spaces are formed. We call the interstitial space as hole and can find that each unit cell have two holes averagely. According to the previous studies Kosugi et al. (2009); Vergés et al. (2012), the dopants are accommodated in the intralayer region of the picene and phenanthrene solids, instead of the interlayer region. A Ba1phenanthrene unit cell consists of two Ba atoms and two molecules. There are two possible geometry configurations, one is that two Ba atoms sit in a hole with the neighbor hole unoccupied, another is that each hole has a Ba atom, called them as Ba1phenanthrene(A) and Ba1phenanthrene(B) respectively, shown in the Fig.3(a) and (b). For Ba1.5phenanthrene or Ba2phenanthrene, the unit cell is composed of three or four Ba atoms, which distribution in two holes is 1:2 or 2:2, see Fig.3 (c) and (d). Other some arrangements of Ba atoms with more than two atoms in a hole are also considered (not shown). For the four structural phases, the optimized lattice parameters and space group symmetry are listed in the Table.1.
Firstly, we exclude the Ba1phenanthrene(A) and Ba1phenanthrene(B) and think them to be non-real structure. For Ba1phenanthrene(A), its energy per unit cell decrease 0.18 eV relative to Ba1phenanthrene(B), which means Ba1phenanthrene(A) is more stable structure when the ratio of phenanthrene molecule and Ba atom is . The symmetry of Ba1phenanthrene(A) is P1 space group, instead of the measured symmetry , and the parameter = 87.61 Å leads to the cell shape deviating from the monoclinic cell. So, we exclude the Ba1phenanthrene(B) in terms of energy and exclude Ba1phenanthrene(A) in terms of symmetry and lattice parameters.
Secondly, we check the case of Ba1.5phenanthrene. Its unit cell is composed of three Ba atoms and two molecules. Because the number of Ba atoms is odd, there is no equivalent atom for the third Ba atom in terms of the symmetry operation of P21 space group (). Therefore, Ba1.5phenanthrene can not crystalize in space group P21. As can be seen from Table.1, , and have a large discrepancy to the experimental values. We also examine the energy change in the process that one metal atom is added into Ba1.5phenanthrene to form Ba2phenanthrene. The formation energy is defined as . is the energy of unit cell for Ba2phenanthrene, is the energy of unit cell for Ba1.5phenanthrene and is the energy of one metal atom in elemental metal. The is -0.21 eV. The negative values tell us that the process is easy to occur. So, we conclude that Ba1.5phenanthrene is also not the real structure in experiment.
Lastly, we demonstrate that the arrangement of molecules and Ba atoms in Ba2phenanthrene is the most reasonable structure. Comparing to the measured values, the calculated parameter , and for Ba2phenanthrene increase 0.16 Å, 0.22 Åand 0.26 Å. It is noticed that the discrepancies for three parameters are uniform, while only one of three parameters has a sharp increase relative to the experiment for Ba1phenanthrene(A), Ba1phenanthrene(B) and Ba1.5phenanthrene, which can be seen in Table.1. In Ba2phenanthrene, phenanthrene molecules have less distortion than those in Ba1phenanthrene(B), though both Ba2phenanthrene and Ba1phenanthrene(B) hold the P21 space group symmetry in accord with the measurement. As mentioned above, the energy of Ba1phenanthrene(A) is lower than Ba1phenanthrene(B) and the formation energy is negative. These facts indicate definitely that the configuration of one hole accommodating two Ba atoms is the stable structure. see Fig. 4.
.
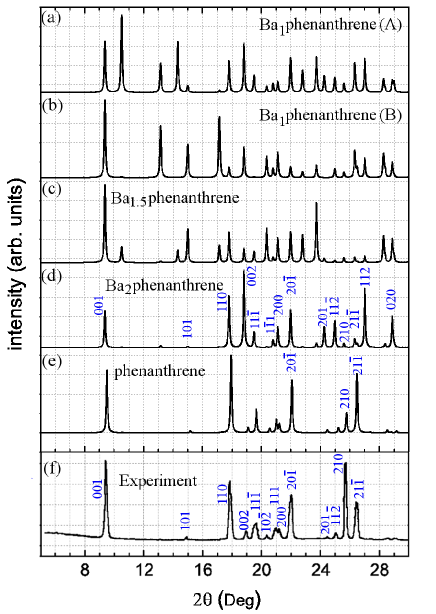
In order to further confirm our judgement on the Ba atom arrangement in Ba-doped phenanthrene, we investigate the XRD spectra of Ba-doped phenanthrene. The peaks in XRD spectra correspond to the different crystal planes, which can directly reflect atomic positions in crystal. We fix the lattice parameters at the experimental values and optimize atomic positions in the unit cell for the above four structure configurations. The simulated XRD spectra are presented in Fig. 4. At first, we compare the simulated XRD spectra of Ba1phenanthrene(A), Ba1phenanthrene(B) and Ba1.5phenanthrene with the measured XRD spectra of Ba-doped phenanthrene, shown in Fig. 4 (a), (b), (c) and (f). The profiles of three XRD spectra have a great discrepancy to the measured ones. Specifically, there exist a few of strong peaks in the degree range 10∘ - 17 ∘ and 22∘ - 25∘ in the three simulated XRD spectra, but no the corresponding peaks in the measured spectra. And the strength of several main peaks, for example (100), (20) and (210), are obviously less the experimental peaks. These extra peaks and differences of peak strength indicate that the crystal structures for Ba1phenanthrene(A), Ba1phenanthrene(B) and Ba1.5phenanthrene do not match the real structure.
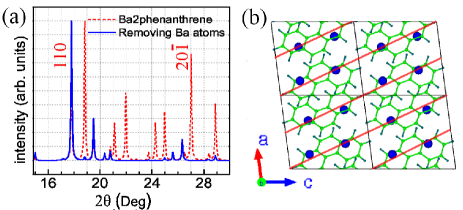
Then we focus on the XRD spectra of Ba2phenanthrene, which is shown in Fig. 4 (d) and the peak indexes are marked with the blue numbers. Unlike the above three structure configurations, its spectra is similar to the experimental XRD one. The peak positions in the degree range 5∘ - 27∘ are exactly consistent to the ones in the spectra in Fig.4 (f). Except for (002) peak, the strength of those peaks less than 24∘ including the little (101), (11), (11) and (20) peaks, has a good agreement with the experimental spectra. These peaks are in a tight correlation with Ba atoms positions. When we remove Ba atoms from the cell, the spectra is changed greatly, see Fig. 5 (a) (for direct view, the crystal planes corresponding to (20) peak is plotted in Fig. 5 (b)). Generally speaking, the XRD spectra of Ba2phenanthrene can reflect the main features of experimental XRD spectra.
Finally, how to explain the difference of (002), (210), (21) and other peaks in Fig. 4 (d) and (f). Let us look back the experiment where the stoichiometry ratio of molecule and Ba atom is 1:1.5. According to our above analysis, Ba2phenanthrene is the most possible structure phase with the ratio 1:2. Hence, there should exist residual undoped phenanthrene in the sample with about one forth of total phenanthrene. As displayed in Fig. 4 (e), the XRD spectra of pristine phenanthrene resembles surprisingly the spectra in the Fig. 4 (f). Therefore, the existence of quite a bit of phenanthrene can increase the strength of (210), (21) peak and decrease the strength of (002), (112) and (020) peak, make the XRD spectra of Ba2phenanthrene more close to the measured XRD spectra.
.
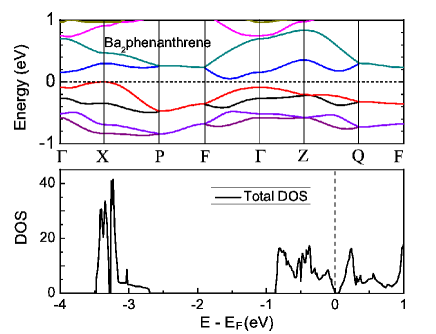
We further perform the first principle electronic structure calculation for Ba2phenanthrene. The band structure and the density of state (DOS) based on the fully optimized structure are presented in Fig.6. Ba2phenanthrene is a semiconductor with a very small energy gap less than 0.05 eV at the Fermi level. Two pairs of bands below Fermi energy result from two pairs of molecular orbitals - the lowest unoccupied molecular orbital (LUMO) and LUMO+1, related to two molecules in a unit cell. Four Ba atoms in a unit cell provide eight electrons to occupy the two pairs of energy bands. The bands related to the highest occupied molecular orbitals (HOMO) locate at -2.7 eV shown in the bottom panel of Fig.6, and the gap from -2.7 eV to -0.9 eV corresponds to the energy gap at Fermi level for pristine phenanthrene. As to the superconductivity in Ba-doped phenanthrene, Ba2phenanthrene should be the structural phase of parent compound. When the concentration of Ba has few percents deviation from 2 in Ba2phenanthrene, similar to the parent compounds of superconductors LaCuO4, the carriers can appear to lead to the metallicity and superconductivity.
In conclusion, the first principles investigation for the crystal structure and electronic properties of Ba-doped phenanthrene with various Ba concentrations have been performed. By comparing the simulated lattice parameter, space group symmetry with the experimental ones, we find that the structural phase of Ba2phenanthrene have a good agreement with the experimental structure. The simulated XRD spectra of Ba2phenanthrene is also similar to the measured spectra, and the difference of a few of peaks can be explained by the existence of some amount of undoped phenanthrene in the sample. The negative formation energy prove that it is easy to form Ba2phenanthrene. The electronic properties calculation indicate that Ba2phenanthrene is a semiconductor with a small energy gap less than 0.05 eV. Although the stoichiometry ratio of Ba atom and molecule is 1.5:1, its lattice parameters, space symmetry, XRD spectra are not consistent with the experimental ones. Hence, we conclude that the real structural phase of Ba-doped phenanthrene in experiment is not uniform Ba1.5phenanthrene, but Ba1.5phenanthrene mixed with some amount of undoped phenanthrene. To our knowledge, this is the first time that the simulated structure is in such a good agreement with the experiment and the first time that the positions for the dopant of metal atom are distinguished definitely for the metal doped aromatic superconductors. Our findings clarify that Ba2phenanthrene is the main component for Ba-doped phenanthrene and undoped phenanthrene also exist in the sample, which provide the important information of crystal structure and electronic properties of Ba-doped phenanthrene superconductor.
Acknowledgments: We acknowledge Cai-Zhuang Wang for interesting suggestion and fruitful discussion, and thank Jun-Feng Gao and Xiaoli Wang for their help in XRD simulation. This work was supported by MOST 2011CB922200, the Natural Science Foundation of China under Grants Nos. 91221103, 11174072 and U1204108.
References
- Mitsuhashi et al. (2010) R. Mitsuhashi, Y. Suzuki, Y. Yamanari, H. Mitamura, T. Kambe, N. Ikeda, H. Okamoto, A. Fujiwara, M. Yamaji, N. Kawasaki, Y. Maniwa, and Y. Kubozono, Nature 464, 76 (2010).
- Wang et al. (2011a) X. F. Wang, R. H. Liu, Z. Gui, Y. L. Xie, Y. J. Yan, J. J. Ying, X. G. Luo, and X. H. Chen, Nat. Commun. 2, 507 (2011a).
- Xue et al. (2012) M. Xue, T. Cao, D. Wang, Y. Wu, H. Yang, X. Dong, J. He, F. Li, and G. F. Chen, Sci. Rep. 2, 389 (2012).
- Wang et al. (2011b) X. F. Wang, Y. J. Yan, Z. Gui, R. H. Liu, J. J. Ying, X. G. Luo, and X. H. Chen, Phys. Rev. B 84, 214523 (2011b).
- Wang et al. (2012) X. F. Wang, X. G. Luo, J. J. Ying, Z. J. Xiang, S. L. Zhang, R. R. Zhang, Y. H. Zhang, Y. J. Yan, a. F. Wang, P. Cheng, G. J. Ye, and X. H. Chen, J. Phys. Condens. matter 24, 345701 (2012).
- Kambe et al. (2012) T. Kambe, X. He, Y. Takahashi, Y. Yamanari, K. Teranishi, H. Mitamura, S. Shibasaki, K. Tomita, R. Eguchi, H. Goto, Y. Takabayashi, T. Kato, A. Fujiwara, T. Kariyado, H. Aoki, and Y. Kubozono, Phys. Rev. B 86, 214507 (2012).
- Teranishi et al. (2013) K. Teranishi, X. He, Y. Sakai, M. Izumi, H. Goto, R. Eguchi, Y. Takabayashi, T. Kambe, and Y. Kubozono, Phys. Rev. B 87, 060505 (2013).
- Chen et al. (2013) X.-J. Chen, J.-J. Ying, Z.-X. Qin, Z.-J. Xiang, H. Wu, Q.-Z. Huang, A. Berlie, T. Muramatsu, X.-F. Wang, P. Cheng, X.-H. Chen, W. Yang, V. V. Struzhkin, and H.-K. Mao, , 30 (2013), arXiv:1303.5184 .
- Kosugi et al. (2011) T. Kosugi, T. Miyake, S. Ishibashi, R. Arita, and H. Aoki, Phys. Rev. B 84, 214506 (2011).
- de Andres et al. (2011a) P. L. de Andres, a. Guijarro, and J. a. Vergés, Phys. Rev. B 83, 245113 (2011a).
- de Andres et al. (2011b) P. L. de Andres, a. Guijarro, and J. a. Vergés, Phys. Rev. B 84, 144501 (2011b).
- Naghavi et al. (2013) S. S. Naghavi, M. Fabrizio, T. Qin, and E. Tosatti, Phys. Rev. B 88, 115106 (2013).
- Yan et al. (2013) X.-W. Yan, Z. Huang, and H.-Q. Lin, J. Chem. Phys. 139, 204709 (2013).
- Kim et al. (2011) M. Kim, B. I. Min, G. Lee, H. J. Kwon, Y. M. Rhee, and J. H. Shim, Phys. Rev. B 83, 214510 (2011).
- Giovannetti and Capone (2011) G. Giovannetti and M. Capone, Phys. Rev. B 83, 134508 (2011).
- Kim et al. (2013) M. Kim, H. C. Choi, J. H. Shim, and B. I. Min, New J. Phys. 15, 113030 (2013).
- Huang et al. (2012) Z. Huang, C. Zhang, and H.-Q. Lin, Sci. Rep. 2, 922 (2012).
- Vergés et al. (2012) J. a. Vergés, P. L. de Andres, E. San-Fabián, G. Chiappe, E. Louis, and a. Guijarro, Phys. Rev. B 85, 165102 (2012).
- Bardeen et al. (1957) J. Bardeen, L. Cooper, and J. Schrieffer, Phys. Rev. 108, 1175 (1957).
- Kato et al. (2011) T. Kato, T. Kambe, and Y. Kubozono, Phys. Rev. Lett. 107, 077001 (2011).
- Ruff et al. (2013) A. Ruff, M. Sing, R. Claessen, H. Lee, M. Tomić, H. O. Jeschke, and R. Valentí, Phys. Rev. Lett. 110, 216403 (2013).
- Caputo et al. (2012) M. Caputo, G. Di Santo, P. Parisse, L. Petaccia, L. Floreano, A. Verdini, M. Panighel, C. Struzzi, B. Taleatu, C. Lal, and A. Goldoni, J. Phys. Chem. C (2012), 10.1021/jp306640z.
- Perdew et al. (1996) J. P. Perdew, K. Burke, and M. Ernzerhof, Phys. Rev. Lett. 77, 3865 (1996).
- Blöchl (1994) P. E. Blöchl, Phys. Rev. B 50, 17953 (1994).
- Kresse and Hafner (1993) G. Kresse and J. Hafner, Phys. Rev. B 47, 558 (1993).
- Kresse and Furthmüller (1996) G. Kresse and J. Furthmüller, Phys. Rev. B 54, 11169 (1996).
- Kay et al. (1971) M. I. Kay, Y. Okaya, and D. E. Cox, Acta Crystallogr. Sect. B Struct. Crystallogr. Cryst. Chem. 27, 26 (1971).
- Mercury (2014) Mercury, “Crystal structure visualisation and exploration program,” http://www.ccdc.cam.ac.uk/products/mercury (2014).
- Kosugi et al. (2009) T. Kosugi, T. Miyake, S. Ishibashi, R. Arita, and H. Aoki, J. Phys. Soc. Japan 78, 113704 (2009).