Type II-Plateau supernovae as metallicity probes of the Universe
Abstract
We explore a method for metallicity determinations based on quantitative spectroscopy of type II-Plateau (II-P) supernovae (SNe). For consistency, we first evolve a set of 15 M⊙ main sequence stars at 0.1, 0.4, 1, and 2 the solar metallicity. At the onset of core collapse, we trigger a piston-driven explosion and model the resulting ejecta and radiation. Our theoretical models of such red-supergiant-star explosions at different metallicity show that synthetic spectra of SNe II-P possess optical signatures during the recombination phase that are sensitive to metallicity variations. This sensitivity can be quantified and the metallicity inferred from the strengths of metal-line absorptions. Furthermore, these signatures are not limited to O, but also include Na, Ca, Sc, Ti, or Fe. When compared to a sample of SNe II-P from the Carnegie SN Project and previous SN followup programs, we find that most events lie at a metallicity between 0.4 and 2 solar, with a marked scarcity of SN II-P events at SMC metallicity. This most likely reflects the paucity of low metallicity star forming regions in the local Universe.
SNe II-P have high plateau luminosities that make them observable spectroscopically at large distances. Because they exhibit signatures of diverse metal species, in the future they may offer a means to constrain the evolution of the composition (e.g., the O/Fe ratio) in the Universe out to a redshift of one and beyond.
keywords:
radiative transfer – supernovae: general1 Introduction
Accurate metallicity measurements are desirable in numerous fields of astrophysics. For example, mapping the evolution of metallicity with redshift is instrumental for understanding how the composition of the Universe has evolved since Big Bang nucleosynthesis occurred. Stars (Burbidge et al., 1957) and their supernovae (SNe; Arnett 1996) are the primary nuclear nurseries and thus the metallicity evolution of the Universe allows us to look into the characteristics of the stars and SNe that drove that evolution (Nomoto et al., 2013). Accurate metallicity determinations are needed to interpret and to refine the mass metallicity relation of galaxies (Tremonti et al., 2004), and to characterize the variation of metallicity with galacto-centric radius in spiral galaxies, which is a probe of the star formation history and galaxy dynamics (Boissier & Prantzos, 1999). An additional motivation is the need to better understand events that are expected theoretically to depend strongly on metallicity. A striking illustration is the case of long-duration -ray bursts (GRBs), which are interpreted as stemming from massive stars that avoid angular-momentum depletion through a metallicity-inhibited stellar wind (Woosley, 1993; Fruchter et al., 2006).
In distant astrophysical plasmas, the environmental metallicity is typically inferred through the analysis of emission lines produced in photo-ionized nebulae (Osterbrock, 1989). While a variety of techniques are used within this approach, they tend to be limited to oxygen abundance determinations (Kewley & Dopita, 2002; Pettini & Pagel, 2004) and subject to sizable systematic errors (Kewley & Ellison, 2008). Other metal abundances, however, may not scale linearly with that of oxygen. It is well known, for example, that oxygen is primarily produced by massive star explosions (Woosley & Weaver, 1995; Arnett, 1996), while SN Ia are the main contributors of iron-group elements in the Universe. Hence, an interesting abundance ratio to seek is O/Fe to constrain their relative contributions through the ages.
Furthermore, nebular line analyses can only be done in environments where the gas density is high enough to produce detectable emission lines. Star clusters in which the gas density is low, either intrinsically or following, for example, the action of massive star winds, cannot be studied for their metallicity this way. When applied to distant galaxies, this method suffers from irrevocable limitations in angular resolution, yielding a metallicity averaged over an extended region rather than the metallicity of a spatially restricted region.111This limitation can be somewhat overcome for reasonably nearby SNe by using integral field spectroscopy (see, e.g., Rigault et al. 2013). This is problematic for determining the metallicity at core-collapse SN sites (Anderson et al., 2010; Stoll et al., 2013), and in particular to quantify the metallicity bias between standard SNe Ib/c sites and those of GRB/SNe (Modjaz et al., 2008; Modjaz et al., 2011; Sanders et al., 2012).
Modeling stellar spectra offers an alternative to nebular analyses. Quantitative spectroscopy of optical and/or near-IR observations are used to determine the metal abundances in the star’s atmosphere. The advantage is that the theory of stellar atmospheres is well developed and accurate enough for abundance determinations (see, e.g., Kudritzki et al. 2012). The drawback is that stars are hard to observe beyond the Local Group, limiting their use to the very nearby Universe.
In this paper, we present an attractive method for metallicity determination that is based on SNe II-Plateau (II-P), which result from the core collapse and subsequent explosion of red-supergiant (RSG) stars (Grassberg et al., 1971; Van Dyk et al., 2003; Smartt et al., 2004). With such ejecta, it is possible to overcome some of the limitations described above:
-
1.
SNe II-P are very luminous and thus can be seen out to very large distances; in the phase when the ejecta is optically thick, which lasts for 100 d after explosion, a standard SN II-P has a typical bolometric luminosity of a few times 108 L⊙. Although they are yet to be discovered (and proven to exist), SNe II-P resulting from the pair-production instability are predicted to have even larger plateau luminosities (Kasen et al., 2011; Dessart et al., 2013), hence even more attractive detection limits for transient surveys. Over much of this high-luminosity phase, their photosphere is at the hydrogen recombination temperature, i.e., 7000 K. Consequently, the bulk of this SN II-P radiation emerges in the optical. It is thus particularly suited for observation of nearby and more distant events with optical and near-IR instruments on (very/extremely) large telescopes.
-
2.
Of all SNe, only SNe II-P are characterized by photospheres weakly affected by either steady-state or explosive nuclear burning. Specifically, elements beyond O (with the possible exception of Na) are unaffected by steady-state nuclear processing. While chemical mixing may influence the inner parts of the hydrogen-rich envelope of the progenitor RSG stars, the outer parts of the ejecta, which are probed by the photosphere for up to 80 d after explosion (see, e.g., Fig. 5 in Dessart & Hillier 2011) are essentially at the composition of the molecular cloud in which the progenitor star formed.
-
3.
Photospheric phase SNe II-P spectra can be modelled with high fidelity using non-LTE radiative-transfer codes like cmfgen (Dessart & Hillier, 2005, 2008; Hillier & Dessart, 2012; Dessart et al., 2013) or phoenix (Baron et al., 2007). Hence, quantitative spectroscopy can constrain the chemical composition at the photosphere, as routinely done for stellar atmospheres (see, e.g., Hillier & Miller 1998, 1999).
-
4.
SNe II-P exhibit spectral signatures associated with a variety of species, including intermediate-mass and iron-group elements. For example, during the recombination epoch, SNe II-P show strong lines of H i, O i, Na i, Ca ii, Sc ii, Ti ii, and Fe ii (given in order of increasing atomic mass) — this is a more diverse and eclectic set than the [O iii] 5007 Å and [N ii] 6584 Å lines seen in H ii regions and used for oxygen abundance determinations. As we demonstrate in this paper, metallicity variations in the primordial composition lead to distinct line strengths in the SN II-P optical spectrum as long as the SN photosphere probes the outer progenitor envelope. Hence, in addition to oxygen, one can use a SN II-P spectrum to constrain the mass fractions of additional species, including iron.
The dependence of SN II-P spectra to metallicity variations has been discussed at a qualitative level in the past for standard RSG star explosions (Baron et al., 2003; Dessart & Hillier, 2005; Kasen & Woosley, 2009; Dessart et al., 2013), as well as for pair-instability SNe (Kasen et al., 2011; Dessart et al., 2013). In this work, we use the radiative-transfer simulations of Dessart et al. (2013) to quantify the sensitivity of a variety of SN II-P spectral signatures to metallicity variations, and investigate whether these variations are sufficiently strong and well behaved to allow the inference of composition. As this study is only meant as a proof of principle we limit the present discussion to the restricted set of SN II-P models presented in Dessart et al. (2013), which correspond to the explosion of a massive star evolved from a 15 M⊙ main-sequence star with mesa (Paxton et al., 2011, 2013) at four different metallicities (one-tenth solar, two-fifth solar, solar, and twice solar). In a future study we will cover a broader range of progenitor and explosion properties, as well as metallicity values.
In the next section, we present the subset of models from Dessart et al. (2013) that we use in this work. We assess the sensitivity of synthetic spectra to metallicity variations in Section 3, and present a preliminary comparison to observations in Section 4. In Section 5, we present our conclusions and discuss some interesting implications, in particular the prospect of observing SNe II-P with very large and extremely large telescopes to constrain the composition of the Universe out to cosmological distances.
| model | Age | ||||||||||||||
|---|---|---|---|---|---|---|---|---|---|---|---|---|---|---|---|
| [Z⊙] | [M⊙] | [Myr] | [K] | [R⊙] | [L⊙] | [M⊙] | [M⊙] | [M⊙] | [M⊙] | [M⊙] | [M⊙] | [M⊙] | [B] | [M⊙] | |
| m15z2m3 | 0.1 | 14.92 | 13.57 | 4144 | 524 | 72890 | 7.483 | 5.048 | 0.507 | 1.61 | 4.15 | 10.77 | 13.29 | 1.35 | 0.081 |
| m15z8m3 | 0.4 | 14.76 | 13.34 | 3813 | 611 | 71052 | 7.183 | 5.252 | 0.428 | 1.63 | 4.09 | 10.67 | 13.12 | 1.27 | 0.036 |
| m15z2m2 | 1.0 | 14.09 | 12.39 | 3303 | 768 | 63141 | 6.630 | 5.105 | 0.325 | 1.62 | 3.88 | 10.21 | 12.48 | 1.27 | 0.050 |
| m15z4m2 | 2.0 | 12.60 | 10.88 | 3137 | 804 | 56412 | 5.119 | 5.042 | 0.387 | 1.40 | 3.77 | 8.83 | 11.12 | 1.24 | 0.095 |
| m15mlt1 | 1.0 | 14.01 | 12.36 | 3318 | 1107 | 106958 | 6.516 | 5.167 | 0.354 | 1.36 | 3.89 | 10.13 | 12.57 | 1.24 | 0.121 |
| m15mlt2 | 1.0 | 14.09 | 12.39 | 3303 | 768 | 63141 | 6.630 | 5.105 | 0.325 | 1.62 | 3.88 | 10.21 | 12.48 | 1.27 | 0.050 |
| m15mlt3 | 1.0 | 14.08 | 12.41 | 4106 | 501 | 64218 | 6.542 | 5.173 | 0.383 | 1.54 | 3.92 | 10.16 | 12.52 | 1.34 | 0.086 |
2 Summary of numerical setup
The simulations we discuss in this work have been presented in Dessart et al. (2013). For completeness, we summarize the numerical procedure for our calculations.
Using mesa star, Dessart et al. (2013) generated a grid of models starting with the same main-sequence mass of 15 M⊙ but varying a number of parameters known to influence stellar evolution. In this paper, we focus on the influence of metallicity variations, and present results for cases of 0.002, 0.008, 0.02 (taken as our solar metallicity), and 0.04 (named m15z2m3, m15z8m3, m15z2m2, and m15z4m2). When varying the metallicity, we merely scale the mass fraction of each metal by a factor 1/10, 2/5, 1, and 2. The mesa star simulations are performed adopting zero rotation, a mixing-length parameter (we adopt the Schwarschild criterion for convection), a standard resolution (mesh_delta_coeff=1), no core-overshooting, the mass loss rate recipes dubbed “Dutch” with a scaling of 0.8. At the end of its life, the solar metallicity model m15z2m2 is a 14.09 M⊙ RSG star with a luminosity of 63141 L⊙, a radius of 768 R⊙, and an effective temperature of 3303 K. It possesses an H-rich envelope of 10.21 M⊙ and an helium core of 3.88 M⊙ (set equal to the Lagrangian mass at the inner edge of the H-rich envelope). The outer edge of the iron core is at a Lagrangian mass of 1.6 M⊙.
Because of the adopted metallicity dependence of RSG mass loss rates, our mesa star models m15z2m3, m15z8m3, m15z2m2, and m15z4m2 have a final H-rich envelope mass that depends on Z, ranging from 10.77 (m15z2m3) down to 8.83 M⊙ (m15z4m2). The efficiency of convective energy transport being set in all four simulations through a mixing-length parameter of 1.6, the variation in metallicity, which changes the opacity in the envelope, alters the stellar radius (since the energy flux to transport from the edge of the core to the stellar surface is essentially the same between these 4 models). Consequently, for smaller metallicities (opacities), we obtain smaller RSG radii, with values between 524 R⊙ (m15z2m3) and 804 R⊙ (m15z4m2). Our RSG models are thus both more massive and more compact at lower metallicities. It is important to note that all our models encounter core collapse in the RSG phase. Hence, at least from a theoretical standpoint, there is no reason to believe that 15 M⊙ stars would not yield SNe II-P over a large range of metallicities.
When a mass cell within the iron-core reaches an infall velocity of 100 km s-1, each mesa star simulation is stopped and a piston-driven explosion is simulated with the grey radiation-hydrodynamics code v1d (Livne, 1993). Following the procedure outlined in Dessart et al. (2010), the piston deposits an energy equal to the binding energy of the envelope plus the asymptotic kinetic energy at infinity, which we select to be 1.2 B. v1d treats explosive nucleosynthesis so the change in composition following shock passage is computed. In piston-driven explosions, the amount of i produced depends sensitively on the adopted location of the piston and the timescale over which it injects energy. For the current set of simulations, the piston was placed at the base of the Si-rich shell and was given a constant velocity of 10000 km s-1 until the desired energy was reached. In this artificial approach, i is only produced in the densest (i.e., innermost) ejecta regions crossed by the piston. It is thus essential to apply an artificial mixing to these 1-D simulations in order to mimic the mixing that takes place in more realistic multi-D simulations of core-collapse SNe (Hammer et al., 2010).
The mixing we apply is moderate. For example, the initial mass fraction of i in the four ejecta modeled here is 10-6 at 2500 km s-1 (a location reached by the photosphere at 100 d after explosion; see also Fig. 5 of Dessart & Hillier 2011). Hence, in our models, radioactive decay has a negligible influence on the SN II-P radiation for most of the plateau length, either through heating, non-thermal ionization/excitation, or abundance variations. In Nature, mixing may be stronger and may influence the radiation earlier on. To ensure we probe only the initial star metallicity, it will be necessary to focus on the mid-plateau phase. In higher energy SN II-P explosions, more i may be produced and the plateau may be shorter and/or slanted (see Section 9 of Dessart et al. 2013). It is preferable to focus on standard energy explosions, with properties comparable to those of, e.g., SN 1999em.
About ten days after shock breakout, homologous expansion is reached. The full ejecta is remapped into cmfgen and evolved until nebular times. A summary of pre-SN and ejecta properties as well as model light curves are given in Dessart et al. (2013). These four ejecta have a similar color evolution, plateau length etc. but they show striking differences in spectral lines, which appear to reflect the variation in the metallicity of their progenitors. The focus of our present study is to discuss these metallicity signatures.
3 Synthetic signatures of metallicity variations in SNe II-P
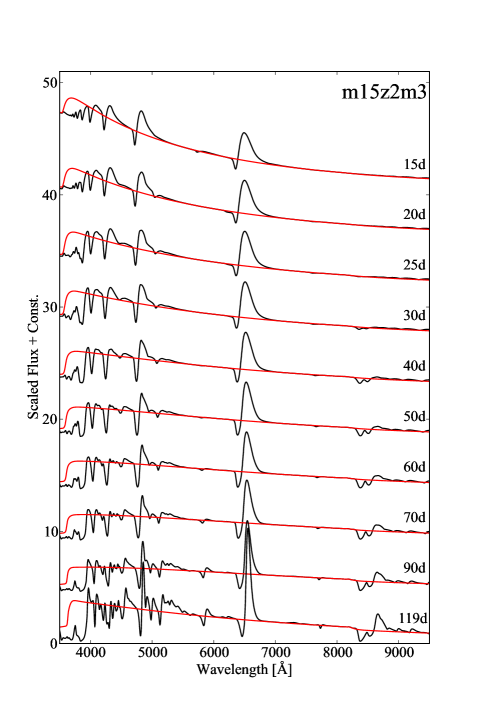
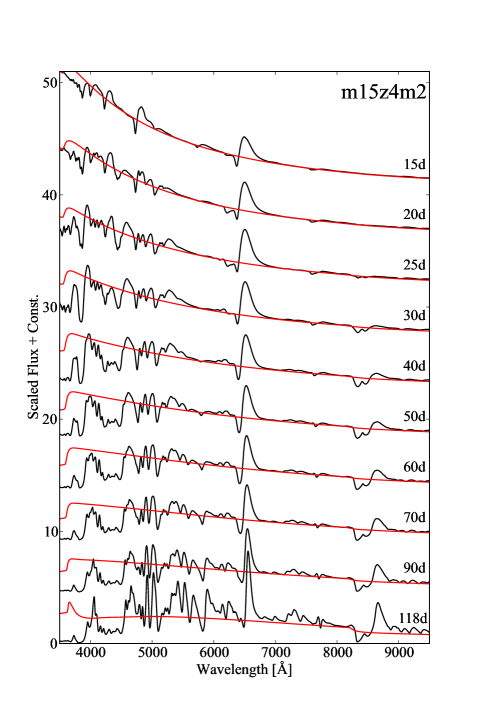
Discussing spectroscopic differences within a set of SN II-P models is complicated by the potentially distinct rates of evolution of their color and ejecta ionization. To disentangle abundance and ionization effects, which are both known to alter line strengths, it is best to compare these SN II-P models during the photospheric phase and when they have the same color, as done in Dessart et al. (2013) at of 0.4, 0.4, and 1.7 mag. Despite the comparable spectral energy distributions at a given color, our set of SN II-P models shows considerable diversity in individual lines strengths, and in particular during the recombination phase when metal-line blanketing strengthens. This phase typically starts a month after explosion, although variations in progenitor radius can delay its onset (Dessart et al., 2013). The lower the metallicity, the weaker the metal lines appear (Fig. 1). The most obvious variations are in the following spectral lines or groups of lines (given in order of increasing atomic mass of the parent species):
-
•
O i 7777 Å,
-
•
Na i D,
-
•
the Ca ii triplet at 8500 Å and the semi-forbidden-line doublet at 7300 Å,
-
•
the Ti ii broad blanketing region ranging from 4200 to 4500 Å, and associated with the atomic configurations 3d24s—3d24p, 3d3—3d24p,
-
•
Sc ii 5239 Å (4s2 1Se—4p 1Po), 5526 Å (3d2 1Ge—4p 1Fo), 5669 Å (3d2 1GPe—4p 3Po), and companion configurations,
-
•
Fe ii 4923, 5018, and 5169 Å (3d54s2Se—3d6 4p Po terms).
Because of line overlap, numerous other lines, from these or other metal species, prevent a clear connection to a metallicity variation, particularly when the metallicity is super solar (model m15z4m2). In this case, the total flux (black curve) departs significantly from the continuum flux level (red curve), even between neighboring P-Cygni profiles. In contrast, even when metal-line blanketing is strong, the lower metallicity model m15z2m3 still exhibits well isolated P-Cygni profiles, with the flux going back to the continuum level in-between neighboring features.
The UV range is very sensitive to the metal composition at the photosphere. Indeed, it is strongly attenuated by metal-line blanketing, even at one-tenth solar metallicity. Numerous metal lines overlap and may remain saturated even when the metal abundance decreases. Bumps and valleys in the UV range do not correspond to specific line features, but reflect absorption variations instead. So, bumps are merely regions of reduced absorptions (i.e., not residual emission above the continuum level). Hence, one cannot in general associate a given feature with a specific metal line, complicating the inference of metal abundances from UV spectra. The UV flux is also faint because of the low temperature of the photosphere during the recombination epoch. Hence, the UV domain is not ideal if we wish to determine robust metallicity signatures from SNe II-P spectra over a large range of distances.
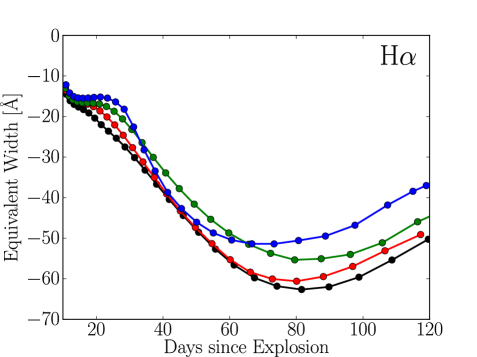
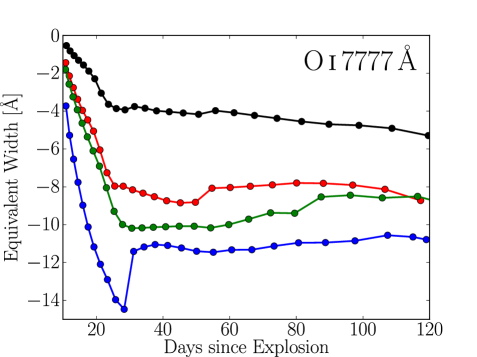
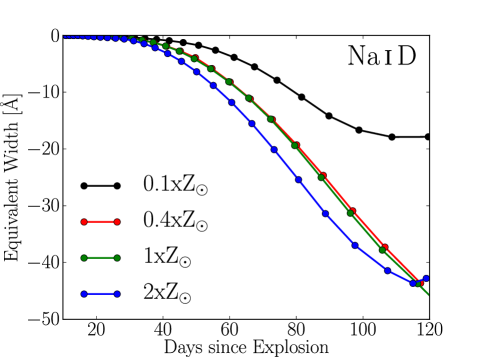
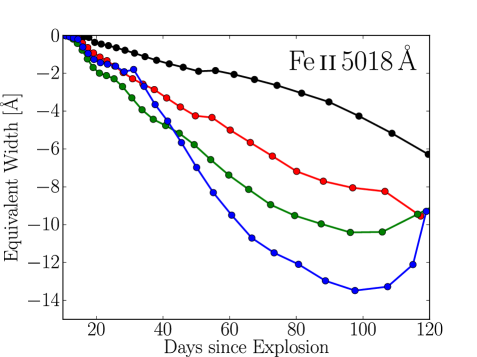
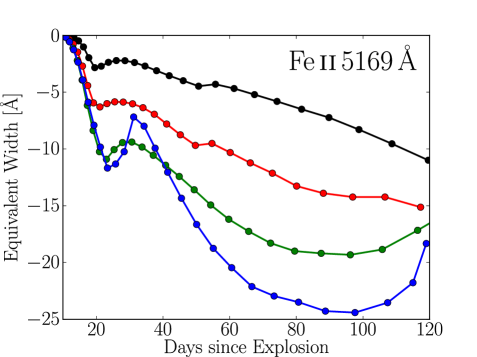
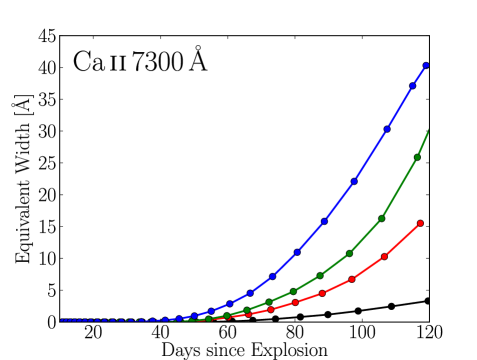
The strong differences shown in Fig. 1 can be quantified by means of line-absorption equivalent widths (EWs), which we measure for each time step in each model sequence. With cmfgen, we can compute the continuum flux for each epoch and thus calculate the true EW for any feature. However, line overlap often prevents the association of a given feature with a given transition in a given atom/ion. To identify an abundance effect on specific lines, which is our first goal, we compute the spectrum for each species individually. Doing these EW calculations on theoretical models is automatic and unambiguous, which is why in this model section we show such measurements, as opposed to the standard pseudo-equivalent width (pEW) extracted from observed spectra. We show the results of true EW calculations on H, O i 7777 Å, Na i D, Fe ii 5018 Å, Fe ii 5169 Å, and Ca ii 7300 Å in Fig. 2.
The H EW becomes more and more negative as the SN model proceeds through the photospheric phase. This is not a signature of an abundance variation but simply a reflection of the changing density and temperature conditions in the spectrum formation region (Dessart & Hillier, 2011; Dessart et al., 2013), as well as the increasing importance of time-dependent effects on the ionization (Utrobin & Chugai, 2005; Dessart & Hillier, 2008). The small differences in H EW among sequences are caused by small variations in blanketing of the UV flux. This affects the radiation through the photosphere and the formation of H, but the change in metallicity leaves the H mass fraction basically untouched.
A much stronger trend of increasing absorption/emission is present for lines associated with under-abundant species (Fig. 2). The magnitude of the effect varies considerably from low to high metallicity, which is not surprising since metallicity variations yield significant changes in the associated species mass fraction. The evolution of the EW can be non-monotonic, and its magnitude may behave non-linearly with metallicity. If we select mid-plateau epochs ( 50 d after explosion), we see that the O and Fe line strengths reflect with fidelity the variations in metallicity. The effect is strong — between models m15z2m3 and m15z4m2, the EW of O i 7777 Å and Fe ii 5018 Å or Fe ii 5169 Å varies by a factor of 3-4.
The Ca ii semi forbidden lines at 7300 Å, which are optically thin and in emission, also show a strong sensitivity to metallicity. These lines are observed and predicted here in our models during the second half of the plateau phase, hence well before the nebular phase. The associated line emission takes place in the outer SN ejecta (the former H-rich envelope) whose density is much lower than that of the inner ejecta at those epochs. In the SN context, the ejecta temperature and electron density are well constrained by the model and are comparable for the four models discussed here. Thus, the differing line strengths stem exclusively from variations in the Ca abundance in the H-rich envelope and hence offer an additional probe of the metallicity. The differences between models are huge (i.e., a factor of 10 between models m15z2m3 and m15z4m2). An important signature is that the model with a metallicity of one-tenth solar shows negligible Ca ii 7300 Å emission during the photospheric phase.
While there is no sizable error on the EW measurements performed on synthetic spectra, there are systematic errors associated with the modeling and these are hard to estimate. A lot of work has been devoted to test the code and ensure the results are as accurate as possible. We use a set of large model atoms, in particular for Fe i and Fe ii, because it is essential at the recombination epoch to obtain accurate colors (Dessart et al., 2013). In our simulations, doubling the spatial or frequency resolution does not change the synthetic spectra. The results are apparently well converged in a numerical sense.
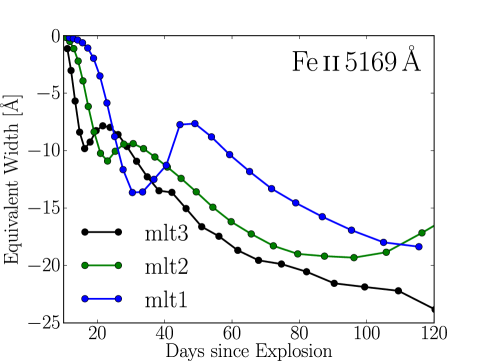
The main source of error in assessing metallicities from synthetic spectra will likely come from using ejecta or progenitor star models that are not suitable for the observed SN under consideration. For example, progenitor stars of different surface radii at the time of explosion produce SNe II-P that follow a different color evolution, exhibiting a significant variation in the time at which recombination occurs. Dessart et al. (2013) explored this issue by means of physical stellar evolution models (at solar metallicity) in which the mixing-length describing convection was modified from the standard value of 1.6 (model mlt2; 768 R⊙) to 1 (model mlt1; 1107 R⊙) and 3 (model mlt3; 501 R⊙). Only the model mlt3 fitted the observations of SN1999em, implying the stellar radius is not a free parameter but is instead constrained from observations — the other models remained too blue for too long. In Fig. 3, we show the evolution of the EW in Fe ii 5169 Å for these three models. The different times for the onset of recombination is evident; the models that recombine first (more compact progenitor), also show the strongest EW at the recombination epoch. The differences here are tied to the progenitor radius, while the metallicity, being solar for all three models, plays no role. This illustration gives some measure of the potential errors in our method but it gives a clear overestimate. When modeling a SN, the progenitor radius is one entity that we constrain — it is not a free parameter, and the same holds for the envelope mass or the explosion energy. Hence, it is important to select carefully the SN II-P we employ for metallicity determinations. As we discuss below, it is critical to exclude from the present study all SNe II-P with a significant slant in -band light curve during the photospheric phase, because unlike our present models they are not genuine plateau SNe. Furthermore, in the present study, we must select observations that are roughly compatible with our four models m15z2m3, m15z8m3, m15z2m2, and m15z4m2 (similar kinetic energy, similar color evolution). In the future, we will need to produce tailored models for each observed SN under study in order to limit potential systematic errors.
4 Comparison to observations
Measuring EWs in observed spectra can be difficult. If we have a radiative-transfer model that matches the observed SN flux we can also compute the continuum flux and proceed with the rectification of the spectrum. Lacking a model, the evaluation of the continuum level can be very uncertain, in particular short-ward of 5000 Å during the recombination phase. In this case, it is customary to measure pEWs, by calculating the area in absorption bounded by the local flux maxima around a given line absorption feature. Such measurements are typically done on features for which one transition is expected to dominate the absorption, e.g., Fe ii 5169 Å. In reality, this assumption is not guaranteed and the value of such a measurement may be difficult to interpret.
Although more straightforward than measuring true EWs, measuring pEWs can still be problematic when line blanketing and overlap are strong, as in model m15z4m2 (Fig. 1). For H, the presence of overlapping lines of Si ii early on and Fe ii at the recombination epoch introduces some ambiguity in the measurement. The broad Ti ii blanketing region is much worse in that respect although it is clear that the associated absorption is strongly sensitive to metallicity in our models (see also Dessart et al. 2013). For iron, rather than using the strong Fe ii 5169 Å, which shows signs of overlap, it is more convenient to use Fe ii 5018 Å; it is bounded by two Fe ii lines that make the Fe ii 5018 Å absorption dip easy to measure.
For this work, we use the database of type II SNe from the Carnegie SN Project (CSP; Hamuy et al. 2006) and other followup programs: the Calan/Tololo SN Survey (CT; Hamuy et al. 1993), the Cerro Tololo SN program, the SN Optical and Infrared Survey (SOIRS; Hamuy et al. 2002) and the Carnegie type II SN Survey (CATS; Hamuy et al. 2009). Anderson et al. (2014) have studied their -band light curves to reveal the diversity in fading-rate through the plateau phase, and thus the presence of intermediate events between plateau and linear SNe II. Here, we select events that show a rough photometric and spectroscopic compatibility with our four basic SNe II-P models. In practice, we exclude SNe that show an appreciable slant in the -band light curve (events with an 1; see Anderson et al. 2014 for details). We also exclude events that have a strongly delayed onset of the recombination phase (suggesting an anomalously slow ejecta cooling, as may arise from a progenitor envelope that is more extended that normal; e.g., SN 2004er; Modjaz et al. 2004; Anderson et al. 2014). This rough filtering is necessary in order to isolate spectral diversity associated with variations in primordial composition rather than with SN energetics or progenitor structure (even if there may well be a connection between these various progenitor/explosion properties). Doing this filtering is essential to reduce systematic errors. In the future, we will need to use a broader sample of progenitor/explosion models at different metallicity to reflect the type II SN diversity, or produce a tailored model for each SN under study.
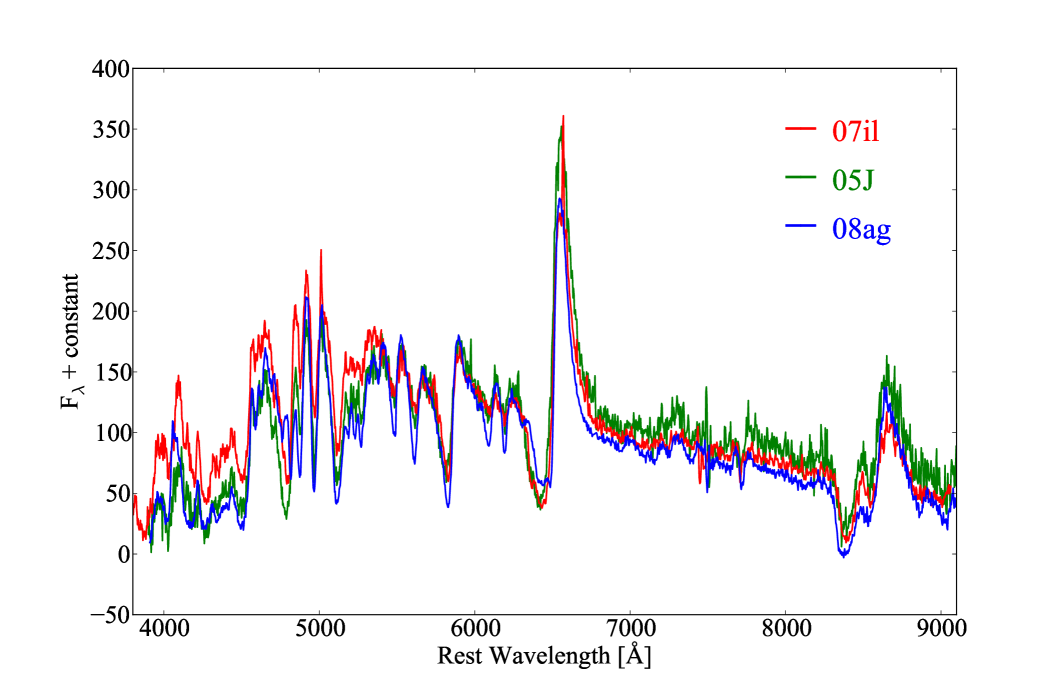
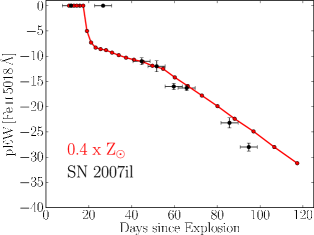
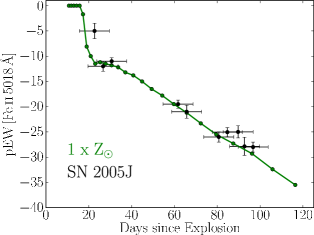
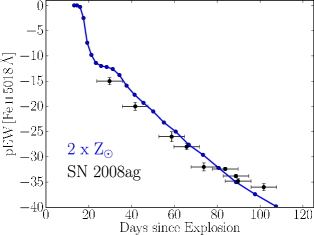
In Fig. 4, we first show the pEW of Fe ii 5018 Å for three SNe II-P. The errors for each datapoint include one on the explosion time. We may set it equal to the time between detection and prior non-detection, estimate it using snid (Blondin & Tonry, 2007), or use an inference from SN modeling (e.g., SN 1999em; Dessart & Hillier 2006). The other error is on the pEW, which is estimated from repeating the measurement multiple times. The pEW in Fe ii 5018 Å follows quite closely the trajectories of models m15z8m3 (0.4Z⊙; 2007il), m15z2m2 (Z⊙; 2005J), and m15z4m2 (2.0Z⊙; 2008ag) — no SN follows the morphology of model m15z2m3 (0.1Z⊙). Figure 4 suggests that some observations exhibit relatively weak or strong Fe ii lines (Fig. 5), in a systematic fashion, and in that respect reflect our results from sub- to super-solar metallicity models.
When we focus on the recombination phase, around 80 d after explosion, we find that the larger sample of type II SNe is well distributed within the tracks of models at 0.4 and 2Z⊙ (Fig. 6). There is a marked scarcity of SNe II-P at a metallicity below that found in the LMC. For comparison, we add the location of SN 1999em, which sits at a slightly super-solar metallicity value.
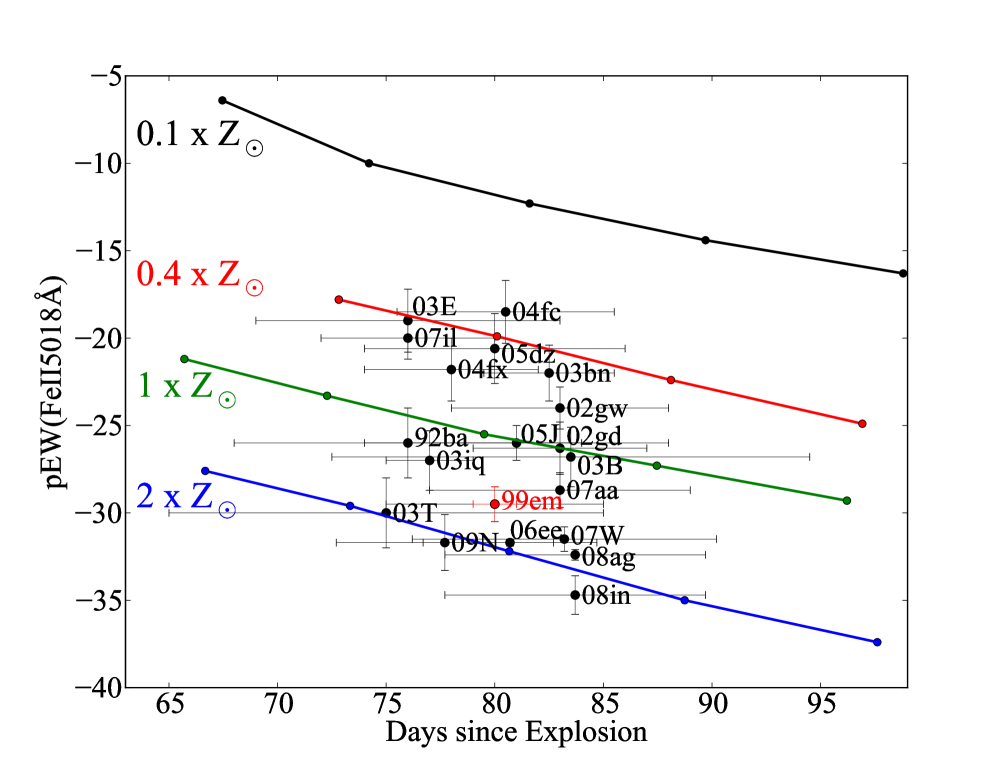
Progenitor metallicities of core-collapse SNe discovered by means of targeted surveys have been studied in the past by Anderson et al. (2010). Using nebular-line analyses of a coincident or nearby H ii region, they infer a of 8.14 for SN 2003E, 8.24 for SN 2002gw, 8.52 for SN 1992ba, 8.73 for SN 2003B, 8.61 for SN 1999em, and 8.64 for SN 2003T (on the N2 scale of Pettini & Pagel 2004). These values reflect within the uncertainties the trend we obtain with our pEW measurements, and thus confirm the results shown in Fig. 6. Anderson et al. (2010) do not find any SN II-P at low metallicity, although this may result from using SNe in high luminosity hosts, which are biased towards high metallicity. The untargeted survey from the Palomar Transient Factory also have no SN II-P at very low metallicity (Stoll et al., 2013). In the future, we will perform a more complete analysis of both SNe II-P and host-galaxies/H ii-regions to compare in detail the metallicity inferred from both techniques. We will also extend the sample to include SNe II-P from untargeted surveys.
5 Discussion and conclusions
Extending the previous parameter study of Dessart et al. (2013), we have explored in more detail the systematic variations of SN II-P spectra with metallicity. Provided one limits the epochs to a few weeks prior to the end of the plateau phase, the metal lines appearing in SN II-P spectra reflect the metallicity of the progenitor star, and allow one to place some constraints on the abundances of oxygen, sodium, titanium, scandium, or iron. This wide range of species spans from moderate to high atomic mass, and produced by nuclear burning under different conditions (e.g. steady-state burning in stars versus explosive burning in SNe).
In this paper we have quantified the variations of the line-absorption EW with metallicity in several strong and/or isolated lines including O i 7777 Å, Na i D, Ti ii absorption at 4200-4500 Å, Fe ii 5018, Fe ii 5169 Å, as well as the Ca ii 7300 Å emission doublet. More lines could be studied but this diverse set is good for the proof-of-concept discussion. We also avoid using the UV range due to the low fluxes, saturated and badly blended lines, and the sensitivity to parameters other than metallicity. We find that in all models, the evolution through the plateau phase leads to a systematic increase in the magnitude of these EWs. H shows little sensitivity to metallicity, while Na i D becomes markedly weaker only when the metallicity is decreased to one-tenth solar. However, O i 7777 Å, Fe ii 5169 Å, and Fe ii 5018 Å exhibit a systematic trend at all times that correlates with the metallicity of the model. A good time for analysis is during the recombination phase, when metal-line blanketing is strong, but before the end of the plateau to avoid any pollution at the photosphere, as may occur through the mixing of species from the helium core into the H-rich envelope.
We have confronted the models to a selection of SNe II-P from the CSP and former followup programs (Hamuy et al., 2006; Anderson et al., 2014). Calculating pseudo-EWs on both observations and models at the recombination epoch, we find they exhibit the same behavior from the early-photospheric phase until the end of the plateau (e.g., increasing EW magnitude in Fe ii 5018 Å). Comparing the measurements at 80 d after explosion, we find that all selected SNe fall within the pEW limits set by the 0.4 and 2 Z⊙ models. No SN II-P in our sample matches the weak metal-line strengths of our model at Z⊙/10. Since the CSP observations are probably representative of type II SNe, we speculate that we are yet to observe a SN II-P at SMC metallicity in the local Universe.
Our metallicity measurements compare favorably with nebular-line analyses. Such studies, based on both targeted (Anderson et al., 2010) and untargeted (Stoll et al., 2013) surveys confirm the scarcity of SNe II-P at low metallicity. The absence of low metallicity SNe in our sample most likely reflects the paucity of very low metallicity systems in the local universe. The absence of low metallicity hosts is also seen in the analysis of core collapse SNe out to 0.2 by Kelly et al. (2014). Since stellar evolution depends on metallicity it is important to study SN at low metallicities. Extreme rotation rates on the main sequence, for example, can prevent a star, if it has an initial mass of 20 M⊙, from evolving to the red and from exploding as a RSG (see, e.g., Brott et al. 2011). Irrespective of rotation, stars in the mass range 10–20 M⊙ are expected to explode in a RSG phase at low metallicity, and thus should be seen.
In addition to providing important constraints on the SN and its progenitor, quantitative spectroscopy of SNe can also be used for determining the evolution of metallicity with redshift, and for revealing the metallicity distribution with galactocentric radius. The high luminosity of SNe makes them ideal substitutes to stars (see, e.g., Kudritzki et al. 2012), but may also offer an alternative to nebular-line analyses (Osterbrock, 1989; Kewley & Dopita, 2002; Pettini & Pagel, 2004). At very large distances, we will need super-luminous SNe resulting from the pair-production instability in a super-massive RSG-star, since their plateau luminosities are predicted to be on the order of 1010 rather than a few 108 L⊙ (Kasen et al., 2011; Dessart et al., 2013). Unfortunately, such super-luminous SN II-P events are yet to be discovered.
With VLT-FORS, a SN II-P of 14th magnitude at 10 Mpc requires a 0.7 s exposure to yield a S/N of 30 per pixel (grism 150I). At 100 Mpc, this exposure time is 70 s. Using a Hubble constant of 70 km s-1 Mpc-1, that same SN at a redshift of 0.1 would require an exposure of about 30 min for the same setup. With the future extremely-large telescopes, going up to redshift one and beyond may be possible. In practice, to reduce systematic errors from the modeling and to circumvent inaccurate pseudo-equivalent widths measurements, it will be desirable to perform detailed modeling of each SN II-P under study.
Acknowledgments
LD acknowledges financial support from the Unité Mixte Internationale 3386 (Laboratoire Franco-Chilien d’Astronomie, CNRS/INSU France, Universidad de Chile), from the European Community through the International Re-integration Grant PIRG04-GA-2008-239184, and from the “Agence Nationale de la Recherche” through the grant ANR-2011-Blanc-SIMI-5-6-007-01. C.P.G. acknowledges support from CONICYT-AGCI PhD studentship. C.P.G., M.H., J.P.A, and F.L acknowledge support from the Millennium Center for Supernova Science through grant P10 064-F and the Millennium Institute for Astrophysics grant IC120009, funded by Programa Iniciativa Cientifica Milenio. DJH acknowledges support from STScI theory grant HST-AR-12640.01, and NASA theory grants NNX10AC80G and NNX14AB41G. This work was granted access to the HPC resources of CINES (France) under the allocation c2013046608 made by GENCI (Grand Equipement National de Calcul Intensif). G. F. acknowledges financial support by Grant-in-Aid for Scientific Research for Young Scientists (23740175). This material is based upon work supported by NSF under grants AST–0306969, AST-0908886, AST–0607438, and AST-1008343. M. S. acknowledges the generous support provided by the Danish Agency for Science and Technology and Innovation through a Sapere Aude Level 2 grant.
References
- Anderson et al. (2010) Anderson J. P., Covarrubias R. A., James P. A., Hamuy M., Habergham S. M., 2010, MNRAS, 407, 2660
- Anderson et al. (2014) Anderson J. P., et al. 2014, submitted to ApJ
- Arnett (1996) Arnett D., 1996, Supernovae and Nucleosynthesis: An Investigation of the History of Matter from the Big Bang to the Present. Princeton University Press
- Baron et al. (2007) Baron E., Branch D., Hauschildt P. H., 2007, ApJ, 662, 1148
- Baron et al. (2003) Baron E., Nugent P. E., Branch D., Hauschildt P. H., Turatto M., Cappellaro E., 2003, ApJ, 586, 1199
- Blondin & Tonry (2007) Blondin S., Tonry J. L., 2007, ApJ, 666, 1024
- Boissier & Prantzos (1999) Boissier S., Prantzos N., 1999, MNRAS, 307, 857
- Brott et al. (2011) Brott I., de Mink S. E., Cantiello M., Langer N., de Koter A., Evans C. J., Hunter I., Trundle C., Vink J. S., 2011, A&A, 530, A115
- Burbidge et al. (1957) Burbidge E. M., Burbidge G. R., Fowler W. A., Hoyle F., 1957, Reviews of Modern Physics, 29, 547
- Dessart & Hillier (2005) Dessart L., Hillier D. J., 2005, A&A, 437, 667
- Dessart & Hillier (2006) Dessart L., Hillier D. J., 2006, A&A, 447, 691
- Dessart & Hillier (2008) Dessart L., Hillier D. J., 2008, MNRAS, 383, 57
- Dessart & Hillier (2011) Dessart L., Hillier D. J., 2011, MNRAS, 410, 1739
- Dessart et al. (2013) Dessart L., Hillier D. J., Waldman R., Livne E., 2013, MNRAS, 433, 1745
- Dessart et al. (2010) Dessart L., Livne E., Waldman R., 2010, MNRAS, 408, 827
- Dessart et al. (2013) Dessart L., Waldman R., Livne E., Hillier D. J., Blondin S., 2013, MNRAS, 428, 3227
- Fruchter et al. (2006) Fruchter A. S., Levan A. J., Strolger L., Vreeswijk P. M., Thorsett S. E., Bersier D., Burud I., Castro Cerón J. M., Castro-Tirado A. J., Conselice C., Dahlen T., Ferguson H. C., et al. 2006, Nature, 441, 463
- Grassberg et al. (1971) Grassberg E. K., Imshennik V. S., Nadyozhin D. K., 1971, Ap&SS, 10, 28
- Grevesse & Sauval (1998) Grevesse N., Sauval A. J., 1998, Space Science Reviews, 85, 161
- Hammer et al. (2010) Hammer N. J., Janka H.-T., Müller E., 2010, ApJ, 714, 1371
- Hamuy et al. (2009) Hamuy M., Deng J., Mazzali P. A., Morrell N. I., Phillips M. M., Roth M., Gonzalez S., Thomas-Osip J., Krzeminski W., Contreras C., Maza J., González L., et al. 2009, ApJ, 703, 1612
- Hamuy et al. (2006) Hamuy M., Folatelli G., Morrell N. I., Phillips M. M., Suntzeff N. B., Persson S. E., Roth M., Gonzalez S., Krzeminski W., Contreras C., Freedman W. L., Murphy D. C., Madore B. F., Wyatt P., Maza J., Filippenko A. V., Li W., Pinto P. A., 2006, PASP, 118, 2
- Hamuy et al. (1993) Hamuy M., Maza J., Phillips M. M., Suntzeff N. B., Wischnjewsky M., Smith R. C., Antezana R., Wells L. A., Gonzalez L. E., Gigoux P., Navarrete M., Barrientos F., Lamontagne R., della Valle M., et al. 1993, AJ, 106, 2392
- Hamuy et al. (2002) Hamuy M., Maza J., Pinto P. A., Phillips M. M., Suntzeff N. B., Blum R. D., Olsen K. A. G., Pinfield D. J., Ivanov V. D., Augusteijn T., et al. 2002, AJ, 124, 417
- Hillier & Dessart (2012) Hillier D. J., Dessart L., 2012, MNRAS, 424, 252
- Hillier & Miller (1998) Hillier D. J., Miller D. L., 1998, ApJ, 496, 407
- Hillier & Miller (1999) Hillier D. J., Miller D. L., 1999, ApJ, 519, 354
- Kasen & Woosley (2009) Kasen D., Woosley S. E., 2009, ApJ, 703, 2205
- Kasen et al. (2011) Kasen D., Woosley S. E., Heger A., 2011, ApJ, 734, 102
- Kelly et al. (2014) Kelly P. L., Filippenko A. V., Modjaz M., Kocevski D., 2014, ArXiv:1401.0729
- Kewley & Dopita (2002) Kewley L. J., Dopita M. A., 2002, ApJS, 142, 35
- Kewley & Ellison (2008) Kewley L. J., Ellison S. L., 2008, ApJ, 681, 1183
- Kudritzki et al. (2012) Kudritzki R.-P., Urbaneja M. A., Gazak Z., Bresolin F., Przybilla N., Gieren W., Pietrzyński G., 2012, ApJ, 747, 15
- Livne (1993) Livne E., 1993, ApJ, 412, 634
- Modjaz et al. (2004) Modjaz M., Challis P., Kirshner R., Calkins M., 2004, IAU Circ., 8415, 2
- Modjaz et al. (2011) Modjaz M., Kewley L., Bloom J. S., Filippenko A. V., Perley D., Silverman J. M., 2011, ApJL, 731, L4
- Modjaz et al. (2008) Modjaz M., Kewley L., Kirshner R. P., Stanek K. Z., Challis P., Garnavich P. M., Greene J. E., Kelly P. L., Prieto J. L., 2008, AJ, 135, 1136
- Nomoto et al. (2013) Nomoto K., Kobayashi C., Tominaga N., 2013, ARA&A, 51, 457
- Osterbrock (1989) Osterbrock D. E., 1989, Astrophysics of gaseous nebulae and active galactic nuclei. University Science Books
- Paxton et al. (2011) Paxton B., Bildsten L., Dotter A., Herwig F., Lesaffre P., Timmes F., 2011, ApJS, 192, 3
- Paxton et al. (2013) Paxton B., Cantiello M., Arras P., Bildsten L., Brown E. F., Dotter A., Mankovich C., Montgomery M. H., Stello D., Timmes F. X., Townsend R., 2013, ApJS, 208, 4
- Pettini & Pagel (2004) Pettini M., Pagel B. E. J., 2004, MNRAS, 348, L59
- Rigault et al. (2013) Rigault M., Copin Y., Aldering G., Antilogus P., Aragon C., Bailey S., Baltay C., Bongard S., Buton C., Canto A., Cellier-Holzem F., Childress M., Chotard N., Fakhouri H. K., Feindt U., et al. 2013, A&A, 560, A66
- Sanders et al. (2012) Sanders N. E., Soderberg A. M., Levesque E. M., Foley R. J., Chornock R., Milisavljevic D., Margutti R., Berger E., Drout M. R., Czekala I., Dittmann J. A., 2012, ApJ, 758, 132
- Smartt et al. (2004) Smartt S. J., Maund J. R., Hendry M. A., Tout C. A., Gilmore G. F., Mattila S., Benn C. R., 2004, Science, 303, 499
- Stoll et al. (2013) Stoll R., Prieto J. L., Stanek K. Z., Pogge R. W., 2013, ApJ, 773, 12
- Tremonti et al. (2004) Tremonti C. A., Heckman T. M., Kauffmann G., Brinchmann J., Charlot S., White S. D. M., Seibert M., Peng E. W., Schlegel D. J., Uomoto A., Fukugita M., Brinkmann J., 2004, ApJ, 613, 898
- Utrobin & Chugai (2005) Utrobin V. P., Chugai N. N., 2005, A&A, 441, 271
- Van Dyk et al. (2003) Van Dyk S. D., Li W., Filippenko A. V., 2003, PASP, 115, 1289
- Woosley (1993) Woosley S. E., 1993, ApJ, 405, 273
- Woosley & Weaver (1995) Woosley S. E., Weaver T. A., 1995, ApJS, 101, 181