Reassortment between influenza B lineages and the emergence of a co-adapted PB1-PB2-HA gene complex
Abstract
Influenza B viruses make a considerable contribution to morbidity attributed to seasonal influenza. Currently circulating influenza B isolates are known to belong to two antigenically distinct lineages referred to as B/Victoria and B/Yamagata. Frequent exchange of genomic segments of these two lineages has been noted in the past, but the observed patterns of reassortment have not been formalized in detail. We investigate inter-lineage reassortments by comparing phylogenetic trees across genomic segments. Our analyses indicate that of the 8 segments of influenza B viruses only PB1, PB2 and HA segments maintained separate Victoria and Yamagata lineages and that currently circulating strains possess PB1, PB2 and HA segments derived entirely from one or the other lineage; other segments have repeatedly reassorted between lineages thereby reducing genetic diversity. We argue that this difference between segments is due to selection against reassortant viruses with mixed lineage PB1, PB2 and HA segments. Given sufficient time and continued recruitment to the reassortment-isolated PB1-PB2-HA gene complex, we expect influenza B viruses to eventually undergo sympatric speciation.
Introduction
Seasonal influenza causes between 250,000 and 500,000 deaths annually and comprises lineages from three virus types (A, B and C) co-circulating in humans, of which influenza A is considered to cause the majority of seasonal morbidity and mortality (World Health Organization, 2009). Occasionally influenza B viruses become the predominant circulating virus in some locations, for example in the 2012/2013 European season as many as 53% of influenza sentinel surveillance samples tested positive for influenza B (Broberg et al., 2013).
Like other members of Orthomyxoviridae, influenza B viruses have segmented genomes, which allow viruses co-infecting the same cell to exchange segments, a process known as reassortment. Influenza A viruses are widely considered to be a major threat to human health worldwide due to their ability to cause pandemics in humans via reassortment of circulating human strains with non-human influenza A strains. Although influenza B viruses have been observed to infect seals (Osterhaus et al., 2000; Bodewes et al., 2013) through a reverse zoonosis, they are thought to primarily infect humans and are thus unlikely to exhibit pandemics due to the absence of an animal reservoir from which to acquire antigenic novelty. Both influenza A and B evolve antigenically through time in a process known as antigenic drift, in which mutations to the haemagglutinin (HA) protein allow viruses to escape existing human immunity and persist in the human population, leading to recurrent seasonal epidemics (Burnet, 1955; Hay et al., 2001; Bedford et al., 2014).
Currently circulating influenza B viruses comprise two distinct lineages – Victoria and Yamagata (referred to as Vic and Yam, respectively) – named after strains B/Victoria/2/87 and B/Yamagata/16/88, that are thought to have genetically diverged in HA around 1983 (Rota et al., 1990). These two lineages now possess antigenically distinct HA surface glycoproteins (Kanegae et al., 1990; Rota et al., 1990; Nerome et al., 1998; Nakagawa et al., 2002; Ansaldi et al., 2003) allowing them to co-circulate in the human population. Phylogenetic analysis of evolutionary rate, selective pressures and reassortment history of influenza B has shown extensive and often complicated patterns of reassortment between all segments of influenza B viruses both between and within the Vic and Yam lineages (Chen and Holmes, 2008).
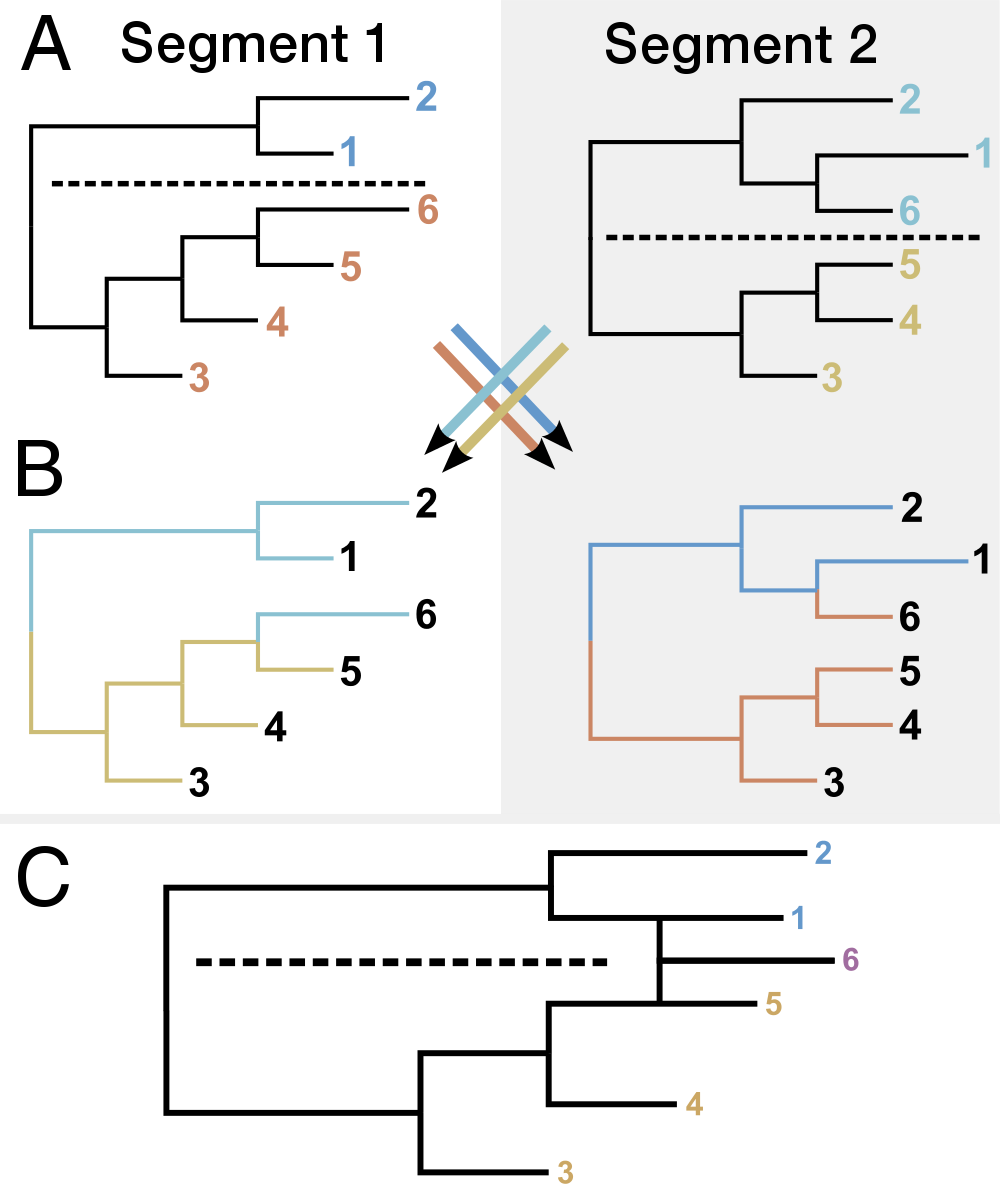
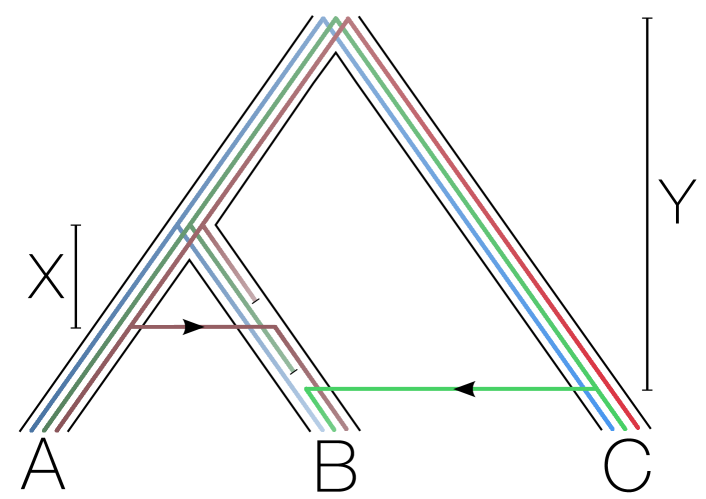
Here, we extend previous methods to reveal an intriguing pattern of reassortment in influenza B. In our approach, membership to either the Victoria or Yamagata lineage in one segment is used to label the individual isolates in the tree of the other segments. By modelling the transition between labels on a phylogenetic tree, reassortment events which result in the replacement of one segment’s lineage by another show up as label changes along a branch (Figure 1). We use this method to reconstruct major reassortment events and quantify reassortment dynamics over time in a dataset of 452 influenza B genomes, and conduct secondary analyses in a dataset of 1603 influenza B genomes.
We show that despite extensive reassortment, three of the eight segments – two segments coding for components of the influenza B virus polymerase, PB1 and PB2, and the surface glycoprotein HA – still survive as distinct Victoria and Yamagata lineages, which appear to be co-dependent to the point where virions which do not contain PB1, PB2 or HA segments derived entirely from either the Vic or the Yam lineage have rarely been isolated and only circulate as transient lineages once isolated. In other segments (PA, NP, NA, MP and NS) a single lineage has introgressed into the opposing background and replaced the previous lineage: all currently circulating influenza B viruses have PA, NP, NA and MP segments derived from Yamagata lineage and NS segments derived from Victoria lineage.
Results
Analysis of reassortment patterns across Victoria and Yamagata lineages
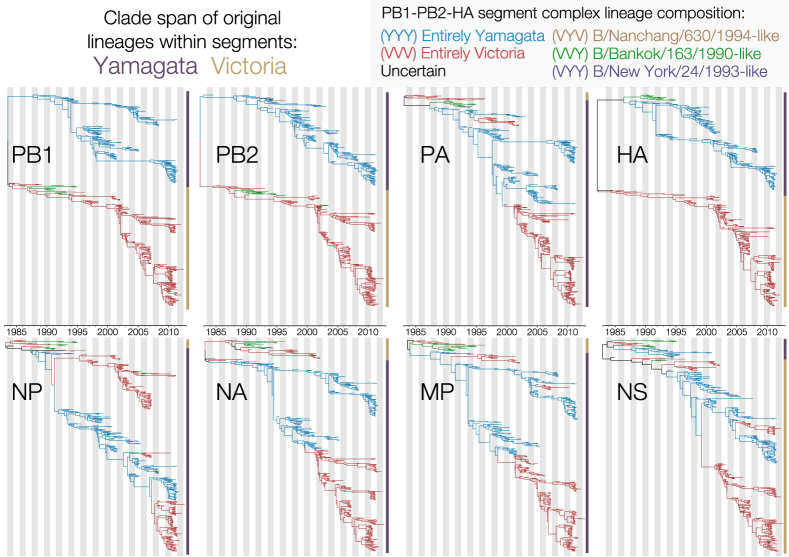
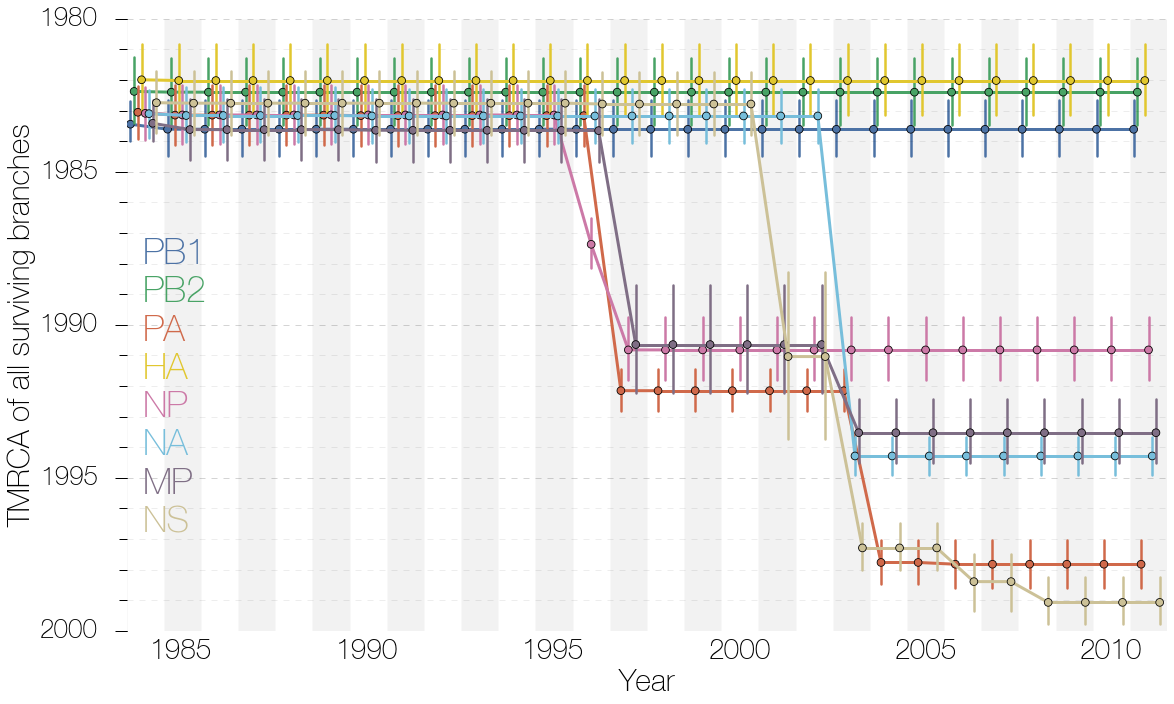
The differentiation into Vic and Yam lineages can be seen in all segments (Figure 2) and is followed by inter-lineage reassortment events. In the phylogenetic trees of the PA, NP, NA, MP and NS segments either the Victoria or Yamagata lineage has become the ‘trunk’ of the tree, with present-day viruses deriving entirely from the Victoria or Yamagata lineage (yellow vs purple bars in Figure 2) following reassortment. However, the Victoria and Yamagata lineages of PB1, PB2 and HA segments continue to co-circulate to this day. Periodic loss of diversity in PA, NP, NA, MP and NS segments is consistent with introgression of one lineage into the other in those segments, while maintenance of parallel Victoria and Yamagata lineages results in continually increasing diversity in segments PB1, PB2 and HA (Figure 3). The PB1, PB2 and HA segments from present-day viruses maintain a common ancestor in 1983 and thus accumulate genetic diversity since the split of those segments into Vic and Yam lineages, while other segments often lose diversity with ancestors to present-day viruses appearing between 1991 and 1999.
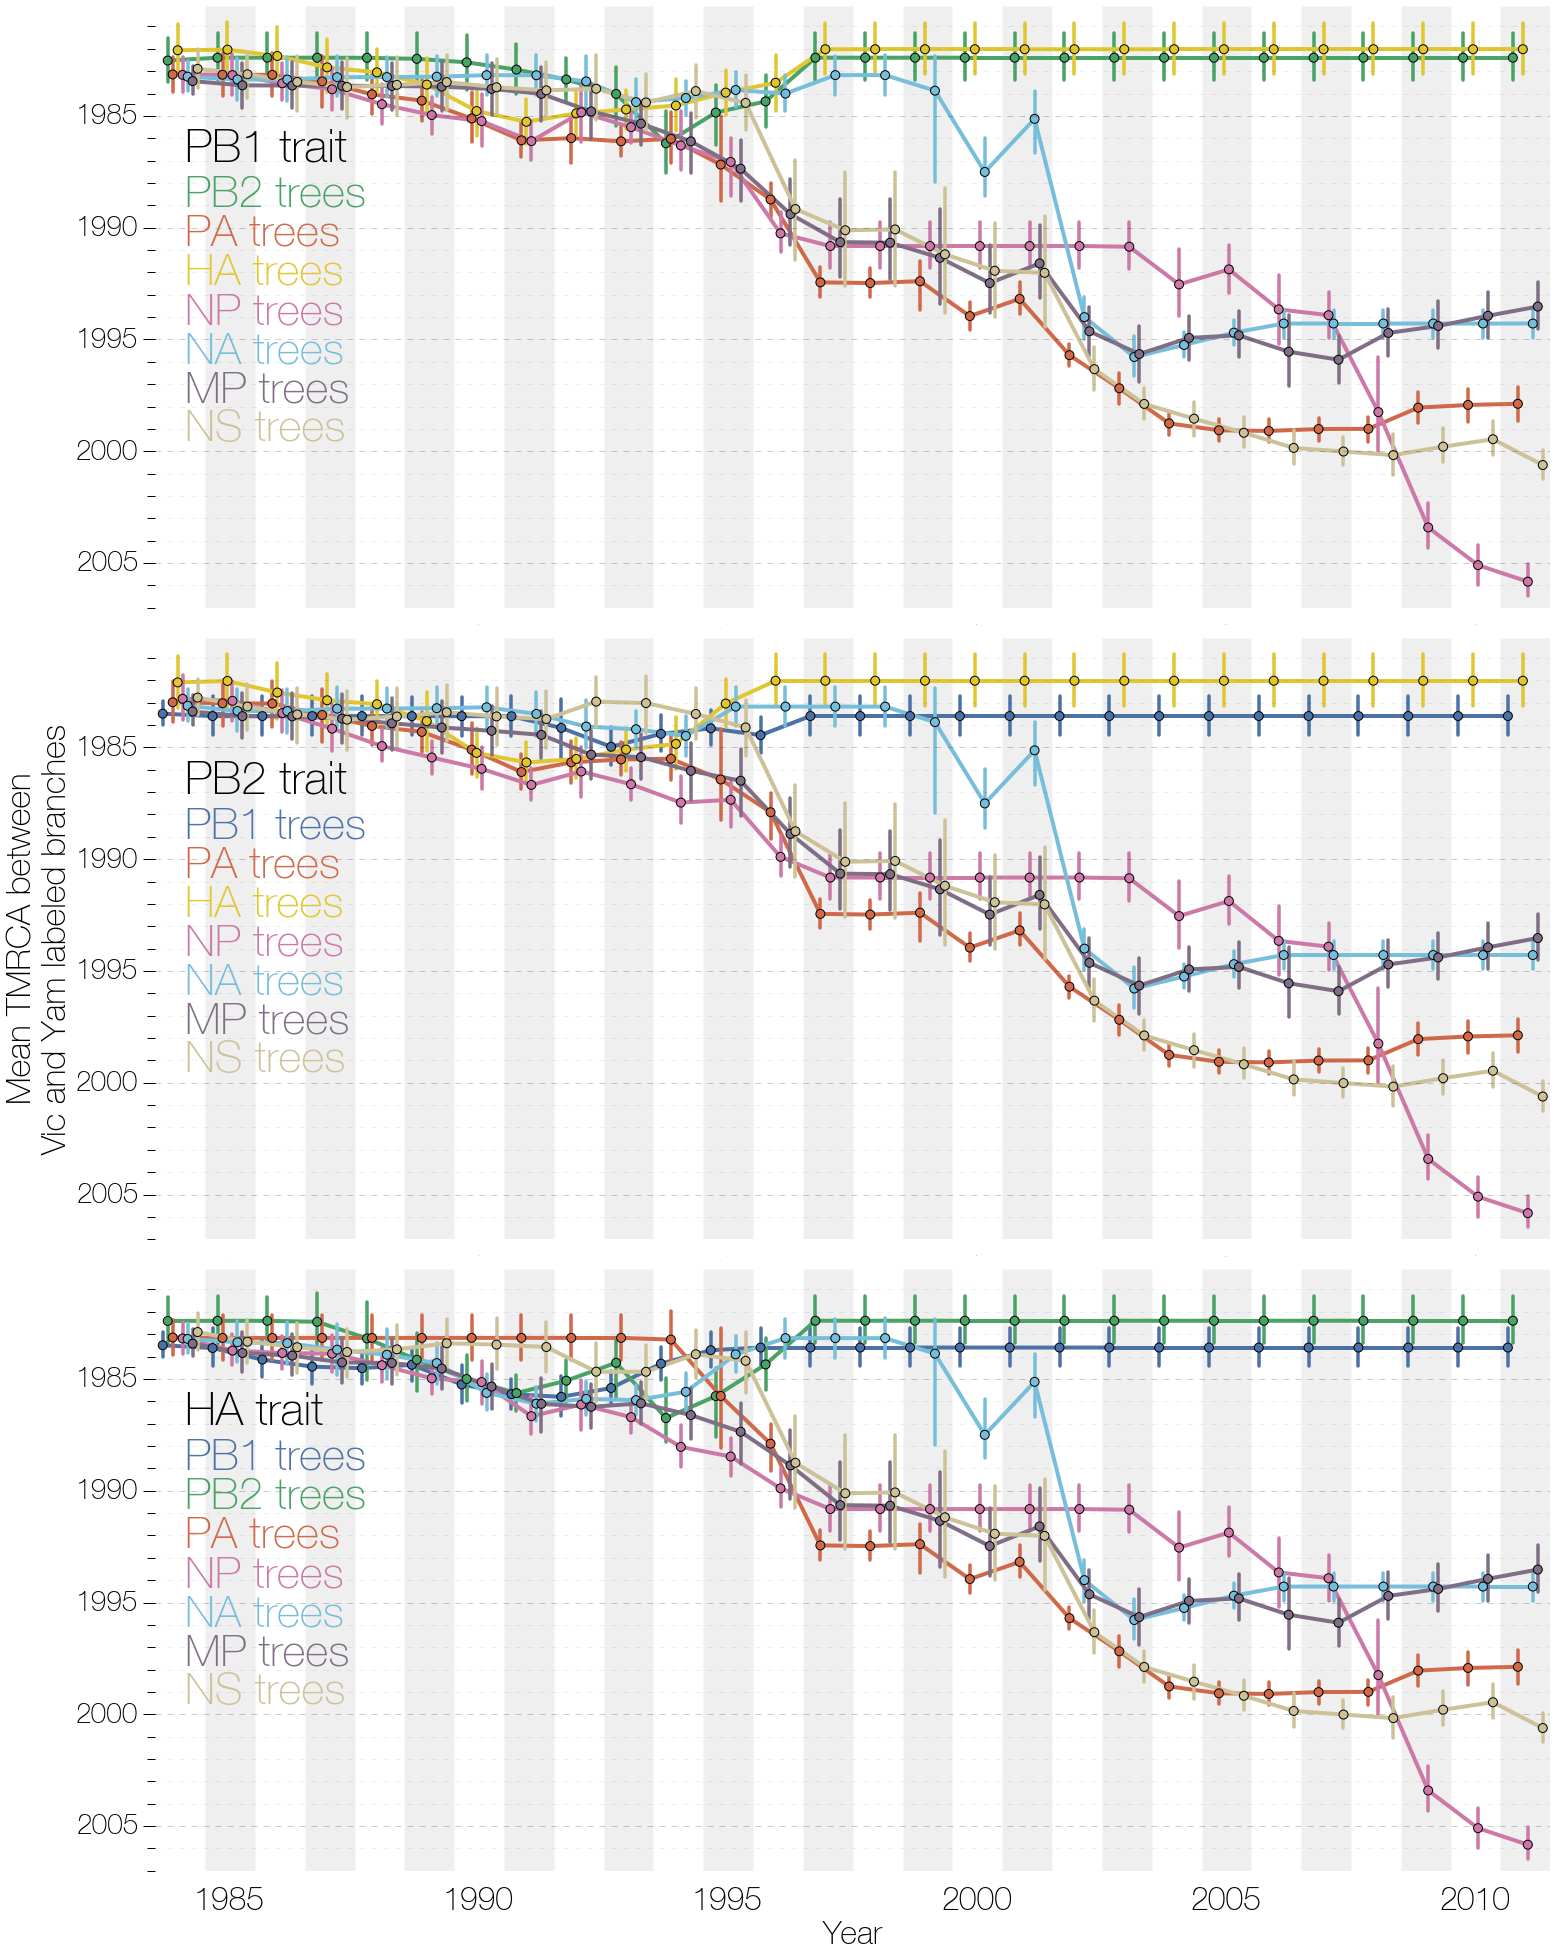
By measuring mean pairwise diversity between branches in each tree that were assigned either a Vic or Yam label in other segments, we look for reductions in between-lineage diversity, which indicate that an inter-lineage reassortment event has taken place (Figure 4). This method gives a quantitative measure of reassortment-induced loss of diversity between Victoria and Yamagata lineages in two trees, although care should be taken when interpreting the statistic, as it does not correspond to any real TMRCAs in the tree, but can be interpreted as mean coalescence date between Vic and Yam lineages of PB1, PB2 and HA segments in all other trees. We focus only on PB1, PB2 and HA lineage labels, since all other segments eventually become completely derived from either the Vic or the Yam lineage. Losses of diversity (represented by more recent mean pairwise TMRCAs between Vic and Yam labels) in Figure 4 indicate that every segment has reassorted with respect to the Victoria and Yamagata lineages of PB1, PB2 and HA segments. However, we also see that the labels for these 3 segments show reciprocal preservation of diversity after 1997. This suggests that after 1997 no reassortment events have taken place between Victoria and Yamagata lineages of PB1, PB2 and HA segments and their lineage labels only ‘meet’ at the root. We do see reduced diversity between Vic and Yam labels of PB1, PB2 and HA segments in a time period close to the initial split of Vic and Yam lineages (1986–1996). These reductions in diversity represent small clades with reassortant PB1-PB2-HA constellations, which go extinct by 1997 (see Figure 2). We also observe that the assignment of these 3 segment labels to branches of other segment trees is very similar and often identical after 1997. This suggests that PB1, PB2 and HA lineage labels switch simultaneously in all trees after 1997.
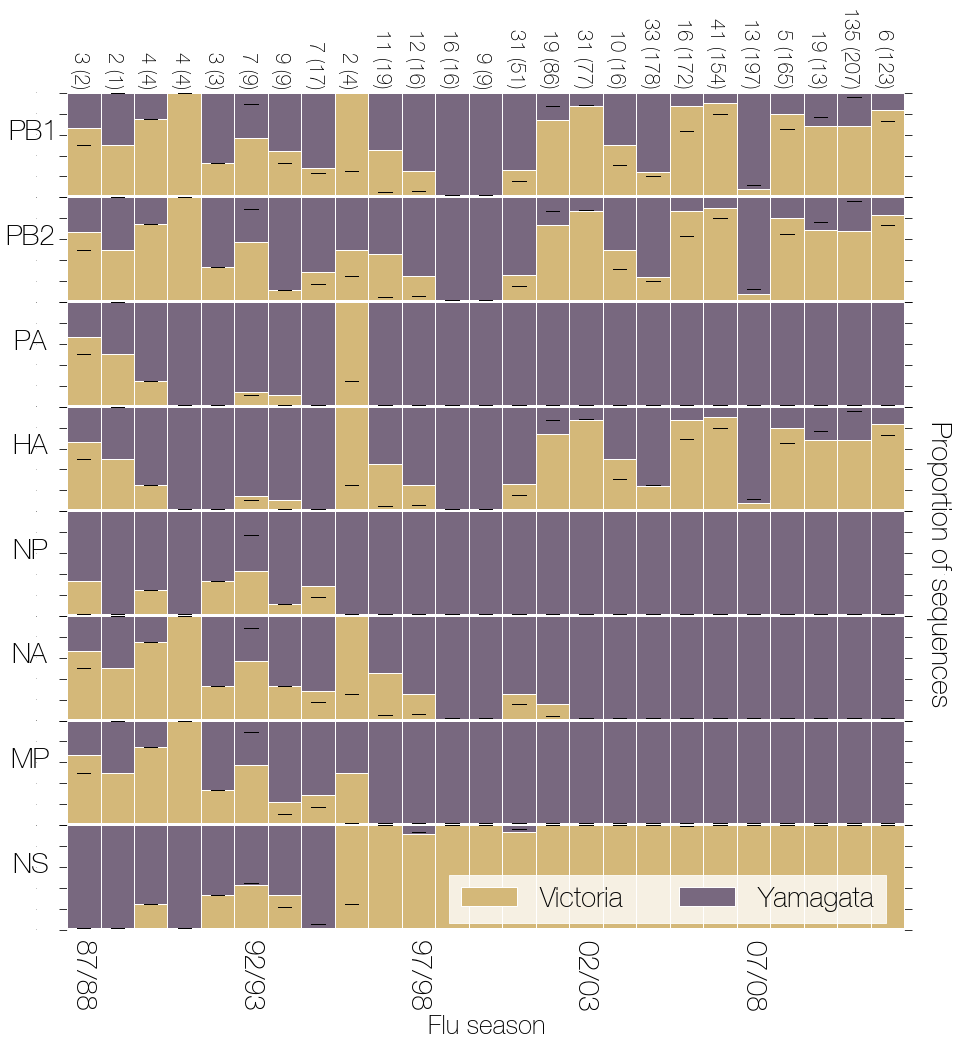
We show the ratio of Vic to Yam sequences in our primary and secondary datasets in different influenza seasons in Figure 5, which is based on which lineage each sequence was assigned to (see Methods). It is evident that losses of diversity in the PA, NP, NA, MP and NS segments are related to either the Vic (NS) or the Yam (PA, NP, NA, MP) lineage replacing the other lineage in the influenza B virus population. Similarly, the lack of reassortment between Vic and Yam lineages and maintenance of diversity of PB1, PB2 and HA can be seen, where the two lineages have been sequenced at a ratio close to 50% over long periods of time (Figure 5). On a year-to-year basis, however, the ratios for Vic and Yam sequences PB1, PB2 and HA can fluctuate dramatically consistent with one lineage predominating within a given season, in agreement with surveillance data (Reed et al., 2012).
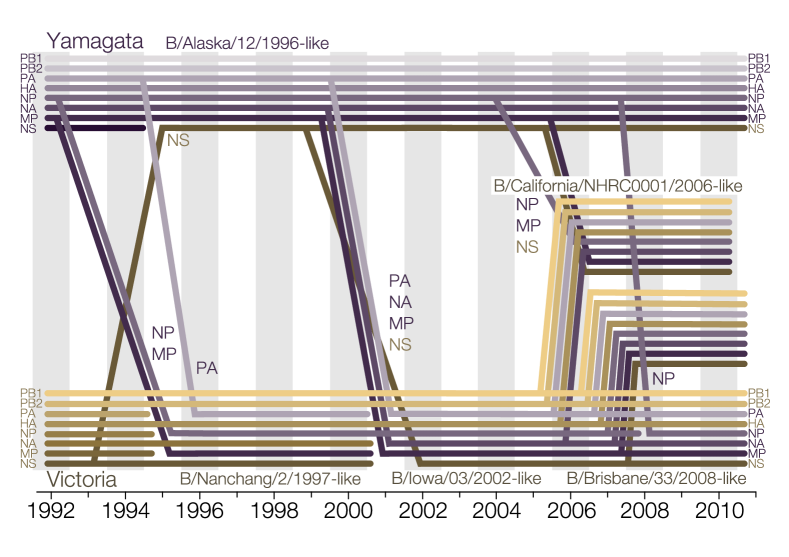
We reconstructed reassortment events that were detected by using lineage labels. Figure 6 focuses only on inter-lineage reassortments that have occurred after 1990. We identify 5 major (in terms of persistence) reassortant genome constellations (given in order PB1-PB2-PA-HA-NP-NA-MP-NS with prime (’) indicating independently acquired segments) circulating between 1992 and 2011 (Figure 6):
-
•
B/Alaska/12/1996-like (Y-Y-Y-Y-Y-Y-Y-V)
-
•
B/Nanchang/2/1997-like (V-V-Y-V-Y-V-Y-V)
-
•
B/Iowa/03/2002-like (V-V-Y’-V-Y-Y-Y’-V’)
-
•
B/California/NHRC0001/2006-like (V-V-Y-V-Y’-Y-Y’-V’)
-
•
B/Brisbane/33/2008-like (V-V-Y-V-Y’-Y-Y-V)
In a previous study B/Alaska/12/1996-like, B/Nanchang/2/1997-like and B/Iowa/03/2002-like constellations were observed Chen and Holmes (2008), but sequences from
B/California/NHRC0001/2006-like and B/Brisbane/33/2008-like constellations were not available at the time.
In their study Chen and Holmes (2008) also recovered the co-assortment pattern of PB1, PB2 and HA lineages, but did not remark upon it.
Of these 5 constellations 4 (B/Nanchang/2/1997-like, B/Iowa/03/2002-like,
B/California/NHRC0001/2006-like and B/Brisbane/33/2008-like) are derived from introgression of Yamagata lineage segments into Victoria lineage PB1-PB2-HA background, with only 1 (B/Alaska/12/1996-like) resulting from introgression of Victoria lineage NS segment into an entirely Yamagata derived background.
All 5 inter-lineage reassortment events described here are marked by the preservation of either entirely Victoria or Yamagata derived PB1-PB2-HA segments.
Figure 6 also shows that reassorting segments appear to evolve with a considerable degree of autonomy.
For example, the NP lineage that entered a largely Victoria lineage derived genome and gave rise to the B/Nanchang/2/1997-like isolates continued circulating until 2010, even though the other segments it co-assorted with in 1995 – 1996 (PA and MP) went extinct following the next round of reassortment that led to the rise of B/Iowa/03/2002-like genome constellations.
A more extreme example is the NS segment, where a Vic sub-lineage was reassorted into an entirely Yam background (B/Alaska/12/1996-like) in 1994–1995, then reassorted back into a mostly Vic background some 5 years later (B/Iowa/03/2002-like) where it has replaced the ‘original’ Vic sub-lineage (see Figure 6).
We observe that in all 5 successful inter-lineage reassortment events shown in Figure 6, none break up the PB1-PB2-HA complex. This is an unlikely outcome – the probability of not breaking up PB1-PB2-HA across 5 reassortment events is , where reassortment events are considered to sample from the Vic and Yam lineages at random for each of the 8 segments. If we correct for multiple testing with the assumption that co-assortment of any 3 segments is of interest we find that the probability of not breaking up an arbitrary set of 3 segments across 5 reassortment events is .
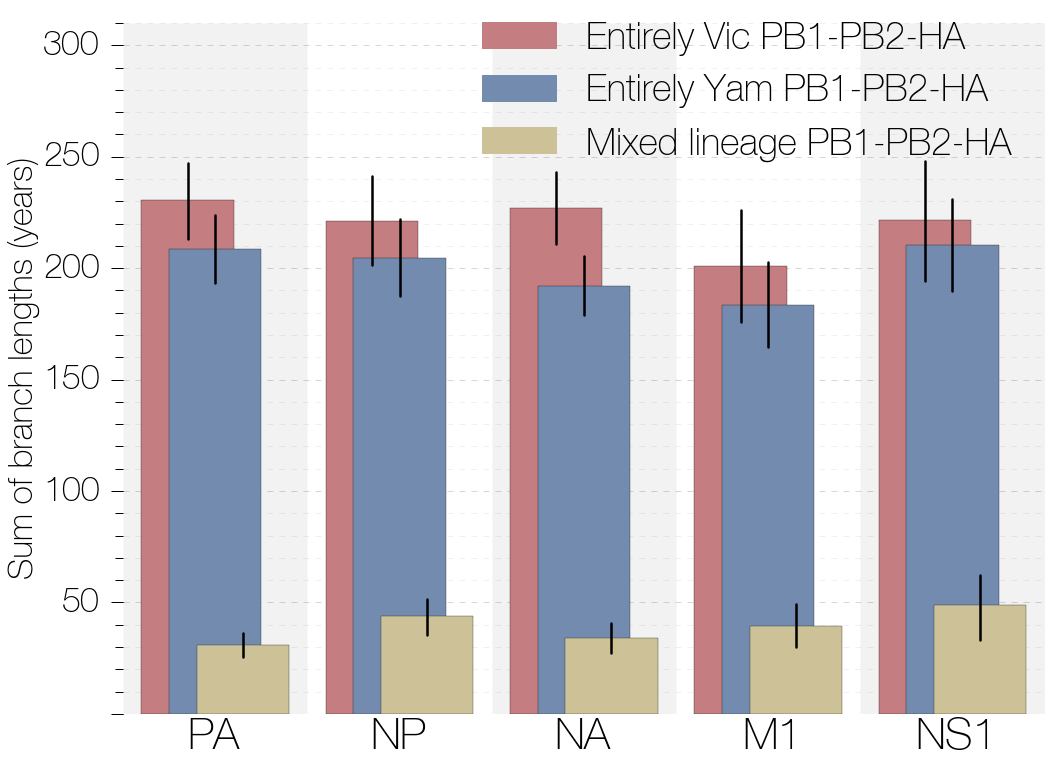
Although the vast majority of influenza B isolates possess either Vic or Yam lineage derived PB1-PB2-HA complexes, on rare occasions mixed-lineage PB1-PB2-HA constellations emerge. Figure 7 shows the sum of branch lengths which were labelled as having entirely Vic, entirely Yam or mixed-lineage PB1, PB2 and HA segments. Due to lack of reassortment between Vic and Yam lineages of PB1, PB2 and HA (Figure 4) since 1997 all segments have spent significantly longer periods of evolutionary time with either entirely Vic-derived or entirely Yam-derived than with mixed-lineage PB1, PB2 and HA constellations (Figure 7). We have identified 3 instances of mixed-lineage PB1-PB2-HA reassortants from the primary dataset with the following PB1-PB2-HA constellations: VVY (B/Bangkok/163/1990-like, 13 sequences isolated 1990 – 5 Jan 1995), VYV (B/Nanchang/630/1994-like, 2 sequences isolated 1994 – 1996) and VYY (B/New York/24/1993-like, 2 sequences isolated 8 Jan 1993 – 1994). We detected two new reassortant lineages when investigating the larger secondary dataset – B/Waikato/6/2005-like viruses with PB1-PB2-HA constellation YYV (17 sequences isolated 9 May – 12 October in 2005) and B/Malaysia/1829782/2007 with PB1-PB2-HA constellation YVY (1 sequence isolated 2 August 2007).
Analysis of reassortment properties
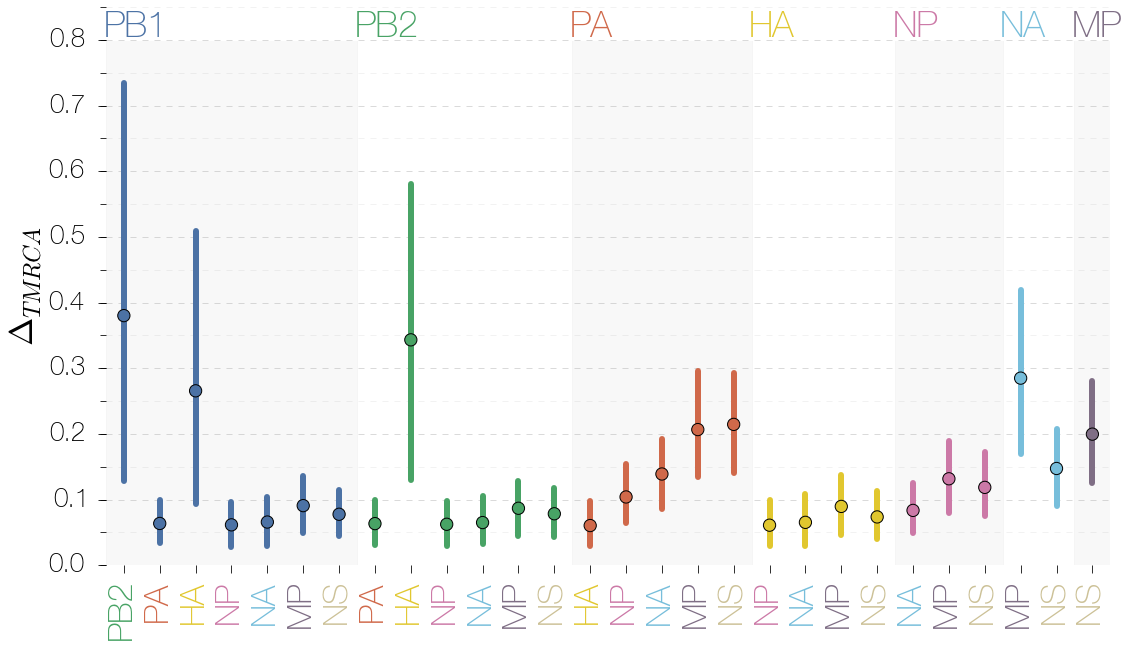
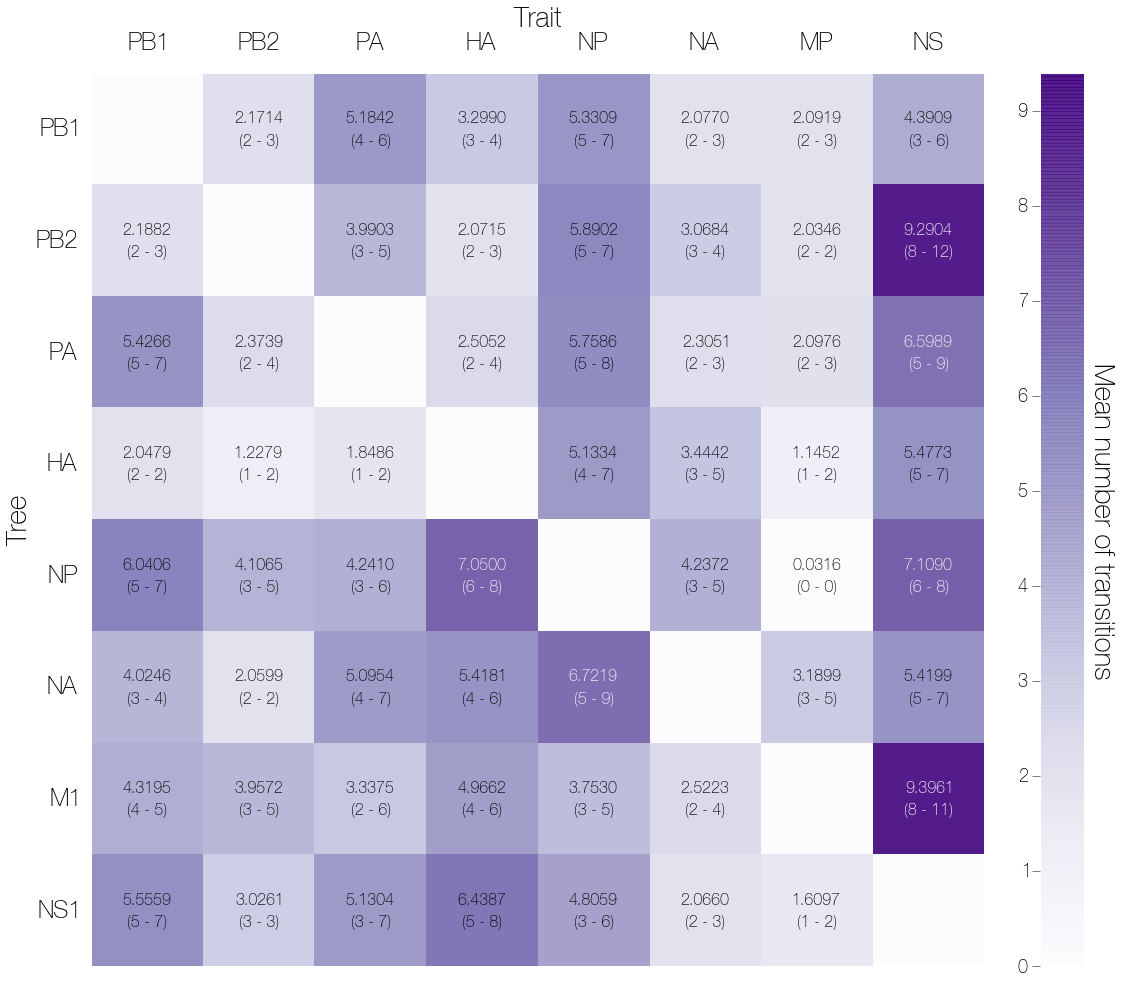
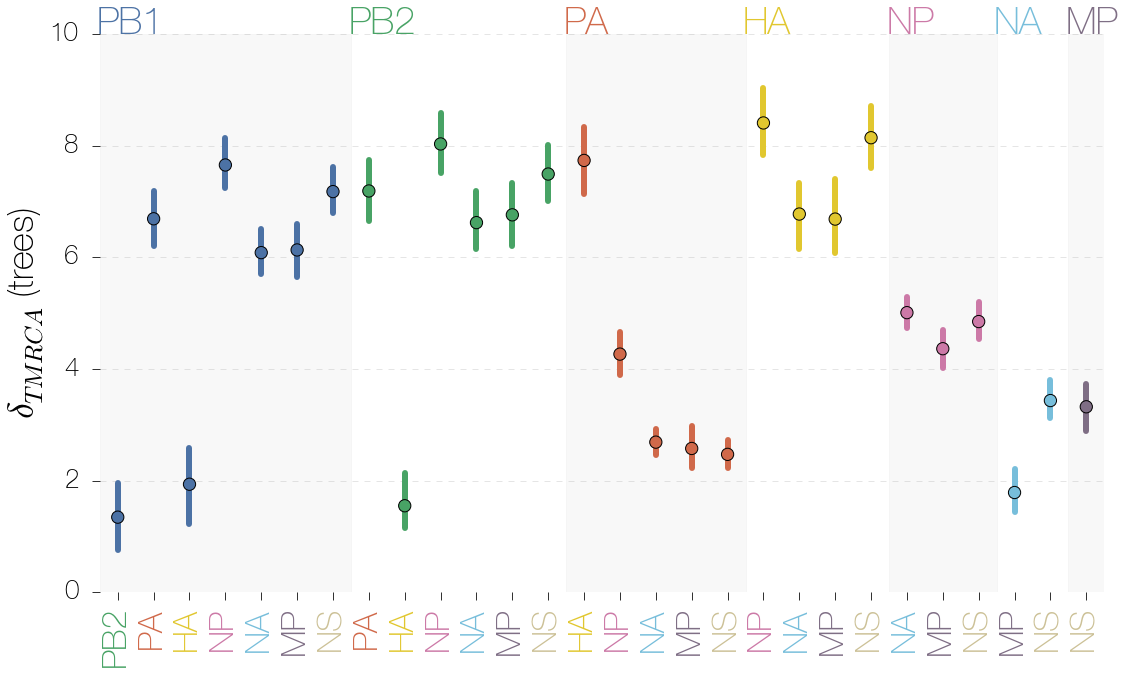
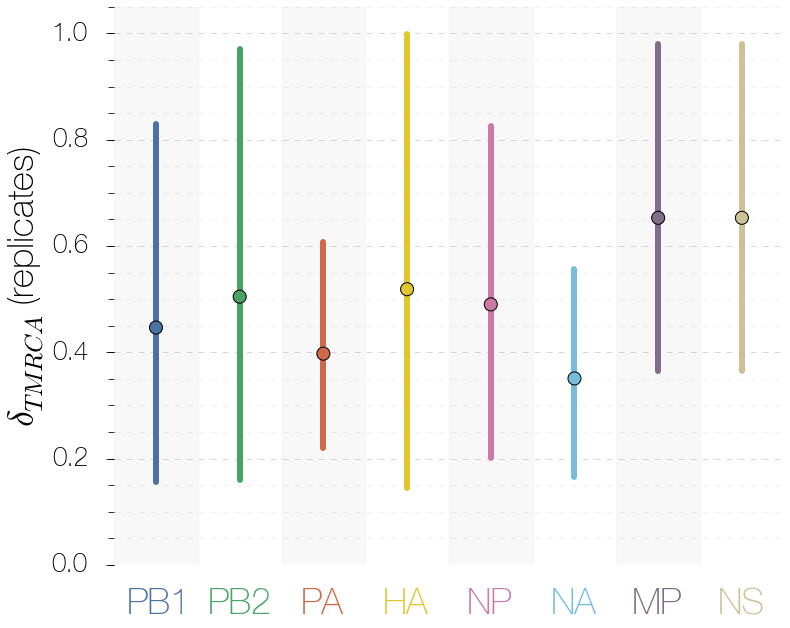
We attempted to quantify the temporal discordance between lineages reassorting into new genomic constellations. If one were able to recover an influenza ‘species tree’, including admixture/reassortment events, it would be possible to estimate the reassortment or recombination ‘distance’, which is the time between a split in the species tree in the past and a reassortment event (see Figure S17). Although we do not find evidence of differences in total number of reassortments between segments (see Supplementary information), we find support for a reassortment ‘distance’ effect, in which a pair of tips on one segment has a different TMRCA from the same pair of tips on a different segment. The summary statistic we use that reflects this difference in TMRCAs, , is most sensitive when only one of the two trees being compared loses diversity via reassortment and the other acts like a proxy for the ‘species tree’. We normalize our comparisons to arrive at , which accounts for uncertainty in tree topology (see Methods). Figure 8 shows values for all pairs of trees. Most segment pairs show very low values for this statistic with , indicating that measurements between replicate posterior samples from the same segment are up to 10 times smaller than values between posterior samples from different segments. PB1, PB2 and HA trees, on the other hand, exhibit values that are much higher. This shows that TMRCA differences between trees of PB1, PB2 and HA segments are, though noisy, occasionally very similar to uncertainty in tip-to-tip TMRCAs between replicate analyses of these segments.
Discussion
Linkage between PB1, PB2 and HA gene segments
In this paper we show that the PB1, PB2 and HA segments of influenza B viruses are the only ones that have continuously maintained separate Vic and Yam lineages, while other segments have fixed either Vic or Yam lineages (Figures 2, 5 and 6). Evidence suggests that this is a result of prolonged lack of reassortment between Vic and Yam lineages in PB1, PB2 and HA (Figure 4) which possess co-assorting sequences detectable as high linkage disequilibrium (Figure S1). The vast majority of the sampled evolutionary history of each segment of influenza B viruses since the split of Vic and Yam lineages has been spent in association with either completely Victoria or completely Yamagata lineage derived PB1-PB2-HA complexes (Figure 7), suggesting that having ‘pure’ lineage PB1-PB2-HA complexes is important for whole-genome fitness. We propose that this pattern of coassortment is due to the action of selection and not simply biased or rare reassortment.
The origin of the strong genetic linkage between PB1, PB2 and HA segments remains unclear. We believe there are two alternative, but similar explanations for the origins of the strong genetic linkage between these segments: mutation-driven co-evolution (Presgraves, 2010) and Dobzhansky-Muller incompatibility (Dobzhansky, 1937; Muller, 1942). Mutation-driven co-evolution (Presgraves, 2010), has been suggested to be the cause of hybrid dysfunction in Saccharomyces hybrids (Lee et al., 2008), and evolves as a by-product of adaptation. If one or the other influenza B lineage has undergone adaptation we might expect these changes to be beneficial in its native background and incompatible with a foreign background. Dobzhansky-Muller incompatibility operates in a similar way, but the main difference from the scenario described earlier is that the incompatible alleles are neutral or nearly neutral in their native background and become deleterious or lethal when combined with non-native backgrounds. Emergence of DM incompatibility is aided by geographic isolation. Interestingly, the Victoria lineage of HA was restricted to eastern Asia between 1992 and 2000 (Nerome et al., 1998; Shaw et al., 2002), offering ample time for the budding Victoria lineage to accumulate alleles causing reassortment incompatibility. However, without more genomic data from the past, it is difficult to estimate to what extent influenza B virus population structure contributed to the development of the current segment linkage.
Potential mechanisms for reassortment incompatibility
Unfortunately, the limited amount of genomic data available for the early years of the Vic–Yam split precludes any attempts of answering whether selection or drift have led to the current linkage of PB1, PB2 and HA segments. Although the origins of the linkage between these three segments might be difficult to explain, we can speculate on the nature of reassortment incompatibility. For example, it is intuitive for why this might be the case for PB1 and PB2: both proteins interact directly as part of the RNA-dependent RNA polymerase heterotrimer. Indeed, we observe that PB1–PB2 reassortants are the rarest and least persistent among mixed-lineage PB1-PB2-HA strains and have not been isolated in great numbers. In fact most reassortants breaking the PB1-PB2-HA complex apart have occured in the past, close to the split of Vic and Yam lineages and have become very rare since.
There is some evidence that the linkage between PB1 and HA might not be a phenomenon restricted to influenza B viruses. It has been established that at least for the 1957 and the 1968 influenza pandemics, caused by A/H2N2 and A/H3N2 subtypes, respectively, the viruses responsible were reassortants possessing PB1 and HA segments derived from avian influenza A viruses (Kawaoka et al., 1989). In addition, outdated techniques for producing vaccine seed strains through selection for HA-NA reassortants often yielded PB1-HA-NA reassortants as a side-effect (Bergeron et al., 2010; Fulvini et al., 2011). Recent experiments have found that the presence or absence of a ‘foreign’ PB1 segment can have dramatic effects on HA concentration on the surface of virions and total virion production (Cobbin et al., 2013). However, there have been reassortant influenza A viruses circulating for prolonged periods of time in humans that did have disparate PB1 and HA segments, e.g. H1N2 outbreaks in 2001 (Gregory et al., 2002) and H1N1/09 in 2009 (Smith et al., 2009).
We believe that the association between PB1, PB2 and HA segments should be relatively straightforward to explore in the lab. Reverse genetics systems have been developed for influenza B viruses (Hoffmann et al., 2002), which would allow the creation of artificial reassortants. Based on the frequency and persistence times of different reassortant classes we have observed, we expect a hierarchy of reassortant fitness starting with PB1+PB2+HA reassortants which should be the most fit, followed by PB1+2/HA, then PB1+HA/PB2 and finally PB2+HA/PB1 reassortants with the lowest fitness. We believe that this is the most direct approach to unravelling the mechanism responsible for the linkage within the PB1-PB2-HA complex.
Will influenza B viruses speciate?
We suggest that the preservation of two PB1-PB2-HA complex lineages is similar to genomic speciation islands, where small numbers of genes resist being homogenized through gene flow (Turner et al., 2005). In this context, we see three potential paths of evolution for influenza B viruses. If more segments get recruited to the PB1-PB2-HA complex, the process could continue until ‘speciation’ occurs in which none of the segments are able to reassort across the Victoria–Yamagata lineage boundary. Alternatively, the influenza B genome could continue to be homogenized via gene flow with the exception of PB1, PB2 and HA segments or one of the two PB1-PB2-HA complexes could go extinct, marking the return of single-strain dynamics in the influenza B virus population. The eventual fate of influenza B viruses will likely be determined by the combined effects of reassortment frequency and the strength of epistatic interactions between segments.
Methods
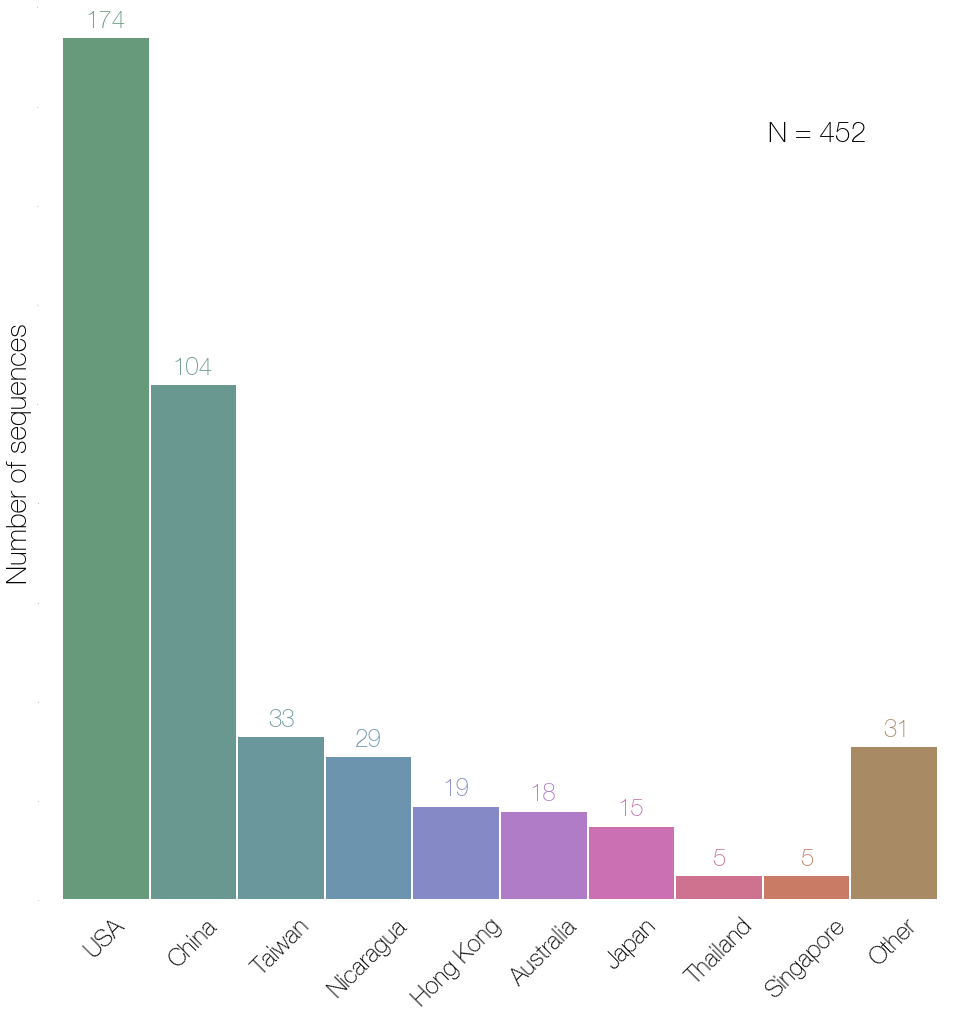
We compiled a primary dataset of 452 complete influenza B genomes from GISAID (Bogner et al., 2006) dating from 1984 to 2012. The longest protein coding region of each segment was extracted and used for all further analyses. We thus assume that homologous recombination has not taken place and that the evolutionary history of the whole segment can be inferred from the longest coding sequence in the segment. To date there has been little evidence of homologous recombination in influenza viruses (Chare et al., 2003; Boni et al., 2008; Han et al., 2010). The segments of each strain were assigned to either Vic or Yam lineage by making maximum likelihood trees of each segment using PhyML (Guindon and Gascuel, 2003) and identifying whether the isolate was more closely related to B/Victoria/2/87 or B/Yamagata/16/88 sequences in that segment, with the exception of the NS segment since B/Victoria/2/87 was a reassortant and possessed a Yam lineage NS (Lindstrom et al., 1999). B/Czechoslovakia/69/1990 was considered as being representative of Victoria lineage for the NS segment. Every segment in each genome thus received either a Vic or a Yam lineage designation, for example the strain B/Victoria/2/87 received V-V-V-V-V-V-V-Y, since its NS segment is derived from the Yam lineage and the rest of the genome is Vic.
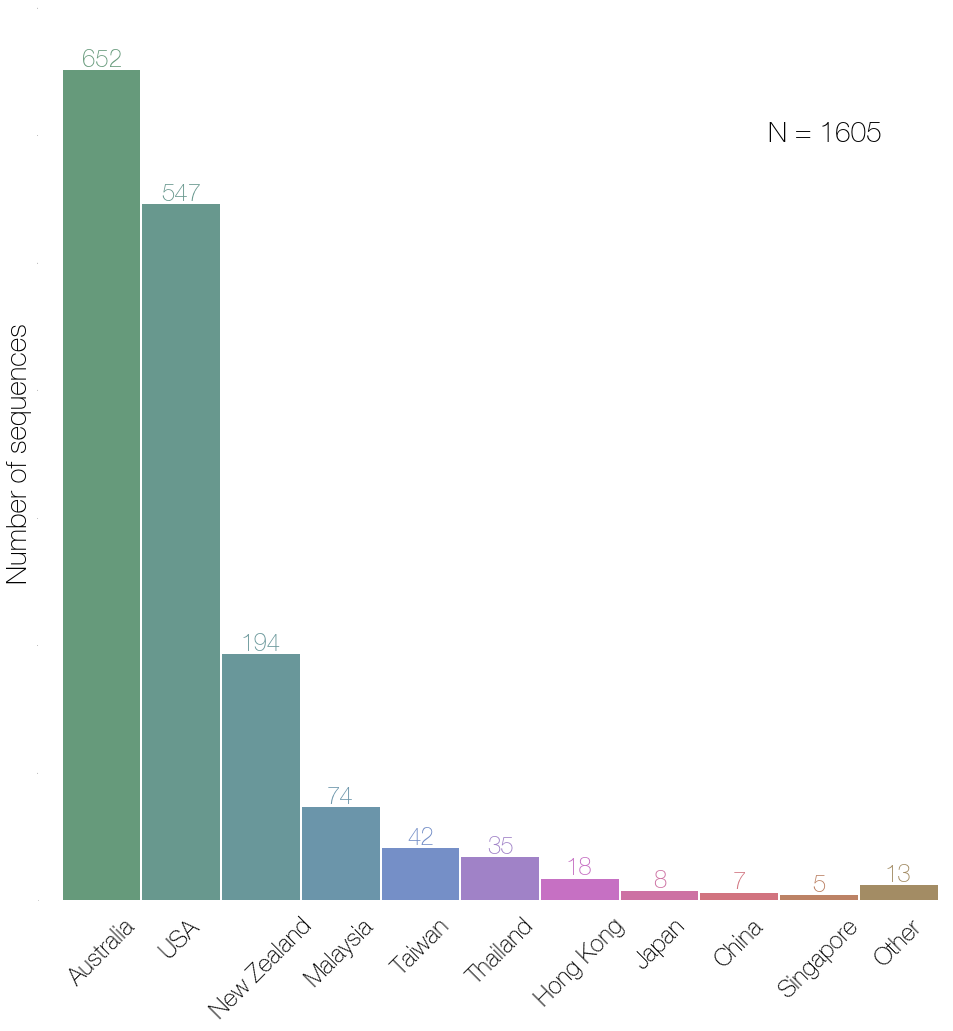
We also collated a secondary dataset from all complete influenza B virus genomes available on GenBank as of May 5, 2014. After removing isolates that had considerable portions of any sequence missing, were isolated prior to 1980 or were suspected of having a contaminant sequence in any segment, we were left with 1603 sequences. This dataset only became available after all primary analyses were performed, are mainly from Australia, New Zealand and the United States and are too numerous to analyze in BEAST (Drummond et al., 2012). PhyML (Guindon and Gascuel, 2003) was used to produce phylogenies of each segment and the lineage of each isolate was determined based on grouping with either B/Victoria/2/87 or B/Yamagata/16/88 sequences, as described above. By associating strains with lineage identity of each of their segments, we reconstructed the most parsimonious inter-lineage reassortment history for the secondary dataset. The secondary dataset was used to check how representative the primary dataset was, to estimate LD and to broadly confirm our results. All analyses pertain to the primary dataset unless stated otherwise.
Temporally-calibrated phylogenies were recovered for each segment in the primary dataset using Markov chain Monte Carlo (MCMC) methods in the BEAST software package (Drummond et al., 2012). We modeled the substitution process using the HKY model of nucleotide substitution (Hasegawa et al., 1985), with separate transition models for each of the 3 codon partitions, and additionally estimated realized synonymous and non-synonymous substitution counts (O’Brien et al., 2009). We used a flexible Bayesian skyride demographic model (Minin et al., 2008). We accounted for incomplete sampling dates for 94 sequences (of which 93 had only year and 1 had only year and month of isolation) whereby tip date is estimated as a latent variable in the MCMC integration. A relaxed molecular clock was used, where branch rates are drawn from a lognormal distribution (Drummond et al., 2006). We ran 3 independent MCMC chains, each with 200 million states, sampled every 20,000 steps and discarded the first 10% of the MCMC states as burn-in. After assessing convergence of all 3 MCMC chains by visual inspection using Tracer (Rambaut, A. and Suchard, M. and Drummond, A., 2009), we combined samples across chains to give a total of 27,000 samples from the posterior distribution of trees.
Every sequence was assigned 7 discrete traits in BEAUti corresponding to the lineages of all other segments with which a strain was isolated e.g. PB1 tree had PB2, PA, HA, NP, NA, MP and NS as traits and V or Y as values for each trait. We inferred the ancestral state of lineages in each segment by modelling transitions between these discrete states using an asymmetric transition matrix (Lemey et al., 2009) with Bayesian stochastic search variable selection (BSSVS) to estimate significant rates. Because the posterior set of trees for a single segment has branches labelled with the inferred lineage in the remaining 7 segments, we can detect inter-lineage reassortments between pairs of segments by observing state transitions, i.e. Yam to Vic or Vic to Yam (Figure 1). In addition, by reconstructing the ancestral state of all other genomic segments jointly we can infer co-reassortment events when more than one trait transition occurs on the same node in a tree. Inter-phylogeny labeling approaches have been extensively used in the past to investigate reticulate evolution in influenza A viruses and HIV (Lycett et al., 2012; Ward et al., 2013; Lu et al., 2014).
Measures of diversity
We inferred the diversity of each segment from their phylogenetic tree by estimating the date of the most recent common ancestor of all branches at yearly time points, which places an upper bound on the maximum amount of diversity existing at each time point. A version of this lineage turnover metric has previously been used to investigate the tempo and strength of selection in influenza A viruses during seasonal circulation (Bedford et al., 2011). In addition, we calculated mean pairwise time of most recent common ancestor (TMRCA) between branches labelled as Vic and Yam for PB1, PB2 and HA traits. This gave us a measure of how much a particular segment reassorts with respect to Vic and Yam lineages of PB1, PB2 and HA segments. If Vic and Yam lineages of PB1, PB2 and HA segments were to be considered as being separate populations this measure would be equivalent to ‘between population’ diversity.
We also calculated the total amount of sampled evolutionary time spent by each segment with entirely Vic, entirely Yam or mixed lineage PB1, PB2 and HA segments. We do this by summing the branch lengths in each tree under 3 different lineage combinations of the PB1, PB2 and HA segments: PB1-PB2-HA derived entirely from Yamagata lineage, PB1-PB2-HA entirely derived from Victoria lineage and PB1-PB2-HA derived from a mixture of the two lineages. This gives a measure of how successful, over long periods of time, each particular PB1-PB2-HA constellation has been.
Tree to tree similarities
We express the normalized distance between trees belonging to two segments and for a particular posterior sample , following
| (1) |
where and is the total number of pairwise comparisons available between sets of tips. Thus, is the absolute difference in TMRCA of a pair of tips , where the pair is drawn from the ith posterior sample of tree and the ith posterior sample of tree . Additionally, is calculated from the ith posterior sample of tree A and ith posterior sample of an independent analysis of tree (which we refer to as ), which is used in the normalization procedure to control for variability in tree topology stability over the course of the MCMC chain (see Figures S15 and S16). We had 3 replicate analyses of each segment and in order to calculate we used analyses numbered 1, 2 and 3 as and analyses numbered 2, 3 and 1 as , in that order. We subsampled our combined posterior distribution of trees to give a total of 2,700 trees on which to analyze .
Calculating the normalized for each MCMC state provides us with a posterior distribution of this statistic allowing specific hypotheses regarding similarities between the trees of different segments to be tested. Our approach exploits the branch scaling used by BEAST (Drummond et al., 2012), since the trees are scaled in absolute time and insensitive to variation in nucleotide substitution rates between segments, allowing for direct comparisons between TMRCAs in different trees. In the absence of reassortment we expect the tree of every segment to recapitulate the ‘virus tree’, a concept analogous to ‘species trees’ in population genetics. Our method operates under the assumption that the segment trees capture this ‘virus tree’ of influenza B viruses quite well. It is not an unreasonable assumption, given the seasonal bottlenecks influenza viruses experience. This makes it almost certain that influenza viruses circulating at any given time point are derived from a single genome that existed in the recent past. The statistic essentially quantifies the temporal distance between admixture events and nodes in the ‘virus tree’ (see Figure S17). We normalize values to get , a measure which quantifies the extent to which the similarity of two independent trees resembles phylogenetic noise. The statistic is an extension of patristic distance methods and has previously been used to tackle a wide variety of problems, as phylogenetic distance in predicting viral titer in Drosophila infected with viruses from closely related species (Longdon et al., 2011) and to assess temporal incongruence in a phylogenetic tree of amphibian species induced by using different calibrations (Ruane et al., 2011).
Linkage disequilibrium across the influenza B genome
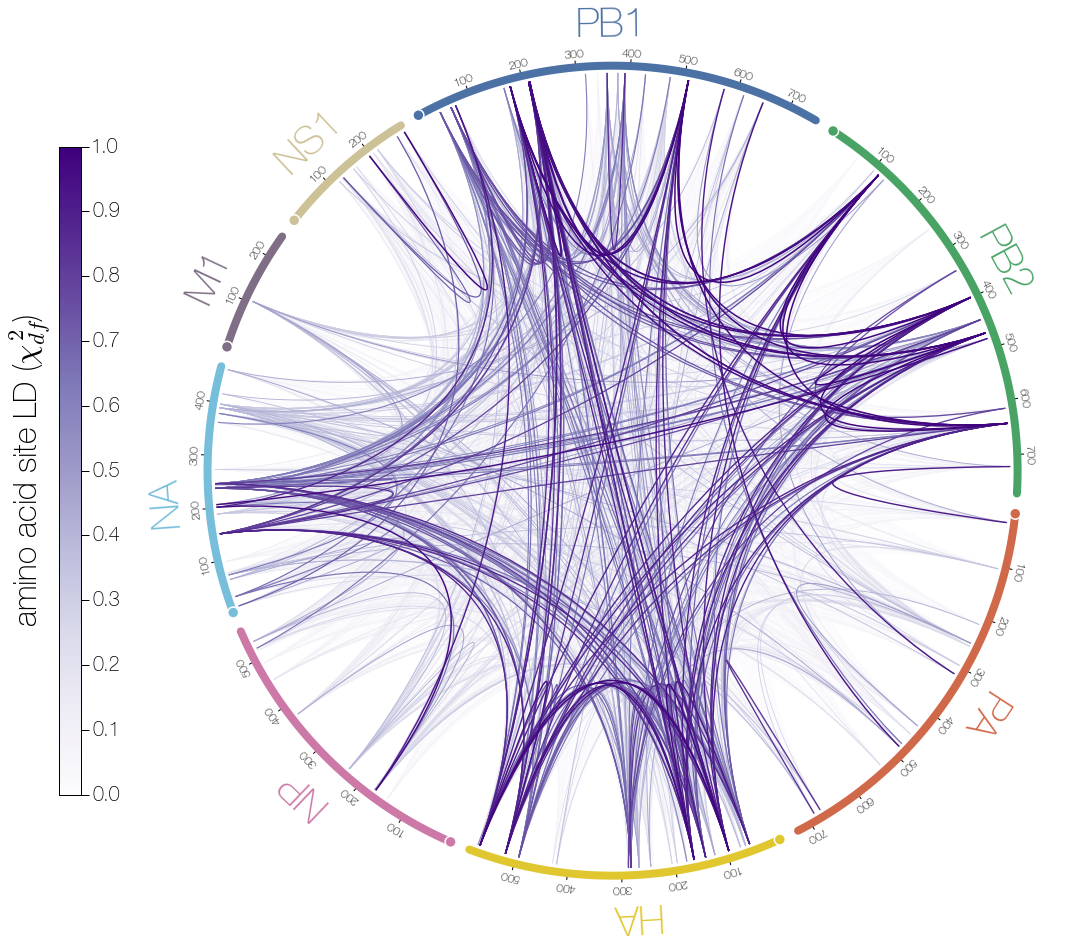
We used the secondary GenBank dataset with 1603 complete genome sequences to estimate linkage disequilibrium (LD) between amino acid loci across the longest proteins encoded by each segment of the influenza B virus genome. To quantify LD we adapt the statistic from (Hedrick and Thomson, 1986):
| (2) |
where is calculated from a classical contingency table, is the number of haplotypes and are the degrees of freedom. This statistic is equal to the widely used LD statistic at biallelic loci, but also quantifies LD when there are more than two alleles per locus (Zhao et al., 2005). LD was estimated only at loci where each nucleotide or amino acid allele was present in at least two isolates. We ignored gaps in the alignment and did not consider them as polymorphisms. In all cases we used a minor allele frequency cutoff of 1%. We also calculated another LD statistic, (Lewontin, 1964) as , where and
| (3) |
where is the frequency of allele at locus A, is the frequency of allele at locus B and is the frequency of haplotype . is inflated when some haplotypes are not observed e.g. when the minor allele frequency is low. We find that is almost uniformly high across the influenza B virus genome and close to 1.0 for almost any pair of polymorphic loci. This is because most amino acid alleles in the population exist transiently, meaning that they do not get a chance to reassort and we only observe them within the backgrounds of more persistent alleles, which quantifies as complete LD. We think that metrics related to , like , perform much better on temporal data such as ours in finding persistent associations between alleles and are easier to interpret.
Data availability
Python scripts used to process trees and sequences are available at:
https://github.com/evogytis/fluB/tree/master/scripts.
Output files from scripts, lineage designations, MCC trees, acknowledgment tables, accession numbers and redacted XML files (per GISAID Data Access Agreement) are publicly available at:
https://github.com/evogytis/fluB/tree/master/data.
Acknowledgements
We would like to thank Darren Obbard and Paul Wikramaratna for helpful discussions and anonymous reviewers for comments and suggestions. GD was supported by a Natural Environment Research Council studentship D76739X. TB was supported by a Newton International Fellowship from the Royal Society. The research leading to these results has received funding from the European Research Council under the European Community’s Seventh Framework Programme (FP7/2007-2013) under Grant Agreement no. 278433-PREDEMICS and ERC Grant agreement no. 260864. AR and SL acknowledge the support of the Wellcome Trust (grant no. 092807).
Supplemental information:
Reassortment between influenza B lineages and the emergence of a co-adapted PB1-PB2-HA gene complex
Confirmation of primary findings
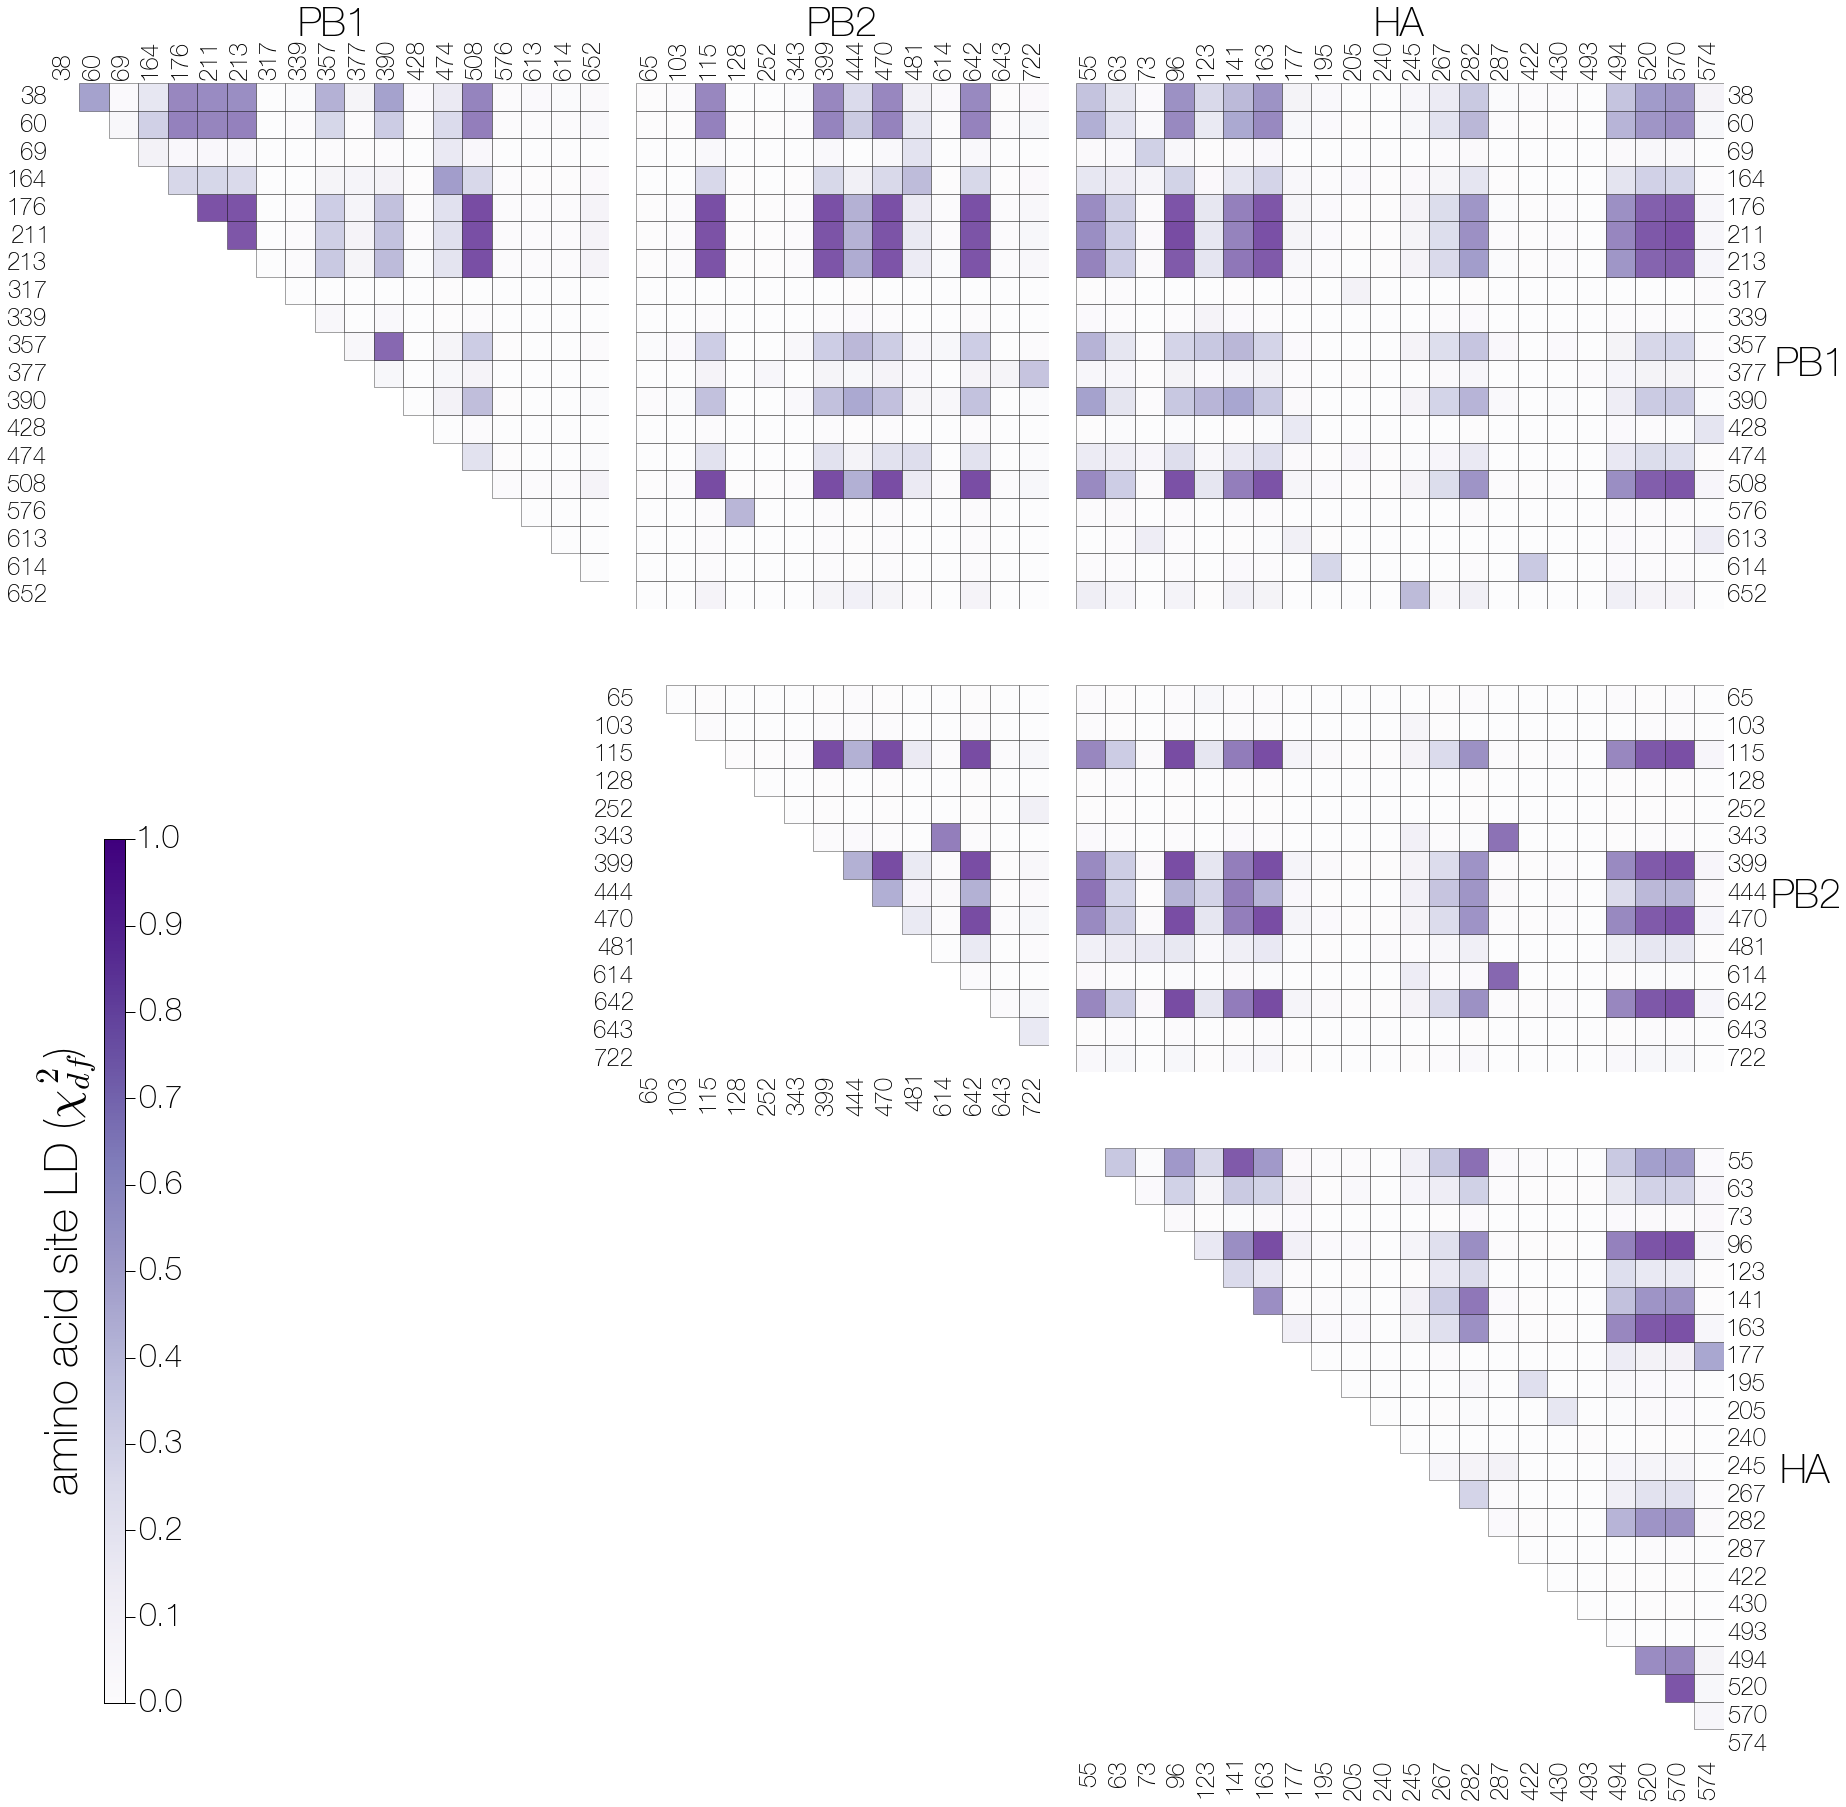
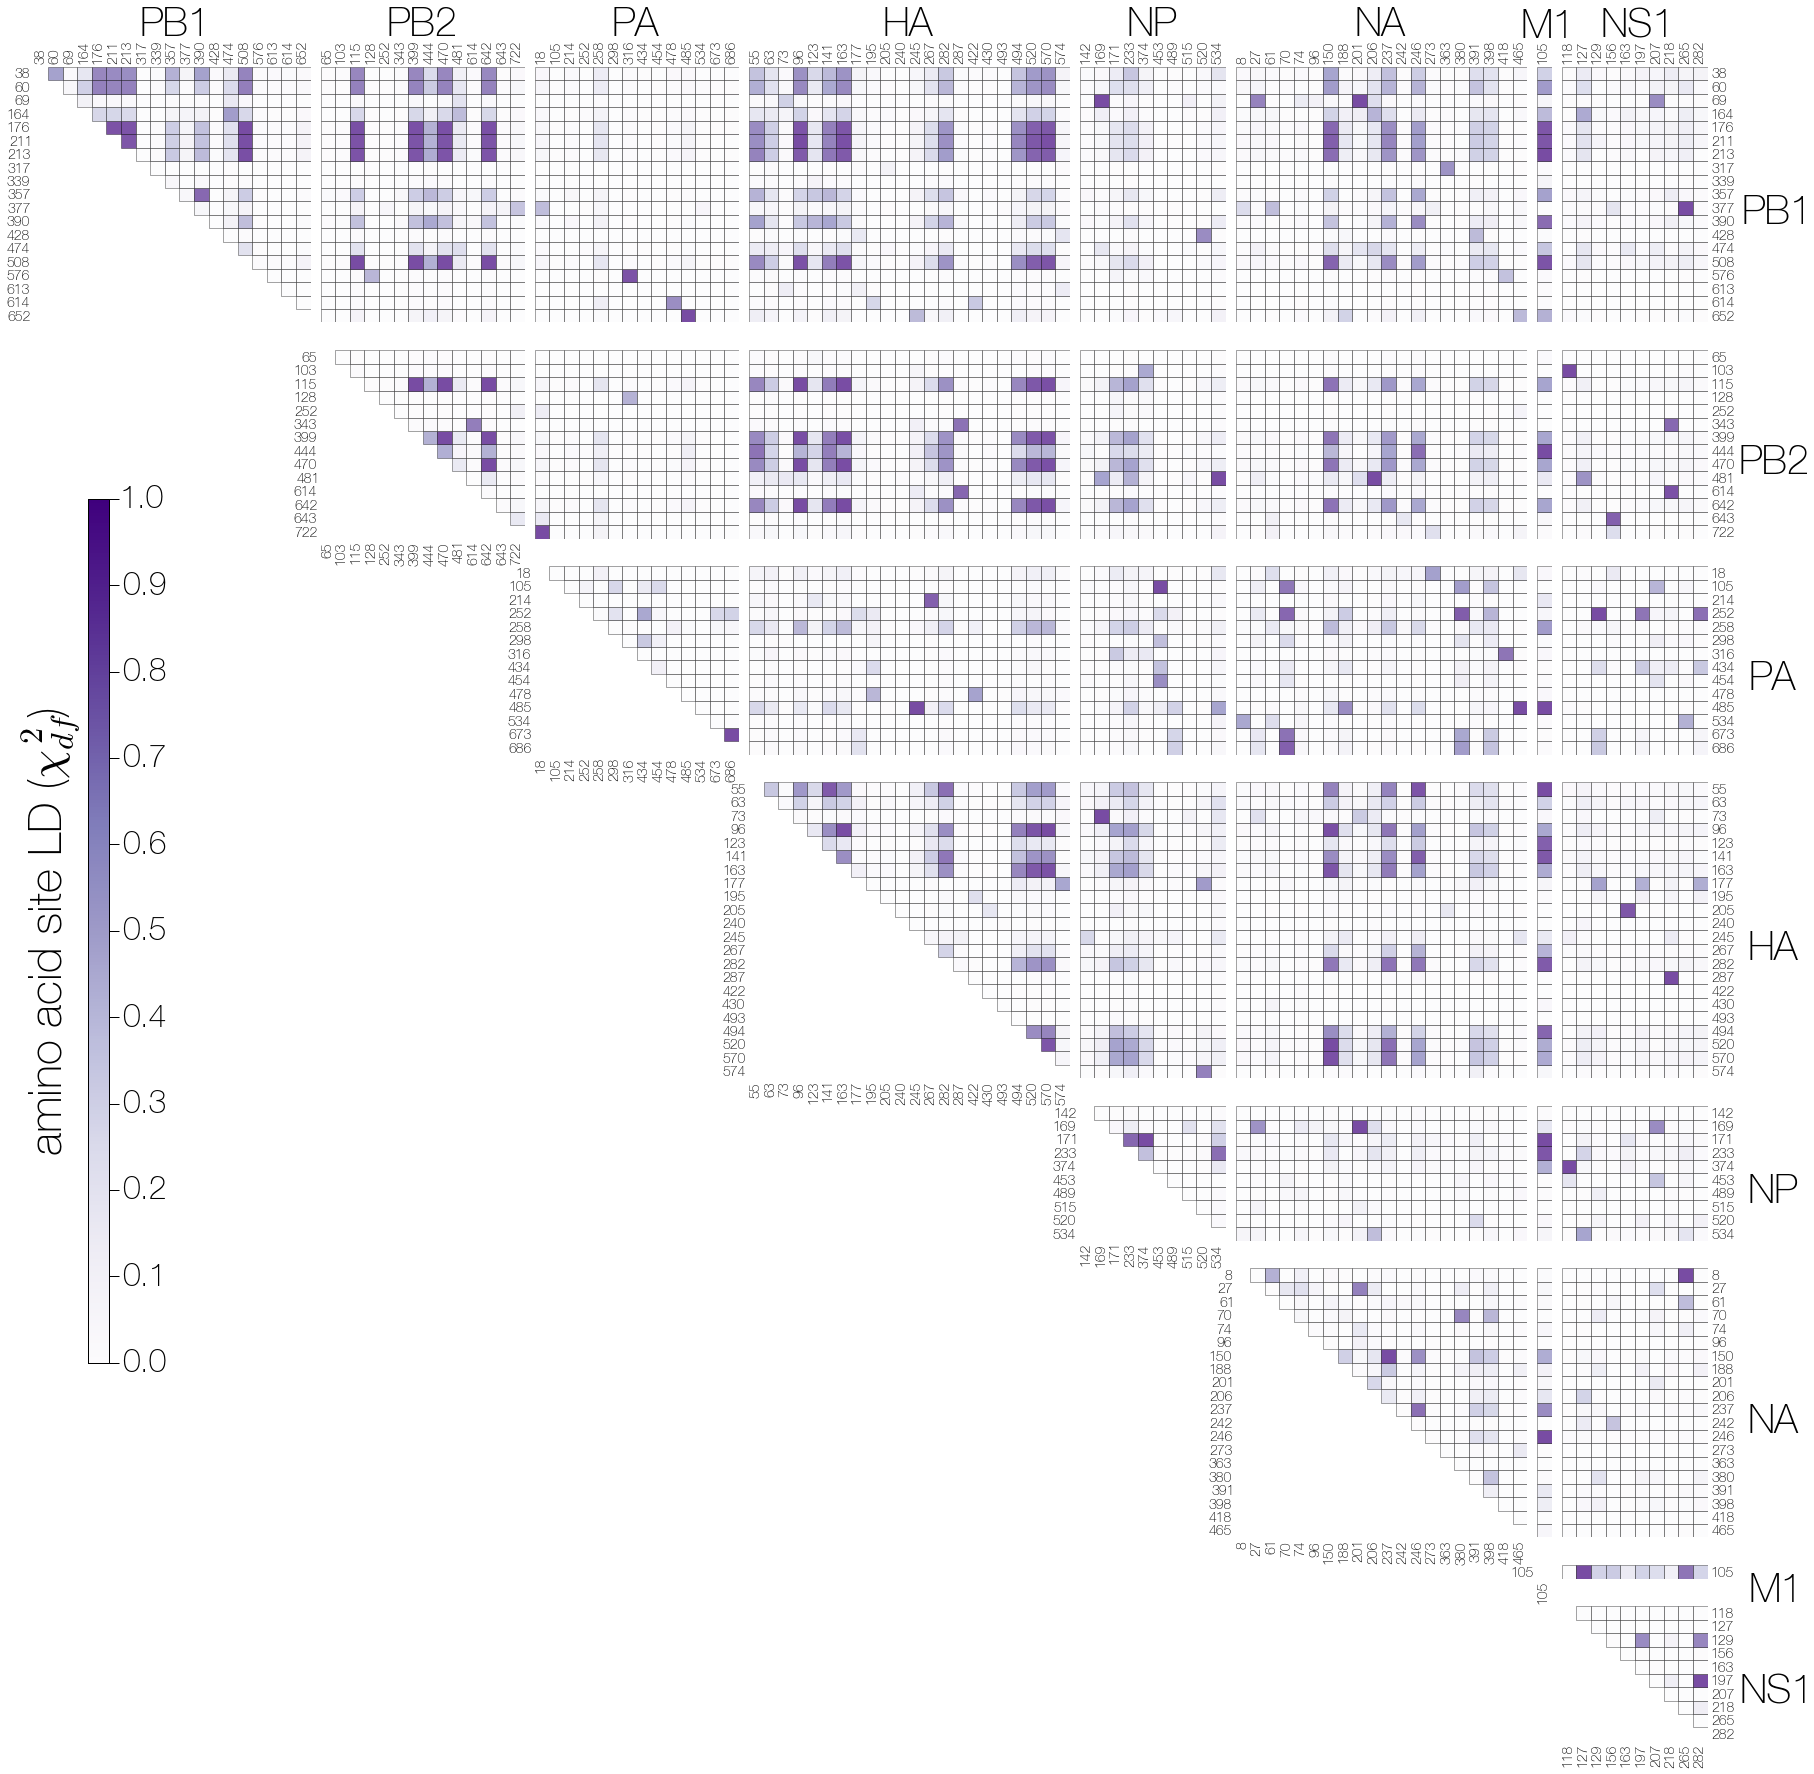
We sought to confirm our findings through measurement of linkage disequilibrium (LD), a measure of non-random association between polymorphic loci within a population. We estimated LD directly from haplotype frequencies at polymorphic amino acid sites (see Methods) in the secondary dataset, thereby avoiding phylogenetic reconstruction or Vic/Yam lineage assignment. We observe greater amino acid LD values between PB1, PB2 and HA than between other pairs of segments (Figure S1) in a large secondary dataset. This suggests that PB1, PB2 and HA segments possess a considerable number of co-assorting non-synonymous alleles, which upon closer inspection are associated with either Vic or Yam lineage segments. We conclude that Victoria and Yamagata lineages of PB1, PB2 and HA have accumulated lineage-specific amino acid substitutions. Of the amino acid sites that exhibit high LD on PB1, PB2 and HA proteins, there are 4 sites on PB1, 4 on PB2 and 4 on HA proteins which form a network of sites exhibiting high LD (Figures S3 and S2). These sites define the split between Vic and Yam lineages within PB1, PB2 and HA segments. In addition, there are sites on PB1, PB2, HA and NA proteins which also show high, albeit smaller, LD which correspond to sites which have undergone amino acid replacements some time after the Vic/Yam split.
Analysis of within-lineage reassortment patterns
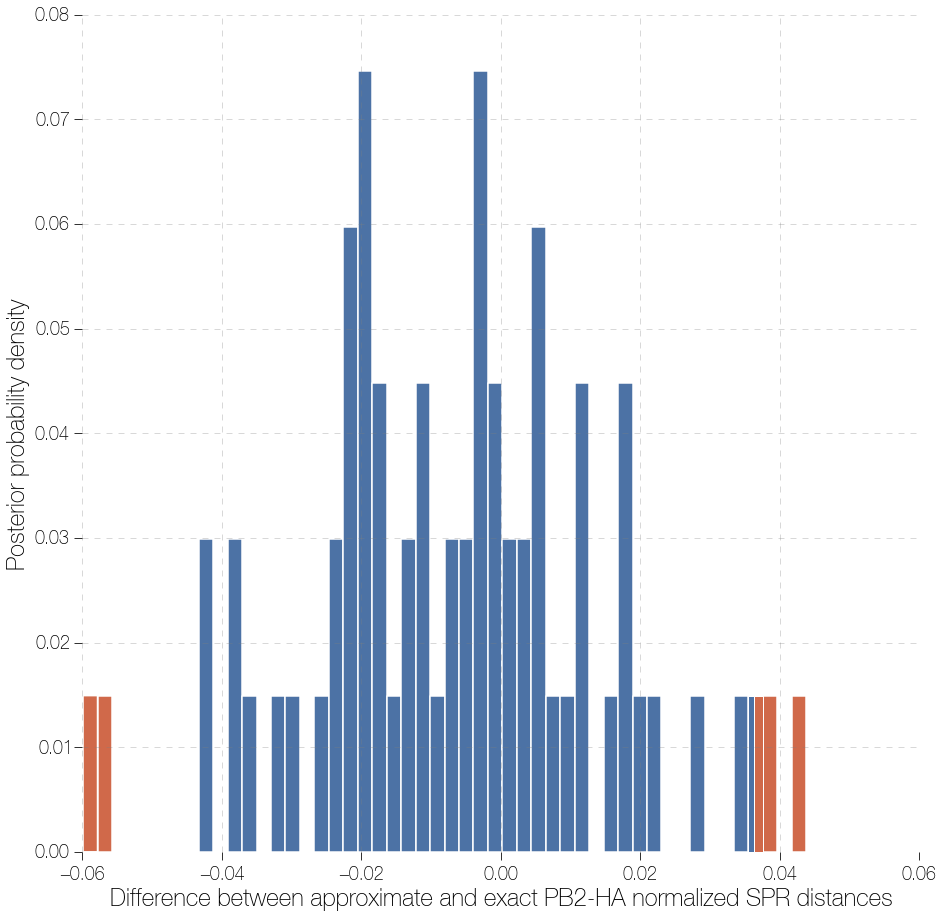
Subtree prune and regraft (SPR) distances between phylogenetic trees are an approximate measure of the numbers of reassortment or recombination events (Svinti et al., 2013). Exact SPR distances are difficult to compute, as they depend on the SPR distance itself and are impractical to compute for posterior distributions of trees except for the most similar trees. We calculated approximate SPR distances (Whidden and Zeh, 2009; Whidden et al., 2010, 2013) to quantify the numbers of reassortments that have taken place between all pairs of segments. Normalized approximate SPR distances,, were recovered using (see Methods):
| (4) |
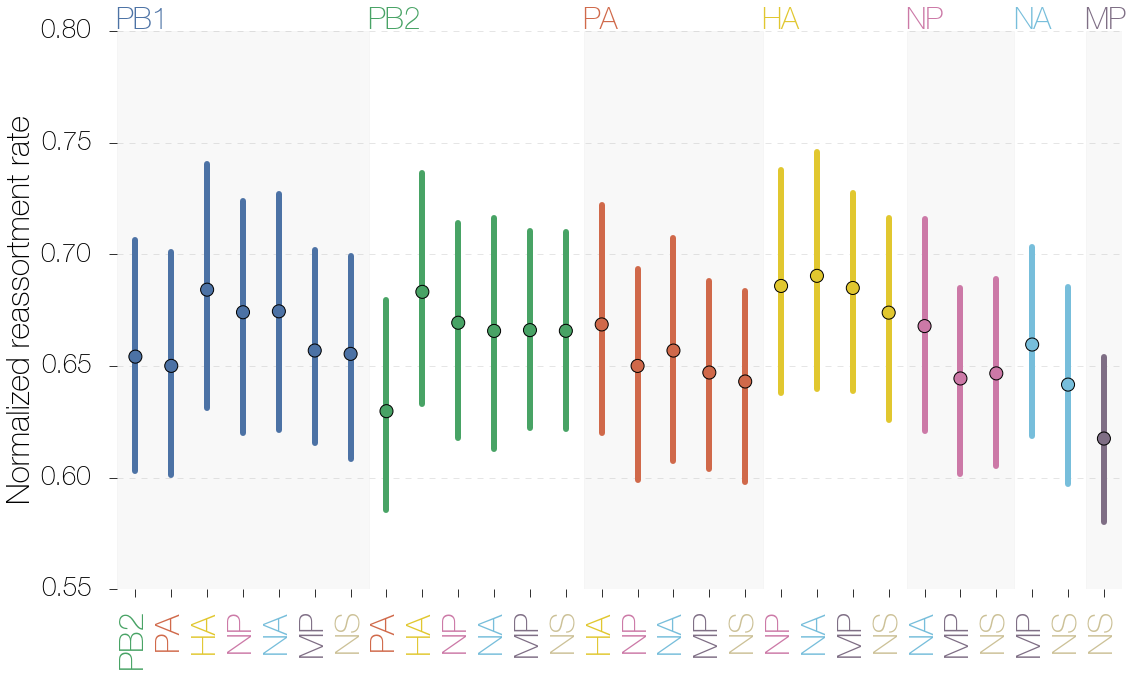
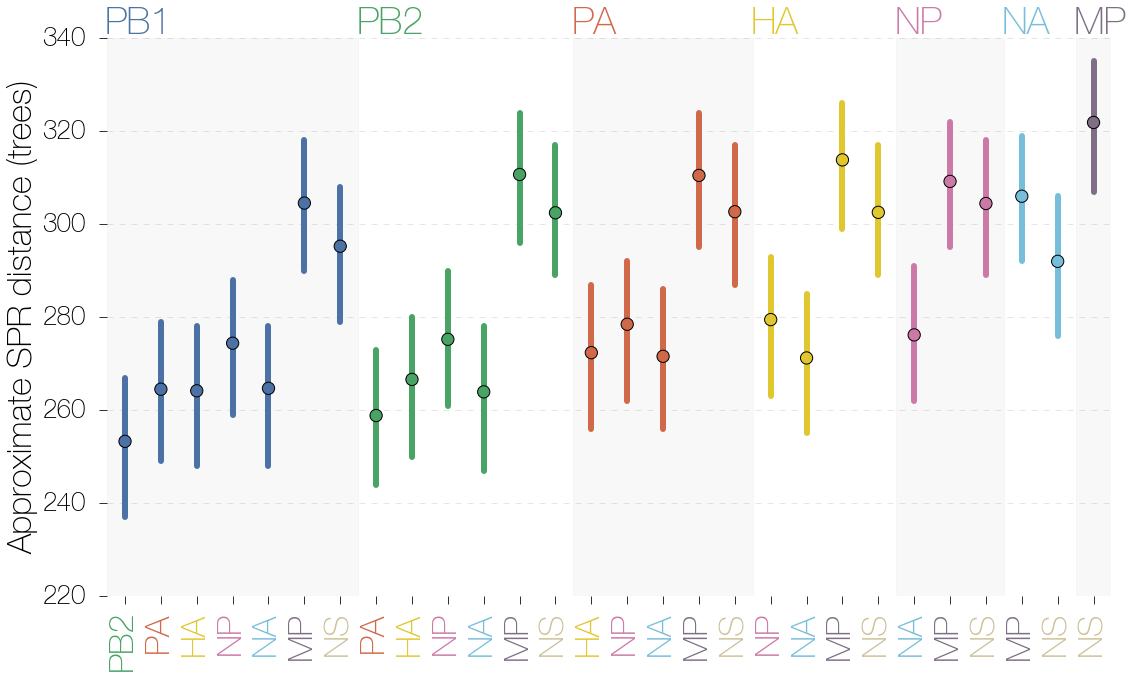
where , and are approximate SPR distances between ith posterior samples from segments , and independent analyses thereof ( and ). Figure S4 shows approximate SPR distances between all pairs of segment trees after normalization. If there are biases in the way segments reassort, so that some segments tend to co-assort more often, we expect to observe a lower reassortment rate between them, which would manifest as small-scale similarities between phylogenetic trees of those segments. In our case we expect SPR distances, which are proportional to the number of reassortment events that have taken place between trees, to reflect the overall (i.e both within and between lineages) reassortment rate.
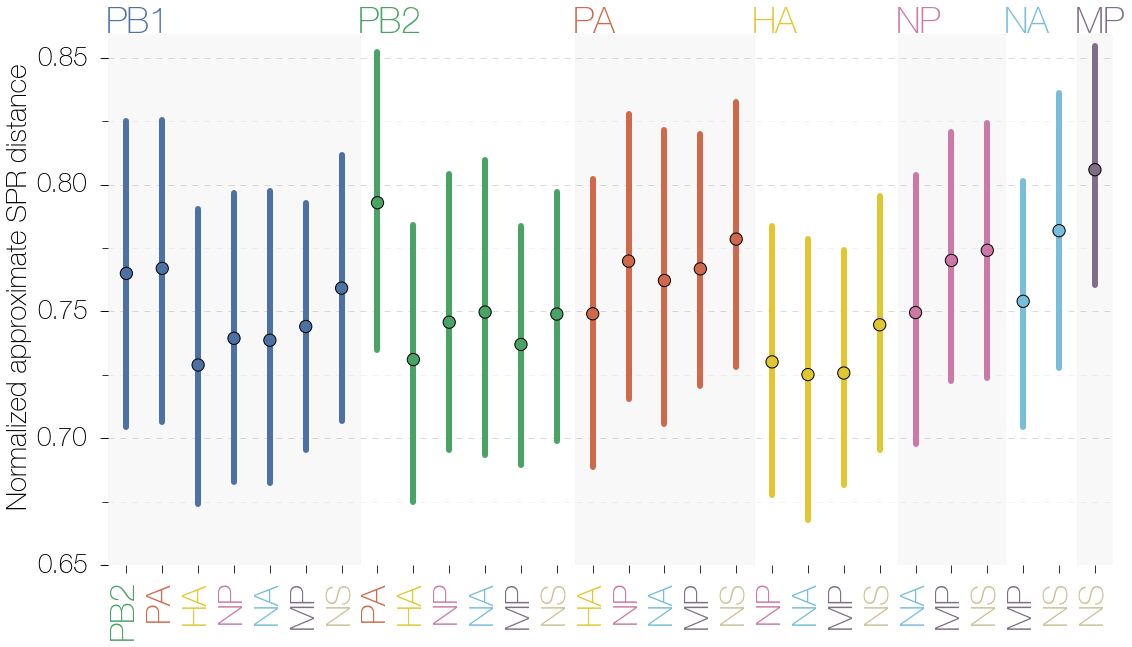
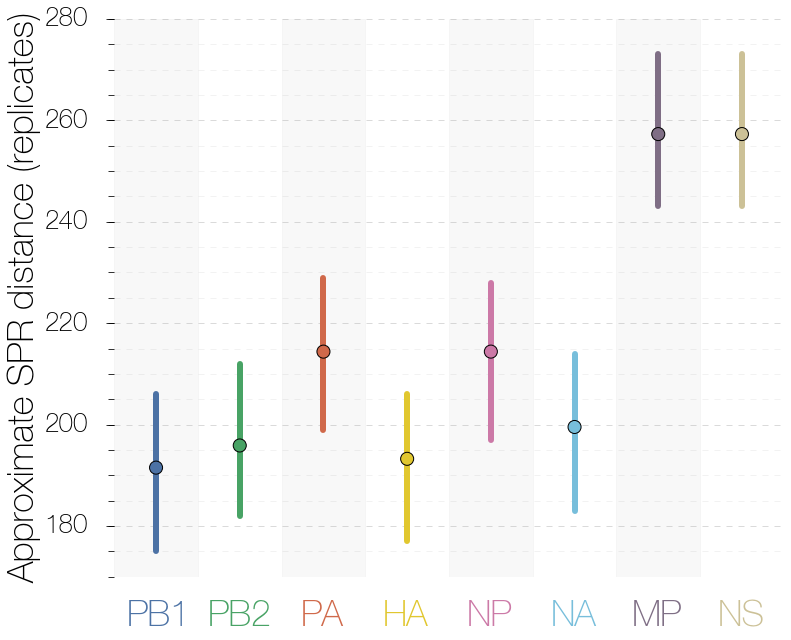
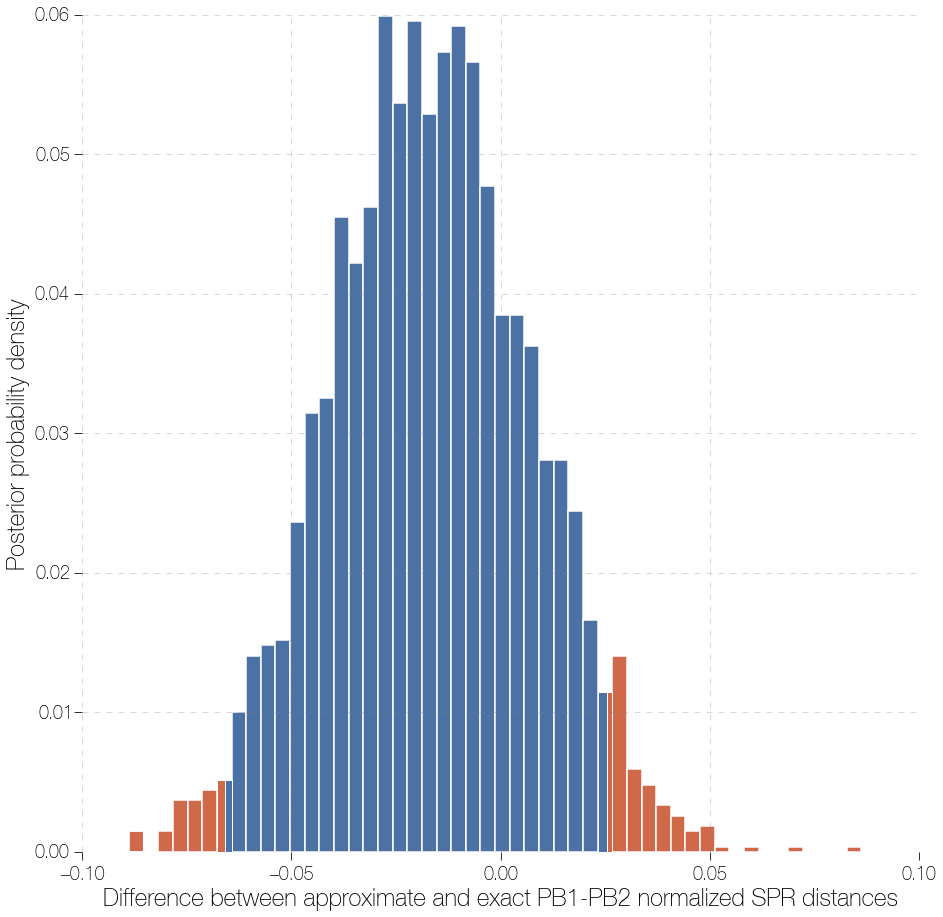
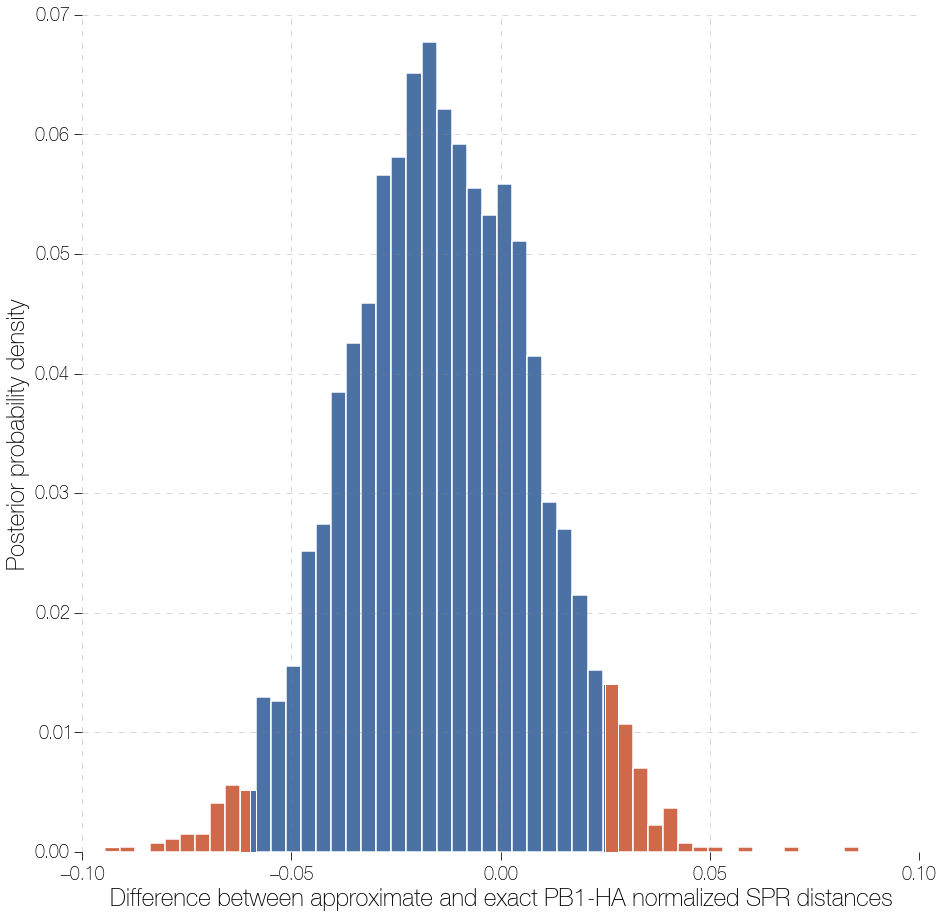
The 95% highest posterior density (HPD) intervals of normalized approximate SPR distances between pairs of segments encompass most means and occupy a relatively small range, suggesting there is no evidence of differences in the number of reassortments between segments (Figure S4). Reassortment rate given as number of SPR moves per total time in both trees shows similar results (Figure S5). This is in line with recent experiments in influenza A that have shown that reassortment between segments differing by a single synonymous difference is highly efficient (Marshall et al., 2013). We note, however, that because of phylogenetic uncertainty our estimate of SPR distance might simply lack power. Comparisons between independent analyses of the same segments yield distances that are comparable to distances between different segments (Figures S6 and S7), suggesting that phylogenetic uncertainty is making a considerable contribution to our estimates of approximate SPR distances. Still, we find that independent replicates from the same segment (Figure S7) show lower SPR distances that comparisons between segments (Figure S6), suggesting that phylogenetic noise is not completely overwhelming reassortment signal. In addition, SPR distances themselves can only approximate (and underestimate) the actual numbers of reassortments. Thus we caution against over-interpreting Figure S4. Although there might be concern about using approximate, rather than exact, SPR distances we do estimate exact SPR distances for a limited number of segment pairs - PB1, PB2 and HA - and find that after normalization exact and approximate SPR distances are not significantly different (Figures S11–S13).
References
- Ansaldi et al. (2003) Ansaldi F, D’Agaro P, de Florentiis D, et al. (12 co-authors). 2003. Molecular characterization of influenza B viruses circulating in northern italy during the 2001–2002 epidemic season. Journal of Medical Virology. 70:463–469.
- Bedford et al. (2011) Bedford T, Cobey S, Pascual M. 2011. Strength and tempo of selection revealed in viral gene genealogies. BMC Evolutionary Biology. 11:220. PMID: 21787390.
- Bedford et al. (2014) Bedford T, Suchard MA, Lemey P, Dudas G, Gregory V, Hay AJ, McCauley JW, Russell CA, Smith DJ, Rambaut A. 2014. Integrating influenza antigenic dynamics with molecular evolution. eLife. 3.
- Bergeron et al. (2010) Bergeron C, Valette M, Lina B, Ottmann M. 2010. Genetic content of influenza H3N2 vaccine seeds. PLoS Currents. 2:RRN1165.
- Bodewes et al. (2013) Bodewes R, Morick D, de Mutsert G, et al. (11 co-authors). 2013. Recurring influenza B virus infections in seals. Emerging Infectious Diseases. 19:511–512.
- Bogner et al. (2006) Bogner P, Capua I, Lipman DJ, Cox NJ, et al. (5 co-authors). 2006. A global initiative on sharing avian flu data. Nature. 442:981–981.
- Boni et al. (2008) Boni MF, Zhou Y, Taubenberger JK, Holmes EC. 2008. Homologous recombination is very rare or absent in human influenza a virus. Journal of Virology. 82:4807–4811. PMID: 18353939.
- Broberg et al. (2013) Broberg E, Beauté J, Snacken R. 2013. Fortnightly influenza surveillance review, 9th May. Technical report, European Centre for Disease Prevention and Control, Stockholm.
- Burnet (1955) Burnet SFM. 1955. Principles of animal virology. Academic Press.
- Chare et al. (2003) Chare ER, Gould EA, Holmes EC. 2003. Phylogenetic analysis reveals a low rate of homologous recombination in negative-sense RNA viruses. Journal of General Virology. 84:2691–2703. PMID: 13679603.
- Chen and Holmes (2008) Chen R, Holmes EC. 2008. The evolutionary dynamics of human influenza B virus. Journal of Molecular Evolution. 66:655–663.
- Cobbin et al. (2013) Cobbin JCA, Verity EE, Gilbertson BP, Rockman SP, Brown LE. 2013. The source of the PB1 gene in influenza vaccine reassortants selectively alters the hemagglutinin content of the resulting seed virus. Journal of Virology. 87:5577–5585. PMID: 23468502.
- Dobzhansky (1937) Dobzhansky T. 1937. Genetics and the Origin of Species. Columbia University Press.
- Drummond et al. (2006) Drummond AJ, Ho SYW, Phillips MJ, Rambaut A. 2006. Relaxed phylogenetics and dating with confidence. PLoS Biol. 4:e88.
- Drummond et al. (2012) Drummond AJ, Suchard MA, Xie D, Rambaut A. 2012. Bayesian phylogenetics with BEAUti and the BEAST 1.7. Molecular Biology and Evolution. 29.
- Fodor and Smith (2004) Fodor E, Smith M. 2004. The PA subunit is required for efficient nuclear accumulation of the PB1 subunit of the influenza a virus RNA polymerase complex. Journal of Virology. 78:9144–9153. PMID: 15308710.
- Fulvini et al. (2011) Fulvini AA, Ramanunninair M, Le J, Pokorny BA, Arroyo JM, Silverman J, Devis R, Bucher D. 2011. Gene constellation of influenza A virus reassortants with high growth phenotype prepared as seed candidates for vaccine production. PLoS ONE. 6:e20823.
- Gregory et al. (2002) Gregory V, Bennett M, Orkhan M, Hajjar SA, Varsano N, Mendelson E, Zambon M, Ellis J, Hay A, Lin Y. 2002. Emergence of influenza A H1N2 reassortant viruses in the human population during 2001. Virology. 300:1 – 7.
- Guilligay et al. (2008) Guilligay D, Tarendeau F, Resa-Infante P, et al. (11 co-authors). 2008. The structural basis for cap binding by influenza virus polymerase subunit PB2. Nature Structural & Molecular Biology. 15:500–506.
- Guindon and Gascuel (2003) Guindon S, Gascuel O. 2003. A simple, fast, and accurate algorithm to estimate large phylogenies by maximum likelihood. Systematic Biology. 52:696–704. PMID: 14530136.
- Han et al. (2010) Han GZ, Boni MF, Li SS. 2010. No observed effect of homologous recombination on influenza c virus evolution. Virology Journal. 7:227. PMID: 20840780.
- Hasegawa et al. (1985) Hasegawa M, Kishino H, Yano Ta. 1985. Dating of the human-ape splitting by a molecular clock of mitochondrial DNA. Journal of Molecular Evolution. 22:160–174.
- Hay et al. (2001) Hay AJ, Gregory V, Douglas AR, Lin YP. 2001. The evolution of human influenza viruses. Philosophical Transactions of the Royal Society of London. Series B. 356:1861–1870. PMID: 11779385 PMCID: PMC1088562.
- Hedrick and Thomson (1986) Hedrick PW, Thomson G. 1986. A two-locus neutrality test: Applications to humans, E. coli and lodgepole pine. Genetics. 112:135–156. PMID: 3510942.
- Hoffmann et al. (2002) Hoffmann E, Mahmood K, Yang CF, Webster RG, Greenberg HB, Kemble G. 2002. Rescue of influenza B virus from eight plasmids. Proceedings of the National Academy of Sciences. 99:11411–11416. PMID: 12172012.
- Kanegae et al. (1990) Kanegae Y, Sugita S, Endo A, Ishida M, Senya S, Osako K, Nerome K, Oya A. 1990. Evolutionary pattern of the hemagglutinin gene of influenza B viruses isolated in japan: cocirculating lineages in the same epidemic season. Journal of Virology. 64:2860–2865.
- Kawaoka et al. (1989) Kawaoka Y, Krauss S, Webster RG. 1989. Avian-to-human transmission of the PB1 gene of influenza A viruses in the 1957 and 1968 pandemics. Journal of Virology. 63:4603–4608. PMID: 2795713 PMCID: PMC251093.
- Lee et al. (2008) Lee HY, Chou JY, Cheong L, Chang NH, Yang SY, Leu JY. 2008. Incompatibility of nuclear and mitochondrial genomes causes hybrid sterility between two yeast species. Cell. 135:1065–1073.
- Lemey et al. (2009) Lemey P, Rambaut A, Drummond AJ, Suchard MA. 2009. Bayesian phylogeography finds its roots. PLoS Comput Biol. 5:e1000520.
- Lewontin (1964) Lewontin RC. 1964. The interaction of selection and linkage. i. general considerations; heterotic models. Genetics. 49:49–67. PMID: 17248194 PMCID: PMC1210557.
- Lindstrom et al. (1999) Lindstrom SE, Hiromoto Y, Nishimura H, Saito T, Nerome R, Nerome K. 1999. Comparative analysis of evolutionary mechanisms of the hemagglutinin and three internal protein genes of influenza B virus: Multiple cocirculating lineages and frequent reassortment of the NP, m, and NS genes. Journal of Virology. 73:4413–4426.
- Longdon et al. (2011) Longdon B, Hadfield JD, Webster CL, Obbard DJ, Jiggins FM. 2011. Host phylogeny determines viral persistence and replication in novel hosts. PLoS Pathog. 7:e1002260.
- Lu et al. (2014) Lu L, Lycett SJ, Brown AJL. 2014. Reassortment patterns of avian influenza virus internal segments among different subtypes. BMC Evolutionary Biology. 14:16.
- Lycett et al. (2012) Lycett SJ, Baillie G, Coulter E, et al. (11 co-authors). 2012. Estimating reassortment rates in co-circulating eurasian swine influenza viruses. Journal of General Virology. 93:2326–2336.
- Marshall et al. (2013) Marshall N, Priyamvada L, Ende Z, Steel J, Lowen AC. 2013. Influenza virus reassortment occurs with high frequency in the absence of segment mismatch. PLoS Pathog. 9:e1003421.
- Minin et al. (2008) Minin VN, Bloomquist EW, Suchard MA. 2008. Smooth skyride through a rough skyline: Bayesian coalescent-based inference of population dynamics. Molecular Biology and Evolution. 25:1459–1471.
- Muller (1942) Muller H. 1942. Isolating mechanisms, evolution and temperature. In: Biol. Symp. volume 6, pp. 71–125.
- Nakagawa et al. (2002) Nakagawa N, Nukuzuma S, Haratome S, Go S, Nakagawa T, Hayashi K. 2002. Emergence of an influenza B virus with antigenic change. Journal of Clinical Microbiology. 40:3068–3070.
- Nath and Nayak (1990) Nath ST, Nayak DP. 1990. Function of two discrete regions is required for nuclear localization of polymerase basic protein 1 of A/WSN/33 influenza virus (h1 n1). Molecular and Cellular Biology. 10:4139–4145. PMID: 2196448.
- Nerome et al. (1998) Nerome R, Hiromoto Y, Sugita S, Tanabe N, Ishida M, Matsumoto M, Lindstrom SE, Takahashi T, Nerome K. 1998. Evolutionary characteristics of influenza B virus since its first isolation in 1940: dynamic circulation of deletion and insertion mechanism. Archives of Virology. 143:1569–1583.
- O’Brien et al. (2009) O’Brien JD, Minin VN, Suchard MA. 2009. Learning to count: Robust estimates for labeled distances between molecular sequences. Molecular Biology and Evolution. 26:801–814. PMID: 19131426.
- Osterhaus et al. (2000) Osterhaus ADME, Rimmelzwaan GF, Martina BEE, Bestebroer TM, Fouchier RaM. 2000. Influenza B virus in seals. Science. 288:1051–1053.
- Presgraves (2010) Presgraves DC. 2010. The molecular evolutionary basis of species formation. Nature Reviews Genetics. 11:175–180.
- Rambaut, A. and Suchard, M. and Drummond, A. (2009) Rambaut, A and Suchard, M and Drummond, A. 2009. Tracer v1.5. Available at http://tree.bio.ed.ac.uk/software/tracer/.
- Reed et al. (2012) Reed C, Meltzer MI, Finelli L, Fiore A. 2012. Public health impact of including two lineages of influenza B in a quadrivalent seasonal influenza vaccine. Vaccine. 30:1993–1998.
- Rota et al. (1990) Rota PA, Wallis TR, Harmon MW, Rota JS, Kendal AP, Nerome K. 1990. Cocirculation of two distinct evolutionary lineages of influenza type B virus since 1983. Virology. 175:59–68.
- Ruane et al. (2011) Ruane S, Pyron RA, Burbrink FT. 2011. Phylogenetic relationships of the cretaceous frog beelzebufo from madagascar and the placement of fossil constraints based on temporal and phylogenetic evidence. Journal of Evolutionary Biology. 24:274–285.
- Shaw et al. (2002) Shaw MW, Xu X, Li Y, Normand S, Ueki RT, Kunimoto GY, Hall H, Klimov A, Cox NJ, Subbarao K. 2002. Reappearance and global spread of variants of influenza B/Victoria/2/87 lineage viruses in the 2000–2001 and 2001–2002 seasons. Virology. 303:1–8.
- Smith et al. (2009) Smith GJD, Vijaykrishna D, Bahl J, et al. (13 co-authors). 2009. Origins and evolutionary genomics of the 2009 swine-origin H1N1 influenza A epidemic. Nature. 459:1122–1125.
- Svinti et al. (2013) Svinti V, Cotton JA, McInerney JO. 2013. New approaches for unravelling reassortment pathways. BMC Evolutionary Biology. 13:1. PMID: 23279962.
- Turner et al. (2005) Turner TL, Hahn MW, Nuzhdin SV. 2005. Genomic islands of speciation in Anopheles gambiae. PLoS Biol. 3:e285.
- Ward et al. (2013) Ward MJ, Lycett SJ, Kalish ML, Rambaut A, Brown AJL. 2013. Estimating the rate of intersubtype recombination in early HIV-1 group M strains. Journal of Virology. 87:1967–1973.
- Whidden et al. (2010) Whidden C, Beiko RG, Zeh N. 2010. Fast FPT algorithms for computing rooted agreement forests: Theory and experiments. In: Festa P, editor, Experimental Algorithms, Springer Berlin Heidelberg, number 6049 in Lecture Notes in Computer Science, pp. 141–153.
- Whidden et al. (2013) Whidden C, Beiko RG, Zeh N. 2013. Fixed-parameter algorithms for maximum agreement forests. SIAM Journal on Computing. 42:1431–1466.
- Whidden and Zeh (2009) Whidden C, Zeh N. 2009. A unifying view on approximation and FPT of agreement forests. In: Salzberg SL, Warnow T, editors, Algorithms in Bioinformatics, Springer Berlin Heidelberg, number 5724 in Lecture Notes in Computer Science, pp. 390–402.
- World Health Organization (2009) World Health Organization. 2009. Influenza Fact sheet. Available at http://www.who.int/mediacentre/factsheets/fs211/en/.
- Zhao et al. (2005) Zhao H, Nettleton D, Soller M, Dekkers JCM. 2005. Evaluation of linkage disequilibrium measures between multi-allelic markers as predictors of linkage disequilibrium between markers and QTL. Genetics Research. 86:77–87.