Gamow-Teller response in deformed even and odd neutron-rich Zr and Mo isotopes
Abstract
-decay properties of neutron-rich Zr and Mo isotopes are investigated within a microscopic theoretical approach based on the proton-neutron quasiparticle random-phase approximation. The underlying mean field is described self-consistently from deformed Skyrme Hartree-Fock calculations with pairing correlations. Residual separable particle-hole and particle-particle forces are also included in the formalism. The structural evolution in these isotopic chains including both even and odd isotopes is analyzed in terms of the equilibrium deformed shapes. Gamow-Teller strength distributions, -decay half-lives, and -delayed neutron-emission probabilities are studied, stressing their relevance to describe the path of the nucleosynthesis rapid neutron capture process.
pacs:
21.60.Jz, 23.40.Hc, 27.60.+j, 26.30.-kI Introduction
Neutron-rich nuclei in the mass region have attracted considerable attention from both theoretical and experimental sides in the last decades. They are interesting in many respects. First, the mass region is characterized by rapid structural changes in the ground state and low-lying collective excited states (see e.g. wood92 ; heyde11 for a general review). Relativistic xiang_12 ; mei_12 and nonrelativistic bonche85 ; bender08 ; bender09 ; rayner1 ; rayner2 studies of the nuclear structural evolution in this mass region show that the equilibrium shape of the nucleus changes rapidly with the number of nucleons and shape coexistence is present with competing spherical, axially symmetric prolate and oblate, as well as triaxial shapes at close energies. These features are supported by spectroscopic observations sumikama_11 including lifetime measurements mach ; goodin ; urban and quadrupole moments for rotational bands urban , as well as by laser spectroscopy measurements on Zr campbell and Mo charlwood isotopes.
In addition, this mass region is also involved in the astrophysical rapid neutron capture process (r process). The r process is considered to be one of the main nucleosynthesis mechanisms leading to the production of heavy neutron-rich nuclei and for the existence of about half of the nuclei heavier than iron bbhf ; cowan91 . The r-process nucleosynthesis involves many neutron-rich unstable isotopes, whose masses and -decay properties, including -decay half-lives () and -delayed neutron-emission probabilities (), are crucial quantities to understand the possible r-process paths, the isotopic abundances, and the time scales of the process cowan91 ; kra93 . Although much progress is being done recently on masses (see for example the Jyväskylä mass database jyvaskyla ) and half-lives pereira ; nishimura_11 measurements, unfortunately most of the nuclear properties of relevance for the r process are experimentally unknown due to their extremely low production yields in the laboratory. Therefore, reliable nuclear physics models are needed to interpret the astrophysical observations and to model and simulate properly the r process. For example, the agreement with the observed r-process abundances in this mass region is manifestly improved pfeiffer01 ; sun08 when using nuclear structure models that include a shell quenching effect at doba96 ; ETFSIQ .
The quasiparticle random-phase approximation (QRPA) has been shown to be a suitable model to deal with medium-mass open-shell nuclei. QRPA calculations for neutron-rich nuclei have been performed within different approaches, such as spherical formalisms based on Hartree-Fock-Bogoliubov (HFB) mean field engel , on continuum spherical QRPA with density functionals borzov3 , and on relativistic mean field approaches niksic2005 . However, the mass region of concern here requires nuclear deformation as a relevant degree of freedom to characterize the nuclear structure involved in the calculation of the -strength functions. The deformed QRPA formalism was developed in Refs. moller1 ; moller2 ; moller3 ; moller08 ; homma ; hir1 ; hir2 , where phenomenological mean fields based on Nilsson or Woods-Saxon potentials were used as a starting basis. A Tamm-Dancoff approximation with Sk3 interaction was also implemented in Ref. hamamoto .
In this work we investigate the decay properties of both even and odd neutron-rich Zr and Mo isotopes within a deformed proton-neutron QRPA based on a self-consistent Hartree-Fock (HF) mean field formalism with Skyrme interactions and pairing correlations in BCS approximation. Residual spin-isospin interactions are also included in the particle-hole and particle-particle channels sarri1 ; sarri2 . This work was started in Ref. sarri_pere , where the -decay properties of the even-even isotopes 100-110Zr and 104-114Mo were studied. In the present work we extend that study in several aspects. First, we repeat the calculations of and for the same isotopes, but using new or updated measurements for the and values audi12 . Second, we extend the calculations to include odd- isotopes, as well as more exotic isotopes, namely 112-116Zr and 116-120Mo. This study is justified by a renewed experimental interest to measure the half-lives of heavier and more exotic nuclei in this mass region at RIKEN. This study will contribute with theoretical support to the understanding of these future measurements.
The paper is organized as follows. In Sec. II we present a review of the theoretical formalism used. Sec. III contains the results obtained for the potential energy curves (PEC), Gamow-Teller (GT) strength distributions, -decay half-lives, and -delayed neutron-emission probabilities. Sec. IV summarizes the main conclusions.
II Theoretical Formalism
In this section we show briefly the theoretical framework used in this paper to describe the -decay properties in Zr and Mo neutron-rich isotopes. More details of the formalism can be found in Refs. sarri1 ; sarri2 . The method consists of a self-consistent formalism based on a deformed Hartree-Fock mean field obtained with Skyrme interactions including pairing correlations. The single-particle energies, wave functions, and occupation probabilities are generated from this mean field. In this work we have chosen the Skyrme force SLy4 sly4 as a representative of the Skyrme forces. The protocol to derive this interaction includes information on the equation of state of pure neutron matter obtained from realistic forces that produce better isotopic properties. SLy4 is one of the more successful Skyrme forces and has been extensively studied in the last years bender08 ; bender09 ; stoitsov .
The solution of the HF equation is found by using the formalism developed in Ref. vautherin , assuming time reversal and axial symmetry. The single-particle wave functions are expanded in terms of the eigenstates of an axially symmetric harmonic oscillator in cylindrical coordinates, using twelve major shells. The method also includes pairing between like nucleons in BCS approximation with fixed gap parameters for protons and neutrons, which are determined phenomenologically from the odd-even mass differences through a symmetric five term formula involving the experimental binding energies audi12 when available. In those cases where experimental information for masses is still not available, we have used the same pairing gaps as the closer isotopes measured. The pairing gaps for protons () and neutrons () obtained in this way are roughly around 1 MeV.
The PECs are analyzed as a function of the quadrupole deformation parameter . For that purpose, constrained HF calculations are performed with a quadratic constraint constraint . The HF energy is minimized under the constraint of keeping fixed the nuclear deformation. Calculations for GT strengths are performed subsequently for the equilibrium shapes of each nucleus, that is, for the solutions, in general deformed, for which minima are obtained in the energy curves. Since decays connecting different shapes are disfavored, similar shapes are assumed for the ground state of the parent nucleus and for all populated states in the daughter nucleus. The validity of this assumption was discussed for example in Refs. moller1 ; homma .
To describe GT transitions, a spin-isospin residual interaction is added to the mean field and treated in a deformed proton-neutron QRPA moller1 ; moller2 ; moller3 ; moller08 ; homma ; hir1 ; hir2 ; hamamoto ; sarri1 ; sarri2 . This interaction contains two parts, particle-hole () and particle-particle (). The interaction in the channel is responsible for the position and structure of the GT resonance sarri1 ; sarri2 ; homma and it can be derived consistently from the same Skyrme interaction used to generate the mean field, through the second derivatives of the energy density functional with respect to the one-body densities. The residual interaction is finally expressed in a separable form by averaging the Landau-Migdal resulting force over the nuclear volume, as explained in Refs. sarri1 ; sarri2 . By taking separable GT forces, the energy eigenvalue problem reduces to find the roots of an algebraic equation. The component is a neutron-proton pairing force in the coupling channel, which is also introduced as a separable force hir1 ; hir2 ; sarri2 . This strength is usually fitted to reproduce globally the experimental half-lives. Various attempts have been done in the past to fix this strength homma , arriving to expressions that depend on the model used to describe the mean field, Nilsson model in the above reference.
In previous works sarri1 ; sarri2 ; sarri3 ; sarri4 ; sarri_wp we studied the sensitivity of the GT strength distributions to the various ingredients contributing to the deformed QRPA calculations, namely to the nucleon-nucleon effective force, to pairing correlations, and to residual interactions. We found different sensitivities to them. In this work, all of these ingredients have been fixed to the most reasonable choices found previously. In particular we use the coupling strengths MeV and MeV for the and channels, respectively.
The technical details to solve the QRPA equations have been described in Refs. hir1 ; hir2 ; sarri1 . Here we only mention that, because of the use of separable residual forces, the solutions of the QRPA equations are found by solving first a dispersion relation, which is an algebraic equation of fourth order in the excitation energy . Then, for each value of the energy, the GT transition amplitudes in the intrinsic frame connecting the ground state of an even-even nucleus to one phonon states in the daughter nucleus are found to be
| (1) |
where and
| (2) | |||||
| (3) |
with
| (4) |
in terms of the occupation amplitudes for neutrons and protons () and the matrix elements of the spin operator, , connecting proton and neutron single-particle states, as they come out from the HF+BCS calculation. and are the forward and backward amplitudes of the QRPA phonon operator, respectively.
Once the intrinsic amplitudes in Eq. (1) are calculated, the GT strength in the laboratory system for a transition can be obtained as
| (5) | |||||
in units. To obtain this expression, the initial and final states in the laboratory frame have been expressed in terms of the intrinsic states using the Bohr-Mottelson factorization bm .
When the parent nucleus has an odd nucleon, the ground state can be expressed as a one-quasiparticle (1qp) state in which the odd nucleon occupies the single-particle orbit of lowest energy. Then two types of transitions are possible. One type is due to phonon excitations in which the odd nucleon acts only as a spectator. These are three-quasiparticle (3qp) states. In the intrinsic frame, the transition amplitudes are in this case basically the same as in the even-even case in Eq. (1), but with the blocked spectator excluded from the calculation. The other type of transitions are those involving the odd nucleon state (1qp), which are treated by taking into account phonon correlations in the quasiparticle transitions in first-order perturbation. The transition amplitudes for the correlated states can be found in Ref. hir2 ; sarri4 .
Concerning the excitation energy of the daughter nuclei to which we refer all the GT strength distributions in this paper, we have to distinguish again between the case of even-even and odd- parents. In the case of even-even systems, the excitation energy of the 2qp states is simply given by
| (6) |
where and are the lowest quasiparticle energies for protons and neutrons, respectively. In the case of an odd- nucleus we have to deal with 1qp and 3qp transitions. For Zr and Mo isotopes we have an odd-neutron parent decaying into an odd-proton daughter. The excitation energies for 1qp transitions are
| (7) |
On the other hand, in the 3qp case where the unpaired neutron acts as a spectator, the excitation energy with respect to the ground state of the daughter nucleus is
| (8) |
This implies that the lowest excitation energy of 3qp type is of the order of twice the neutron pairing gap. Therefore, all the strength contained in the low-excitation-energy region below typically 2-3 MeV in the odd-A nuclei studied in this paper, corresponds to 1qp transitions.
The -decay half-life is obtained by summing all the allowed transition strengths to states in the daughter nucleus with excitation energies lying below the corresponding -energy, , written in terms of the nuclear masses and the electron mass (), and weighted with the phase space factors ,
| (9) |
with s and , where 0.77 is a standard quenching factor. The bare results can be recovered by scaling the results in this paper for and with the square of this quenching factor.
The Fermi integral is computed numerically for each value of the energy including screening and finite size effects, as explained in Ref. gove ,
| (10) |
with
| (11) |
where ; ; is the fine structure constant and the nuclear radius. is the total energy of the particle, is the total energy available in units, and is the momentum in units. This function weights differently the strength depending on the excitation energy. As a general rule increases with the energy of the -particle and therefore the strength located at low excitation energies contributes more significantly to the half-life.

The probability for -delayed neutron emission is given by
| (12) |
where the sums extend to all the excitation energies in the daughter nuclei in the indicated ranges. is the one-neutron separation energy in the daughter nucleus. In this expression it is assumed that all the decays to energies above in the daughter nuclei lead always to delayed neutron emission and then, -decay from neutron unbound levels is neglected. According to Eq. (12), is mostly sensitive to the strength located at energies around , thus providing a structure probe complementary to .
III Results and discussion
In this section we start by showing the results obtained for the potential energy curves in the most unstable isotopes not considered in Ref. sarri_pere . Then, we calculate the energy distribution of the GT strength corresponding to the local minima in the potential energy curves. After showing the predictions of various models for the and values for the most unstable isotopes where no data are available, we calculate and , and discuss the results.
III.1 Potential Energy Curves
PECs obtained from constrained HF+BCS calculations for even-even isotopes 100-110Zr and 104-114Mo were discussed in Ref. sarri_pere . In that reference, it was shown that both Zr and Mo isotopes exhibit two well developed oblate and prolate minima, which are separated by barriers ranging from 3 MeV up to 5 MeV. In the case of Zr isotopes, the ground states are located in the prolate sector at positive values of . There are also oblate minima at somewhat higher energies located at . In the isotopes 108-110Zr a spherical local minimum is also developed. For Mo isotopes we observed practically degenerate oblate and prolate shapes in the light 104,106Mo isotopes, oblate ground states in heavier isotopes with quadrupole deformations at with prolate excited states at energies lower than 1 MeV (), and spherical configurations at very low energies in heavier isotopes, resulting in an emergent triple oblate-spherical-prolate shape coexistence scenario. These results are in qualitative agreement with similar ones obtained in this mass region from different theoretical approaches including macroscopic-microscopic methods based on liquid drop models with shell corrections skalski97 ; FRDM , relativistic mean fields lala2 , as well as nonrelativistic calculations with Skyrme bonche85 and Gogny hilaire interactions. Thus, a consistent theoretical description emerges, which is supported by the still scarce experimental information available mach ; goodin ; urban ; campbell ; charlwood .
In this work, we complete the picture with the inclusion of the PECs in 112,114,116Zr and 116,118,120Mo isotopes. We show in Fig. 1 the energies relative to that of the ground state plotted as a function of the quadrupole deformation . The general trend observed is the gradual disappearance of both prolate and oblate minima collapsing into a spherical solution in the heavier isotopes as the magic number is approached.
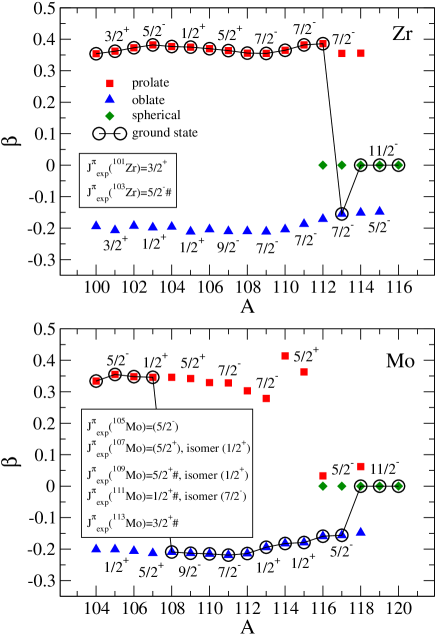
To further illustrate the role of deformation in the isotopic evolution, we show in Fig. 2 the quadrupole deformation of the various energy minima as a function of the mass number , for Zr and Mo isotopic chains. The deformation corresponding to the ground state for each isotope is encircled. We can see that in most cases we have two minima, in the prolate and oblate sectors, which are very close in energy. It is also interesting to compare the spin and parity () of the different shapes with the experimental assignments. We can see in Fig. 2 those values for the odd- isotopes. In the case of Zr isotopes, the experimental are and for 101Zr and 103Zr, respectively. The symbol indicates here and in what follows that the values are estimated from trends in neighboring nuclides. They correspond nicely with the spin and parities obtained with SLy4 for the lowest one quasiparticle prolate states. In the case of Mo isotopes, 105Mo is a state well described by the prolate SLy4 ground state. 107Mo is a state with a excited state at 65 keV. They appear as prolate () and oblate () states in the calculations at very close energies. In heavier isotopes some discrepancies are found between the spin-parity of the calculated ground states and the experimental assignments obtained from systematics. Nevertheless, the spin and parity of 109Mo () corresponds to the prolate shape in the calculations, whereas in 111Mo the spin and parity of the isomer state () agrees with the oblate configuration.


III.2 Electromagnetic properties
Although the main focus of this work is the decay properties of neutron-rich Zr and Mo isotopes, it is also worth discussing their electromagnetic properties within the rotational formalism of Bohr and Mottelson bm . Then, we discuss the isotopic structural evolution in these chains by studying electric quadrupole moments , moments of inertia , excitation energies of the excited states , reduced transition probabilities and magnetic dipole moments , in the case of even-even isotopes. In the case of odd- isotopes we concentrate the study on magnetic dipole moments and reduced transition probabilities.
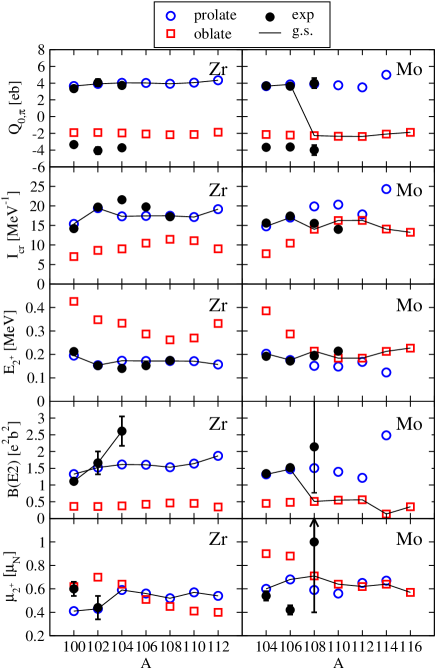
In Fig. 3 we present these results for the even Zr and Mo isotopes. We show results for both prolate and oblate shapes because they have very close energies. The ground state shapes predicted in the calculation are connected with solid lines. They correspond to prolate shapes in the Zr isotopes and to prolate shapes in 104,106Mo isotopes and oblate shapes in 108-116Mo isotopes. The intrinsic electric quadrupole moments are calculated microscopically from the SLy4 Skyrme interaction used in this work. The moments of inertia are calculated in a cranking approach as described in moya and the rotational energies of the states of the ground state band are given in terms of by
| (13) |
The reduced transition probability corresponding to a transition within a band is given by
| (14) |
For the transition from the ground state to the rotational state this expression reduces to
| (15) |
The magnetic dipole moment of a rotational state is given by
| (16) | |||||
in terms of the rotational () and single-particle () gyromagnetic ratios, and the magnetic decoupling parameter bm . For even-even isotopes is simply given by .
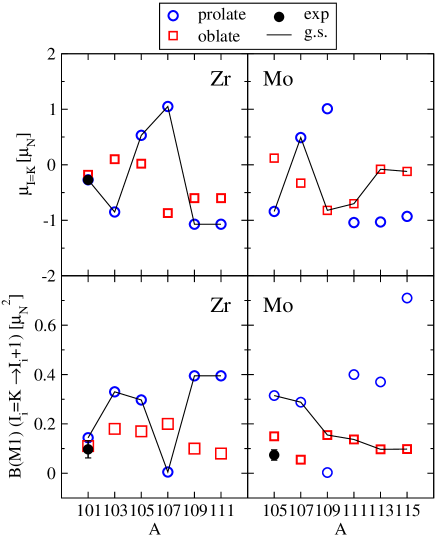
In the case of odd- isotopes we calculate magnetic dipole moments and reduced transition probabilities connecting states within a rotational band,
| (17) |
In Fig. 4 we show the results corresponding to and for transition probabilities connecting the ground states with the first excited states in the rotational band .
Data are taken from Refs. raman ; stone ; ensdf . The intrinsic quadrupole moments have been plotted with the two possible signs because they are extracted from values raman . The agreement with the still scarce experimental information is very reasonable, favoring the description of the lighter Zr and Mo isotopes as prolate in agreement with the calculations. Only the data on and in 108Mo seem to be at variance with the calculation that predicts an oblate shape for the ground state, whereas the data seem to favor a prolate shape, thus shifting the expected transition from prolate to oblate to a heavier isotope.
III.3 Gamow-Teller strength distributions
In the next figures, we show the results obtained for the energy distributions of the GT strength corresponding to the oblate-prolate-spherical equilibrium shapes for which we obtained relevant minima in the PECs. The results are obtained from QRPA with the force SLy4 with pairing correlations and with residual interactions with the parameters written in Sec. II. The GT strength in units, is plotted versus the excitation energy of the daughter nucleus and a quenching factor 0.77 has been included.
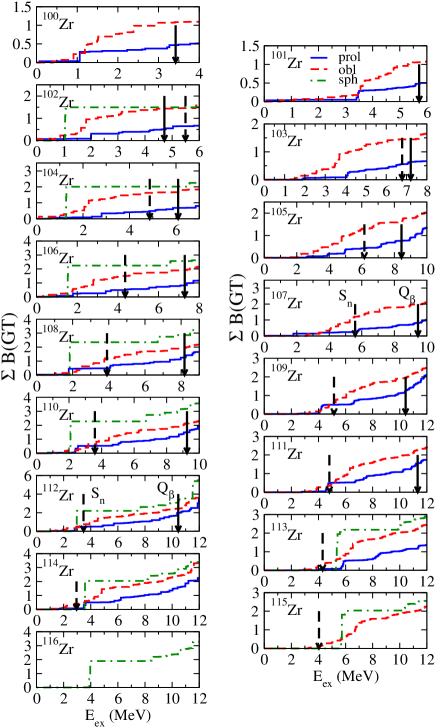
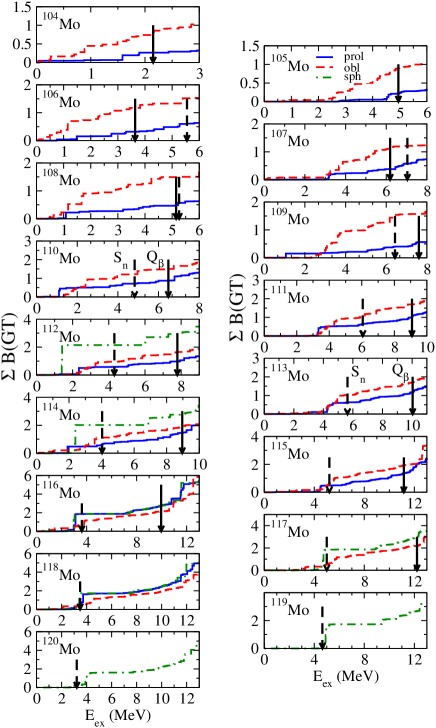
Figs. 5 and 6 contain the results for Zr and Mo isotopes, respectively. We show the energy distributions of the individual GT strengths together with continuous distributions obtained by folding the strength with 1 MeV width Breit-Wigner functions. The main characteristic of these distributions is the existence of a GT resonance located at increasing excitation energy as the number of neutrons increases. The total GT strength also increases with , as it is expected to fulfill the Ikeda sum rule. It is worth noticing that both oblate and prolate shapes produce quite similar GT strength distributions on a global scale. Nevertheless, the small differences among the various shapes at the low energy tails (below the ) of the GT strength distributions that can be appreciated because of the logarithmic scale, lead to sizable effects in the -decay half-lives. In the next figures, Fig. 7 for Zr isotopes and Fig. 8 for Mo isotopes, we can see the accumulated GT strength in the energy region below the corresponding energy of each isotope, which is the relevant energy range for the calculation of the half-lives. The vertical solid (dashed) arrows show the () energies, taken from experiment audi12 .
In these figures one can appreciate the sensitivity of these distributions to deformation and how measurements of the GT strength distribution from -decay can be a powerful tool to get information about this deformation, as it was carried out in Refs. exp_poirier ; exp_nacher . The accumulated strength from the oblate shapes is in most cases larger than the corresponding prolate profiles. The spherical distributions have distinct characteristics showing always as a strong peak at relative low energies. The profiles from different shapes could be easily distinguished experimentally from each other. This is specially true in the case of the lighter isotopes 100-104Zr and 104-108Mo, where the differences are enhanced. These isotopes are in principle easier to measure since they are closer to stability.
Experimental information on GT strength distributions in these isotopes is only available in the energy range below 1 MeV for the isotopes 106,108Mo jokinen , 110Mo wang04 , and 100,102,104Zr rinta07 . Unfortunately, the energy region is still very narrow and represents only a small fraction of the GT strength relevant for the half-life determination. Clearly, more experimental information is needed to get insight into the nuclear structure of these isotopes.
Knowledge of the energy distribution of the GT strength is of paramount importance to understand and constrain the underlying nuclear structure responsible for the nuclear GT response. Half-lives are integral quantities of this strength weighted with appropriate phase factors (see Eq. 9), but reproducing theoretically the half-lives does not warrant the correct description of the GT strength distribution. The latter are indeed needed to determine the decay rates in astrophysical scenarios. This is because the phase factors are sensitive functions of the electron distribution in the medium that can block the available space for the -particle langanke . Thus, the stellar phase factors are different from those in the laboratory under terrestrial conditions and so are the half-lives. Therefore, to describe properly the half-lives under extreme conditions of density and the temperature one needs to account not only for genuine thermal effects due to the population of excited state in the decaying nuclei, but also for a reliable description of the GT strength distributions sarri09_1 ; sarri09_2 .
It is also worth noting that the GT strength distribution in odd- isotopes is typically displaced to higher energies (about 2-3 MeV) with respect to the even-even case. This can be clearly seen in the position of the GT resonance in Figs. 5-6 or in the lower excitation energy at which we found significant strength in Figs. 7-8. The shift corresponds roughly to the breaking of a neutron pair and therefore it amounts to about twice the neutron pairing gap as it can be seen in Eqs. (6)-(8). Similarly, one observes that this energy shift is the step in the odd-even staggering of ans in Fig. 9. Taking into account both effects (the displacement of the strength and the increase of in odd- nuclei), the final half-lives cancel them to a large extent, giving rise to a smooth behavior in , as we shall see in the next subsection.
.
III.4 Half-lives and -delayed neutron-emission probabilities
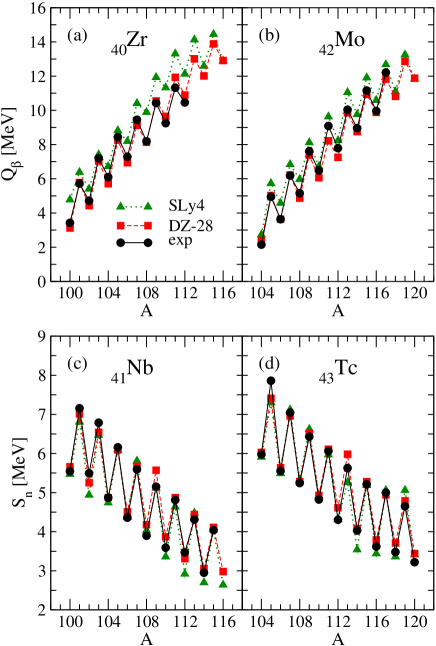
The calculation of the half-lives in Eq. (9) involves knowledge of the GT strength distribution and of the values. The calculation of the probability for -delayed neutron emission in Eq. (12) involves also knowledge of the energies. We use experimental values for and , which are taken from Ref. audi12 , when available. But in those cases where experimental masses are not measured, one has to rely on theoretical predictions for them. There are a large number of mass formulas in the market obtained from different approaches. The study in Ref. sarri_pere showed us that among them, the Duflo and Zuker (DZ-28) mass model DufloZuker and the masses calculated from SLy4 with a zero-range pairing force and Lipkin-Nogami obtained from the code HFBTHO mass_sly4 , produce good agreement with the measured and energies.
In the upper panels of Fig. 9 we can see the experimental values (black dots) audi12 for Zr (a) and Mo (b) isotopes. This information is only available for the isotopes 100-112Zr and 104-117Mo, although the values beyond 105Zr and 109Mo are evaluated from systematics. These values are compared with the predictions of the two mass models mentioned above. In the lower panels we have the neutron separation energies corresponding to the daughter isotopes of Zr and Mo, Nb (c) and Tc (d), respectively. In this case the energies beyond 109Nb and 113Tc are not directly measured, but deduced from systematics. In what follows the results for and will be calculated by using experimental and values when available, and values from SLy4 and DZ-28 in other cases.
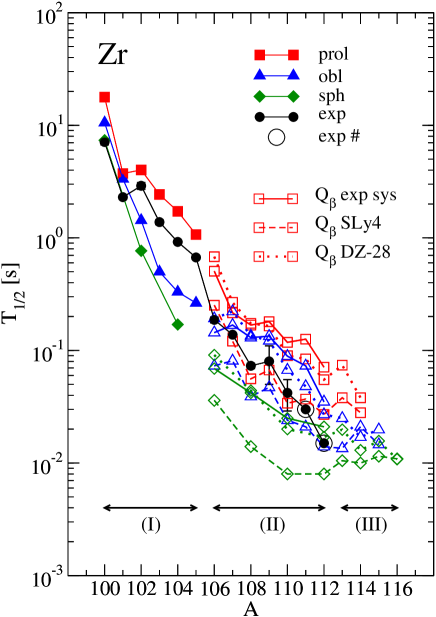
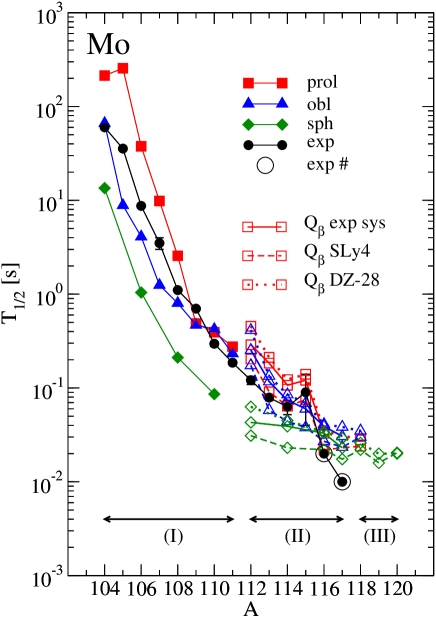
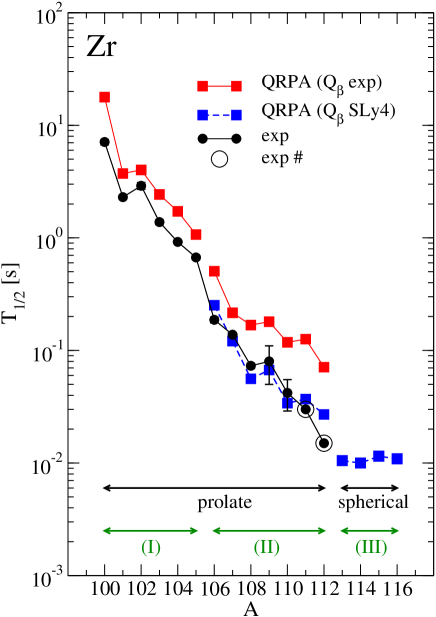
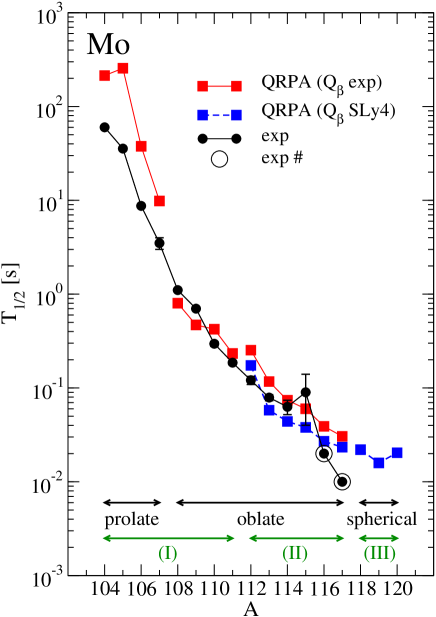
In Figs. 10 and 11 we compare the measured -decay half-lives with the theoretical results obtained with the prolate, oblate, and spherical equilibrium shapes, for Zr and Mo isotopes, respectively. Three regions can be distinguished in these figures. A first region (I) with solid symbols for prolate, oblate, and spherical shapes, where experimental values are used, 100-105Zr and 104-111Mo. A second region (II) with open symbols that correspond to 106-112Zr and 112-117Mo, where we use values extracted from systematics, from SLy4 and from DZ-28, and a third region (III), 113-116Zr and 118-120Mo, where only calculated values are used.
In the first region (I) of both figures, the half-lives from prolate shapes are always larger than those from oblate shapes and both of them are larger than the half-lives from spherical nuclei. This feature can be easily understood from Figs. 7-8, where we can see how the GT strength contained in the energy region below is much lower in the prolate case than in the oblate and spherical cases. Comparison with the experiment in this region indicates that the trend observed in Zr isotopes is nicely reproduced by the prolate shapes with a tendency to overestimate the half-lives. In this region an oblate component that produces smaller half-lives would help in the agreement with experiment. In the case of the lighter Mo isotopes in region (I) the prolate shapes overestimate clearly the measured half-lives, while the oblate shapes underestimate them. A shape coexistence in lighter Mo isotopes would produce in this case a better agreement with experiment. In the middle region (II) we can see that the spread of the results due to the nuclear deformation is comparable with the spread due to the uncertainty in the value. Nevertheless, we can still perceive the tendency of the prolate (spherical) shapes to overestimate (underestimate) the half-lives with results from oblate shapes somewhat in between. One should also keep in mind that the experimental half-lives for 111,112Zr and for 116-117Mo are not properly measured values but extracted from systematics. In the third region (III) of heavier isotopes we obtain spherical or close to sphericity shapes. The predicted half-lives corresponding to these shapes are relatively large and almost flat. This tendency seems to be at variance with the tendency shown by the experimental half-lives extracted from systematics that continue decreasing. Measurements in this region will be crucial to determine whether isotopes in this mass region become spherical as we approach the magic neutron number.
In the next two figures we simplify the comparison of various calculations for the half-lives by showing only the most relevant ones. Thus, in Figs. 12 and 13 we compare the measured -decay half-lives with the calculations corresponding only to the ground states of the isotopes. For Zr isotopes in Fig. 12 we plot half-lives for prolate shapes for 100-112Zr and for spherical shapes for 113-116Zr. Similarly, for Mo isotopes in Fig. 13 we plot half-lives for prolate shapes for 104-107Mo, for oblate shapes for 108-117Mo, and for spherical shapes for 118-120Mo. Similar to the previous figures, one can also distinguish three regions according to the values used. In Fig. 12 for Zr isotopes we see again how the prolate ground state shapes describe well the pattern of the half-lives. Nevertheless the agreement can be improved by reducing somewhat the half-lives of the lighter isotopes with an oblate component predicted by the calculations. In the middle region, the experimental pattern is reasonably well reproduced by the calculations, but the SLy4 masses reproduce better the measured half-lives. Finally for the heavier isotopes the predicted half-lives corresponding to spherical nuclei are almost flat. In Fig. 13 for Mo isotopes, a shape coexistence of the prolate ground state shape with the excited oblate shape in the lighter Mo isotopes would produce in a better agreement with experiment. In the middle region, the oblate shapes reproduce quite satisfactorily the measurements and no big differences are found between the half-lives obtained by using SLy4 or experimental values. As in the case of Zr isotopes, the heavier spherical Mo isotopes predict relatively large half-lives that seems to deviate from the decreasing exhibit by the experimental values from systematics.
Our results for the half-lives and GT strength distributions in Zr isotopes agree well with the calculations by Yoshida yoshida_13 , where similar results are presented for even-even Zr isotopes within a self-consistent QRPA with Skyrme interactions, using only the strengths of the pairing interaction as extra parameters and a constant strength for the residual pairing interaction, which is fitted to reproduce the half-life of 100Zr. Our results agree also qualitatively with those in Ref. fang_13 for and in Zr and Mo isotopes, where QRPA calculations are performed using deformed Woods-Saxon potentials and realistic CD-Bonn residual forces. First-forbidden transitions were also considered in fang_13 , although it was found on the basis of the branching ratio for the forbidden decays that in this mass region their effect can be neglected.
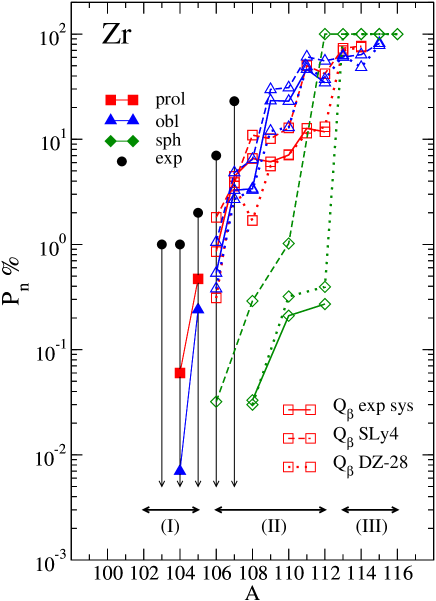
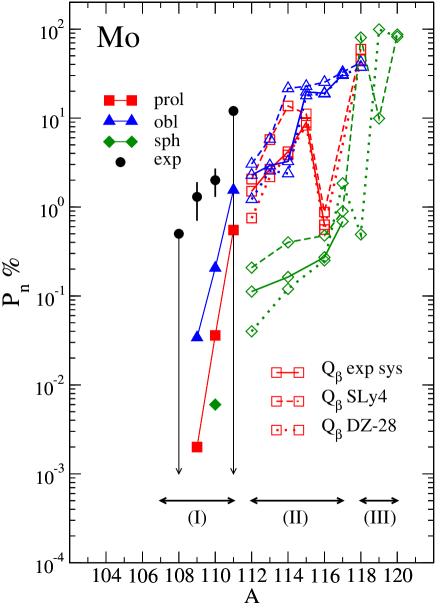
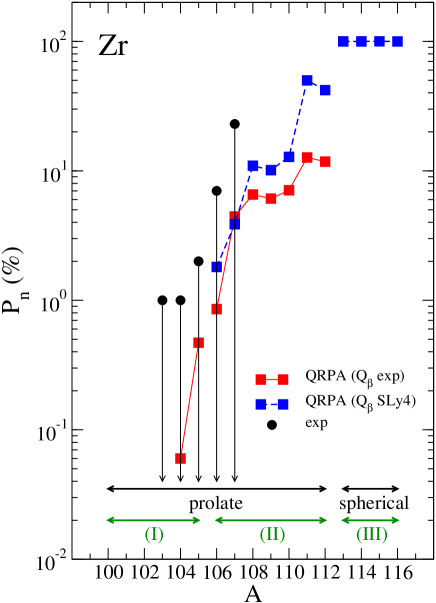
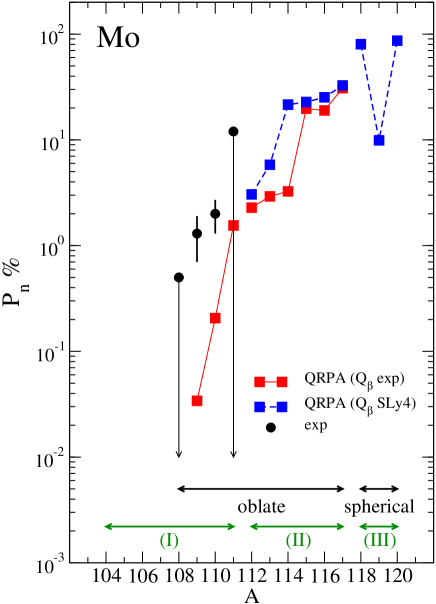
In the next figures (Figs. 14-17), we show the same type of information as in Figs. 10-13, but for the -delayed neutron-emission probabilities , expressed as a percentage. Experimental values pereira are only upper limits except for the cases 110,111Mo. In all cases the calculations underestimate the existing measurements. This means that in the range of isotopes where these measurements exist, the relative GT strength contained in the energy region below (above) is overestimated (underestimated) theoretically. The general isotopic trend observed is an increase of with , obviously related to the decrease of as we approach the neutron drip line. The behavior of for spherical shapes is somewhat special. It appears clearly below the deformed cases up to () in Zr (Mo) isotopes, and then suddenly it increases up to practically in the heavier isotopes. The origin of this behavior can be traced back to the profile of the accumulated strength distributions in spherical nuclei showing a sharp increase in Figs. 5-6 at variance with the smooth distribution of the deformed cases denoting the high fragmentation of the strength. It is also worth mentioning the extreme sensitivity of to in the case of spherical nuclei. Since most of the strength in spherical nuclei is very localized in energy, can change drastically if this strength is located a little bit above or a little bit below . Thus, we can see for example how in 112Zr changes from to when we use from DZ-28 (dotted lines) or from SLy4 (dashed lines). The values for 112Nb change from 2.92 MeV with SLy4 to 3.31 MeV for DZ-28 (Fig.9(c)), values that are respectively below and above the energy where the GT strength peaks in 112Zr (Fig.7). Similarly, the sharp change in between spherical 112Zr and 113Zr isotopes is related to the relative position of the strength with respect to , which appears below in 112Zr and above it in 113Zr (see Fig. 7).
Similar general comments are valid for Mo isotopes. In this case particular behaviors in the spherical case can be understood as well by means of the interplay between values and the energies where the GT strength is peaked. This is the case of 118Mo, where the low value found for DZ-28 is correlated to the high value of in Fig. 9(d). This is also the case of 119Mo, where the low value for SLy4 is due to the large value of . We can also mention the strange behavior of 116Mo in the prolate cases that decrease suddenly up to values similar to the spherical ones. This is related to the fact that the prolate deformation in this isotope has collapsed almost to a spherical shape as it can be seen in Fig. 2.
Finally, we can see in Figs. 16- 17 the percentage values, but showing only the most relevant information that considers only the ground state shapes, as it has been done in Figs. 12- 13. The general behavior discussed above can be seen more clearly in these simplified plots with increasing values for heavier isotopes that saturates to a value when the spherical shape becomes the ground state in the heavier isotopes with the particularity in the case of 119Mo discussed above.
IV CONCLUSIONS
A microscopic nuclear approach based on a deformed QRPA calculation on top of a self-consistent mean field obtained with the SLy4 Skyrme interaction has been used to study the decay properties of neutron-rich Zr and Mo isotopes. The nuclear model and interaction have been successfully tested in the past providing good agreement with the available experimental information on bulk properties all along the nuclear chart. Decay properties in other mass regions have been well reproduced as well. In this work we have studied even and odd isotopes, encompassing the whole isotopic chains 100-116Zr and 104-120Mo. The structural evolution in these isotopes has been studied from their PECs. We have found competing oblate and prolate shapes in the lighter isotopes and spherical shapes becoming ground states in the heavier. Then, Gamow-Teller strength distributions, -decay half-lives, and -delayed neutron emission probabilities corresponding to the equilibrium shapes of the respective isotopes have been computed.
The isotopic evolution of the GT strength distributions exhibit some typical features, such as the GT resonances that increase in energy and strength as the number of neutrons increase. Effects of deformation are hard to see on a global scale, but they become apparent in the low excitation energy below energies, a region that determines the half-lives. Half-lives have been calculated with experimental values of when available and with values extracted from mass models otherwise. The spread of the results due to the nuclear shape and to the lack of knowledge of is comparable. Thus, it is very important to continue measuring the masses of exotic nuclei to avoid these type of uncertainties. The half-lives are in general well described in the lighter and medium isotopes by using the ground state shapes, although they would improve a bit with some admixtures of the isomeric shapes. In this region, the half-lives obtained with spherical shapes are clearly below the experiment and the results from deformed shapes. For heavier isotopes where the half-lives have not been measured yet, the calculations predict a rather flat behavior corresponding to spherical ground states. values are not well reproduced. The calculations underestimate them although only upper limits are measured in most cases. Nevertheless, the general trend observed is followed when using deformed shapes, whereas spherical shapes produce extremely low values. The scenario changes suddenly in the heavier isotopes, where spherical shapes produce values of .
Thus, experimental information on the energy distribution of the GT strength is a valuable piece of knowledge about nuclear structure in this mass region. This is within the present perspectives in the case of the lighter isotopes considered in this work. Similarly, measuring the half-lives of the heavier isotopes will be highly beneficial to model reliably the r process and to constrain theoretical nuclear models. This possibility is also open within present capabilities at Riken.
Acknowledgements.
This work was supported by Ministerio de Economía y Competividad (Spain) under Contracts No. FIS2011–23565 and FPA 2011–24553 and the Consolider-Ingenio 2010 Programs CPAN CSD2007-00042. It was also supported in part by the Joint Institute for Nuclear Astrophysics (JINA) under NSF Grant No. PHY-02-16783 and the National Superconducting Cyclotron Laboratory (NSCL), under NSF Grant No. PHY-01-10253.References
- (1) J. L. Wood, K. Heyde, W. Nazarewicz, M. Huyse, and P. Van Duppen, Phys. Rep. 215, 101 (1992).
- (2) K. Heyde and J. L. Wood, Rev. Mod. Phys. 83, 1467 (2011).
- (3) J. Xiang, Z. P. Li, Z. X. Li, J. M. Yao, and J. Meng, Nucl. Phys. A873, 1 (2012).
- (4) H. Mei, J. Xiang, J. M. Yao, Z. P. Li, and J. Meng, Phys. Rev. C 85, 034321 (2012).
- (5) P. Bonche, H. Flocard, P.-H. Heenen, S. J. Krieger, and M. S. Weiss, Nucl. Phys. A443, 39 (1985).
- (6) M. Bender, G. F. Bertsch, and P.-H. Heenen, Phys. Rev. C 78, 054312 (2008).
- (7) M. Bender, K. Bennaceur, T. Duguet, P.-H. Heenen, T. Lesinski, and J. Meyer, Phys. Rev. C 80, 064302 (2009).
- (8) R. Rodriguez-Guzman, P. Sarriguren, L. M. Robledo, and S. Perez-Martin, Phys. Lett. B 691, 202 (2010).
- (9) R. Rodriguez-Guzman, P. Sarriguren, and L. M. Robledo, Phys. Rev. C 82, 044318 (2010); Phys. Rev. C 83, 044307 (2011).
- (10) T. Sumikama et al., Phys. Rev. Lett. 106, 202501 (2011).
- (11) H. Mach et al., Phys. Lett. B 230, 21 (1989); Phys. Rev. C 41, 350 (1990).
- (12) C. Goodin et al., Nucl. Phys. A787, 231c (2007).
- (13) W. Urban et al., Nucl. Phys. A689, 605 (2001).
- (14) P. Campbell et al., Phys. Rev. Lett. 89, 082501 (2002).
- (15) F. C. Charlwood et al., Phys. Lett. B 674, 23 (2009).
- (16) E. M. Burbidge, G. M. Burbidge, W. A. Fowler, and F. Hoyle, Rev. Mod. Phys. 29, 547 (1959).
- (17) J. J. Cowan, F.-K. Thielemann, and J. W. Truran, Phys. Rep. 208, 267 (1991).
- (18) K.-L. Kratz, J.-P. Bitouzet, F.-K. Thielemann, P. Möller, and B. Pfeiffer, Ap. J. 403, 216 (1993).
- (19) http://research.jyu.fi/igisol/JYFLTRAP_masses/
- (20) J. Pereira et al., Phys. Rev. C 79, 035806 (2009).
- (21) S. Nishimura et al., Phys. Rev. Lett. 106, 052502 (2011).
- (22) B. Pfeiffer, K.-L. Kratz, F.-K. Thielemann, and W. B. Walters, Nucl. Phys. A693, 282 (2001).
- (23) B. Sun, F. Montes, L. S. Geng, H. Geissel, Yu. A. Litvinov, and J. Meng, Phys. Rev. C 78, 025806 (2008).
- (24) J. Dobaczewski, W. Nazarewicz, T. R. Werner, J. F. Berger, C. R. Chinn, and J. Dechargé, Phys. Rev. C 53, 2809 (1996).
- (25) J. M. Pearson, R. C. Nayak, and S. Goriely, Phys. Lett. B 387, 455 (1996).
- (26) J. Engel, M. Bender, J. Dobaczewski, W. Nazarewicz, and R. Surman, Phys. Rev. C 60, 014302 (1999).
- (27) I. N. Borzov, J. J. Cuenca-García, K. Langanke, G. Martínez-Pinedo, and F. Montes, Nucl. Phys. A814, 159 (2008).
- (28) T. Niksic, T. Marketin, D. Vretenar, N. Paar, and P. Ring, Phys. Rev. C 71, 014308 (2005).
- (29) J. Krumlinde and P. Möller, Nucl. Phys. A417, 419 (1984).
- (30) P. Möller and J. Randrup, Nucl. Phys. A514, 1 (1990).
- (31) P. Möller, B. Pfeiffer, and K.-L. Kratz, Phys. Rev. C 67, 055802 (2003).
- (32) P. Möller, R. Bengtsson, B. G. Carlsson, P. Olivius, T. Ichikawa, H. Sagawa, and A. Iwamoto, At. Data Nucl. Data Tables 94, 758 (2008).
- (33) H. Homma, E. Bender, M. Hirsch, K. Muto, H. V. Klapdor-Kleingrothaus, and T. Oda, Phys. Rev. C 54, 2972 (1996).
- (34) M. Hirsch, A. Staudt, K. Muto, and H. V. Klapdor-Kleingrothaus, Nucl. Phys. A535, 62 (1991).
- (35) K. Muto, E. Bender, T. Oda, and H. V. Klapdor-Kleingrothaus, Z. Phys. A 341, 407 (1992).
- (36) F. Frisk, I. Hamamoto, and X.Z. Zhang, Phys. Rev. C 52, 2468 (1995).
- (37) P. Sarriguren, E. Moya de Guerra, A. Escuderos, and A. C. Carrizo, Nucl. Phys. A635, 55 (1998).
- (38) P. Sarriguren, E. Moya de Guerra, and A. Escuderos, Nucl. Phys. A691, 631 (2001).
- (39) P. Sarriguren and J. Pereira, Phys. Rev. C 81, 064314 (2010).
- (40) G. Audi et al., Chinese Physics C 36, 1157 (2012); 1603 (2012).
- (41) E. Chabanat, P. Bonche, P. Haensel, J. Meyer, and R. Schaeffer, Nucl. Phys. A635, 231 (1998).
- (42) M. V. Stoitsov, J. Dobaczewski, W. Nazarewicz, S. Pittel, and D. J. Dean, Phys. Rev. C 68, 054312 (2003).
- (43) D. Vautherin and D. M. Brink, Phys. Rev. C 5, 626 (1972); D. Vautherin, Phys. Rev. C 7, 296 (1973).
- (44) H. Flocard, P. Quentin, A. K. Kerman, and D. Vautherin, Nucl. Phys. A203, 433 (1973).
- (45) P. Sarriguren, E. Moya de Guerra, and A. Escuderos, Nucl. Phys. A658, 13 (1999).
- (46) P. Sarriguren, E. Moya de Guerra, and A. Escuderos, Phys. Rev. C 64, 064306 (2001).
- (47) P. Sarriguren, R. Alvarez-Rodríguez, and E. Moya de Guerra, Eur. Phys. J. A 24, 193 (2005).
- (48) A. Bohr and B. Mottelson, Nuclear Structure, Vols. I and II, (Benjamin, New York 1975).
- (49) N. B. Gove and M. J. Martin, Nucl. Data Tables 10, 205 (1971).
- (50) J. Skalski, S. Mizutori, and W. Nazarewicz, Nucl. Phys. A617, 281 (1997).
- (51) P. Möller, J. R. Nix, W. D. Myers, and W. J. Swiatecki, At. Data Nucl. Data Tables 59, 185 (1995).
- (52) G. A. Lalazissis, S. Raman, and P. Ring, At. Data Nucl. Data Tables 71, 1 (1999).
- (53) S. Hilaire and M. Girod, Eur. Phys. J. A 33, 237 (2007); http://www-phynu.cea.fr/.
- (54) E. Moya de Guerra, Phys. Rep. 138, 293 (1986).
- (55) S. Raman, C. W. Nestor, JR., and P. Tikkanen, At. Data Nucl. Data Tables 78, 1 (2001).
- (56) N. J. Stone, At. Data Nucl. Data Tables 90, 75 (2005).
- (57) Evaluated Nuclear Structure Data File (ENSDF), http://www.nndc.bnl.gov/ensdf/
- (58) E. Poirier et al., Phys. Rev. C 69, 034307 (2004).
- (59) E. Nácher et al., Phys. Rev. Lett. 92, 232501 (2004).
- (60) A. Jokinen, T. Enqvist, P. P. Jauho, M. Leino, J. M. Parmonen, H. Penttilä, J. Äystö, and K. Eskola, Nucl. Phys. A584, 489 (1995).
- (61) J. C. Wang et al., Eur. J. A 19, 83 (2004).
- (62) S. Rinta-Antila et al., Eur. J. A 31, 1 (2007).
- (63) K. Langanke and G. Martinez-Pinedo, Nucl. Phys. A673, 481 (2000).
- (64) P. Sarriguren, Phys. Rev. C 79, 044315 (2009).
- (65) P. Sarriguren, Phys. Lett. B 680, 438 (2009).
- (66) J. Duflo and A. P. Zuker, Phys. Rev. C 52, R23 (1995).
- (67) M. V. Stoitsov, J. Dobaczewski, W. Nazarewicz, and P. Ring, Comp. Phys. Comm. 167, 43 (2005).
- (68) K. Yoshida, Prog. Theor. Exp. Phys. 113D02 (2013).
- (69) D. L. Fang, B. A. Brown, and T. Suzuki, Phys. Rev. C 88, 024314 (2013).