Is getting the right answer just about choosing the right words? The role of syntactically-informed features in short answer scoring.
Abstract
Developments in the educational landscape have spurred greater interest in the problem of automatically scoring short answer questions. A recent shared task on this topic revealed a fundamental divide in the modeling approaches that have been applied to this problem, with the best-performing systems split between those that employ a knowledge engineering approach and those that almost solely leverage lexical information (as opposed to higher-level syntactic information) in assigning a score to a given response. This paper aims to introduce the NLP community to the largest corpus currently available for short-answer scoring, provide an overview of methods used in the shared task using this data, and explore the extent to which more syntactically-informed features can contribute to the short answer scoring task in a way that avoids the question-specific manual effort of the knowledge engineering approach.
1 Introduction
This paper aims to demonstrate that “higher-level” linguistic features that encode information such as syntactic relations, topics referenced, and response structure can make a contribution to the accuracy and validity of automated methods of short answer scoring. Although the results of a recent shared task on short answer scoring seem to indicate that lexical features alone cannot be improved upon, a more thorough examination of the performance of models using different sorts of features tells a different story. In support of this goal, we also provide an overview of the ASAP short-answer scoring competition, which has gone largely unnoticed in the community of NLP researchers working on educational applications.
Research on using computers to score open-ended student responses has a long history, dating back to Ellis Page’s work on automated scoring of essays [Page, 1966, Page, 1968]. Since the very beginning of this research field, there has been an awareness that agreement with human raters is a limited evaluation measure. Page’s work demonstrated that the length of an essay correlates strongly with human ratings. Such superficial measures can sometimes do surprisingly well as predictive mechanisms, despite the fact that they are only marginally related to the skills and attributes we aim to measure with a writing task (the test construct).
Given a sample of scored test-taker responses it is possible to identify many potentially measurable linguistic features that correlate well with score. Some of these features rely on advanced natural language processing, but many do not. Given the redundancy of information encoded in many of these features, and the difficulty of reliably measuring features that depend on advanced NLP, it is tempting to focus attention on superficial features that are easy to extract, and to hope that the redundancy will allow good prediction. However, a system that relies on superficial features as proxies for important underlying attributes will fail when it begins to see answers in which the measureable surface features are no longer correlated with the underlying attributes. Unfortunately, such answers are exactly what is to be expected when a sophisticated test-taking community begins to analyse the test in the search for simple ways to get good scores. Therefore, it is important to understand the potential of deeper features even when their predictive contribution to scoring in a research setting is limited.
The field of automated essay scoring has made advances in the intervening years, allowing the development of features related to various aspects of the writing construct, including lexical sophistication, discourse structure, syntactic variety, and grammatical accuracy (cf. ?); ?); ?); ?); ?); ?)). The addition of these features has not only improved the conceptual basis of scoring but also improved the accuracy of these systems according to traditional evaluation metrics.
Other automated scoring tasks have not yet progressed to the same level of maturity. In particular, not as much work has been focused to date on automated scoring of short-answer questions. Such questions are distinguished from essays by their brevity (eliciing responses of only a few words or a few sentences), and by the fact that they are scored according to response content, rather than quality of written expression. The scoring rubrics for short-answer questions often require specific information (e.g., scientific principles, trends in a graph, or details from a reading passage) to be included in a response for it to receive credit.
The task of short-answer scoring has received more attention recently, however, because short-answer questions are expected to figure prominently in new, computerized state tests currently under development with Race To the Top funding from the US Department of Education. As proved to be the case for the automated essay scoring task, results on the recent ASAP short answer scoring task (described later in Section 2.1) have demonstrated that superficial features (in this case, features related to the use of particular words in a response) are strongly predictive. We aim to re-examine the contribution of different sorts of predictive features on the same dataset of short-answer tasks on which these results were achieved, and demonstrate that attention to linguistic structure is empirically valuable in automated scoring of short answers.
2 Previous Work
Like the field of automated essay scoring, research on methods for automated scoring of short answer questions has a history that spans multiple decades. As early as 1988, Carlson & Ward examined the potential use of natural language processing for the “formulating hypotheses” task, a new item type under consideration for the GRE test that would ask students to list all of the possible explanations they could think of that would account for some observed phenomenon (for example, a steady reduction in the mortality rate for a particular population). While this is a somewhat unique item type, but it is quite similar in its fundamental scoring characteristics (the fact that it is scored according to the correctness or semantic appropriateness of a short, textual unit) to many other “short answer” tasks that have been considered more recently.
Research on automated scoring of short-answer tasks continued at the Educational Testing Service during the early 1990s [Kaplan, 1991, Kaplan and Bennett, 1994, Burstein and Kaplan, 1995], and received broader attention in the early 2000s, when a number of short answer scoring systems were developed, including ETS’ c-rater [Leacock and Chodorow, 2003], AutoMark [Mitchell et al., 2002], the Intelligent Essay Assessor [Landauer et al., 2003], the Oxford-UCLES system [Sukkarieh and Pulman, 2005], and applications developed at the University of Portsmouth [Callear et al., 2001] and the University of Manchester [Sargeant et al., 2004]. Some approaches to the task have relied heavily on knowledge engineering, involving manual creation of patterns to encapsulate correct answer types for particular questions [Callear et al., 2001, Sukkarieh and Pulman, 2005]. Other approaches have aimed to use more generic text similarity features to determine the distance between students’ responses and some “gold standard” answer or answers [Landauer et al., 2003, Pérez et al., 2005, Mohler et al., 2011, Meurers et al., 2011, Hahn and Meurers, 2012]. Hybrid systems have also been developed, in which some human involvement is required for task-specific pattern creation or annotation, but other components of the system use automatically-constructed features and statistical calibration [Mitchell et al., 2002, Leacock and Chodorow, 2003, Nielsen et al., 2008]. There has been a shift over time towards more fully-automated and statistically-based systems, and away from those relying on manual knowledge engineering, but the selection of methodology also depends on the exact type of short answer questions targeted by each system. For instance, the tasks addressed by ?) required answers to include specific well-defined concepts (see Figure 1), and were therefore more amenable to a knowledge engineering approach, whereas those addressed by Foltz et al. [Foltz et al., 2011] elicited longer, less-constrained responses (see Figure 2), and were scored according to the evidence students gave of their “depth of knowledge”, rather than for specific, correct concepts.
Question: Why are some wildflowers highly scented with brightly colored petals? Rubric Answer: To attract insects
Question: Explain how cows, grasses and bacteria interact within an environment, In your explanation, be sure to include • The role of each of the organisms in the environment • How the organisms depend on one another
Some of these systems have recently seen operational use for scoring consequential tests. Foltz [Foltz and Lochbaum, 2010] reported that Pearson’s Intelligent Essay Assessor was being used to score science questions on the Maryland State Assessment. Leacock and Chodorow [Leacock and Chodorow, 2003] also cite the use of ETS’ c-rater in a state assessment context. More opportunities for the use of such systems in consequential testing systems are likely to emerge in coming years, as well, as more state tests move from paper-and-pencil administration to online formats, and as new multi-state tests are developed. Two state consortia (known as PARCC111http://smarterbalanced.org/ and Smarter Balanced222http://parcconline.org/) have received funding from the US Department of Education to develop next-generation tests that can be used in multiple states, and incorporate innovative technology to address a new set of standards for what children at different grades should know and be able to do (the Common Core State Standards333http://corestandards.org/). These tests are slated to be launched in the 2014-2015 school year, and have explicitly included the automated scoring of open-ended tasks as one of their design desiderata.
Partly as a result of this increased commercial interest in the automated scoring of short-answer questions, recent efforts have arisen to empirically assess the state of the art in this field, and to compare the performance of available systems. One of these is the “Joint Student Response Analysis and 8th Recognizing Textual Entailment Challenge” at SEMEVAL-2013, which added a new corpus of student answers from the tutorial dialog context to the set of textual entailment evaluation corpora [Dzikovska et al., 2012].
The second organized effort to compare methods for short-answer scoring is the The Automated Student Assessment Prize, the outcomes of which directly motivate the current study, and from which the data used here are drawn.
2.1 The Automated Student Assessment Prize
The Automated Student Assessment Prize (ASAP) is an effort funded by the Hewlett Foundation, and organized by Open Educational Solutions, to assess the current state of capabilities for automated scoring of a wide range of open-ended student response tasks. The short-answer scoring competition conducted in 2012 is the second in a series of such evaluations, with the first phase having focused on essay-length responses [Shermis and Hamner, 2012], and future phases under discussion. For both phases of the ASAP competition, states participating in the multi-state assessment consortia mentioned above have cooperated by providing student responses to use as data. The set of responses these states have shared through the ASAP competition is the largest publicly-available dataset for developing and evaluating automated methods for scoring of short-answer questions to date.
The organizers elected to host the competition through Kaggle444http://kaggle.com, an online platform for posting and running competitions (which typically involve computational modeling). The Hewlett Foundation provided a $100,000 prize fund for the competition, and the contest rules required that participants release all model submissions under open-source licenses in order to be eligible for the cash prizes. The contest training data was released in late June, 2012, and the 256 participating teams had approximately 9 weeks in which to develop their scoring methods. Once the test data was released (without human scores), participants had approximately one week to compute and submit their final score predictions. All score predictions were required to be rounded to integers. Most individuals or teams participating in the competition did so under pseudonyms, so it is not entirely clear what areas of expertise might have been reflected in the field. However, since the tasks hosted on Kaggle typically do not involve text processing, it is likely that many participants had more experience with machine learning and applied statistics training than with natural language processing.
The final rankings of prize-winning teams participating in the ASAP short-answer scoring challenge are listed in Table 1, ranked by final weighted kappa on the test set averaged across questions. The top prize winner, Luis Tandalla, invested a great deal of manual effort in developing regular expressions to cover many key concepts that were referenced in student responses, and then trained a top-level regression model to score responses based on the presence of these concepts and the predictions of base models using lexical features only [Tandalla, 2012]. The remaining four prize winners developed models that were quite similar in structure to one another, also using a stacked prediction architecture. Each of these models used low-level classifiers to model the scores of responses based on lexical features (the presence of particular words, stems, ngrams, or character sequences), and the predictions of these classifiers were combined using one or more higher-level models [Zbontar, 2012, Conort, 2012, Jesensky, 2012, Peters and Jankiewicz, 2012]. Some models incorporated other features in addition to the standard base learners using lexical information, as indicated in Table 1.
| Team | Aggregate | Features |
| Weighted | of Base | |
| Kappa | Learners | |
| L. Tandalla | 0.74717 | Lexical features Task-specific regexes |
| J. Zbontar | 0.73892 | Lexical features Reduced-dimensionality lexical features |
| X. Conort | 0.73662 | Lexical features Reduced-dimensionality lexical features Word frequency Text well-formedness Response length |
| J. Jesensky | 0.73392 | Lexical features Response length |
| J. Peters P. Jankiewicz | 0.73094 | Lexical features Reduced-dimensionality lexical features Response length |
These results demonstrate a number of points about the short answer scoring task, at least as presented in ASAP:
-
1.
Lexical features—which specific words and word sequences are used in a response—are strongly predictive of human scores, and can predict these scores even without other features.
-
2.
A predictive model architecture using stacked classifiers [Wolpert, 1992] seems to work well for this task—perhaps because providing different “views” of the feature set helps to address the sparsity of lexical features.
-
3.
Model performance can be improved somewhat by investing a great deal of effort to model specific response patterns (with regular expressions, for example), although such an approach would not scale well to large numbers of questions.
In sum, the results of the ASAP competition suggest that relatively superficial methods of automated short response scoring (leveraging lexical features alone), can do quite well, and that while it is possible to improve somewhat on such models, the methods needed to do so are not scalable in any case. The purpose of this paper is to more closely examine the potential contribution of syntactically informed features, that attempt to model response patterns above the lexical level, and to investigate whether such features can be developed in a generic way, so that manual work is not required to support scoring responses to each new question.
3 Data
The data set used in this study was the same one used in the ASAP short answer scoring challenge described above. The questions and student responses in this data set were contributed by multiple state education departments, although the names of the participating states were not provided by the organizers of the competition. The organizers did report that students’ responses to some questions were entered on a computer, while responses to other questions were provided in handwritten form (and later transcribed).
The data set contains ten different short-answer questions, differing in characteristics such as subject area, average response length, and scoring scale, as shown in Table 2. All of the ASAP questions were administered at Grade 10 in the US, except for question 10, which was administered in Grade 8. For each question, a rubric is also provided, which outlines the criteria for assigning scores to responses.555More detailed information about the ASAP questions and scoring guidelines is posted on the Kaggle site for the competition: http://kaggle.com/c/asap-sas/data/. The ASAP short answer data set is an important new resource for researchers working on analyzing short-answer questions responses. However, a few points are worth mentioning as context for the results of any studies using the corpus. First, the data capture process for one question resulted in an artifact into the responses that cannot be straightforwardly reversed. Space characters have been inserted, seemingly at random, into the responses to question 10, often creating artificial breaks within words. Second, a small number of responses seem to have been truncated, leaving only a short initial substring in place of the complete student response. (This speculation is based upon the observation that certain very short, seemingly incomplete responses received very high scores from both raters.) Finally, note that the human agreement reported here is substantially higher for some tasks than has been observed in previously-reported studies using short-answer questions. More information about states’ scoring practices would help to clarify whether the two human ratings of these responses were truly provided independently of one another in all cases. The organizers report that each response was scored by two independent human raters, and Table 2 also reports the agreement between these raters (on the training set) using the quadratic weighted kappa measure widely used in studies of open-ended response scoring (cf. ?); ?)).
| Question No. | Subject | No. Responses | Ave. Wds./Response | Score | Human Agmt. | ||
| Area | Train | Leaderboard | Test | (Train Set) | Scale | (Weighted ) | |
| 1 | Science | 1672 | 557 | 558 | 47.1 | 0–3 | 0.939 |
| 2 | Science | 1278 | 426 | 426 | 59.2 | 0–3 | 0.922 |
| 3 | ELA666English Language Arts | 1808 | 406 | 318 | 47.7 | 0–2 | 0.746 |
| 4 | ELA | 1657 | 295 | 250 | 40.2 | 0–2 | 0.738 |
| 5 | Biology | 1795 | 598 | 599 | 25.1 | 0–3 | 0.950 |
| 6 | Biology | 1797 | 599 | 599 | 23.4 | 0–3 | 0.961 |
| 7 | ELA | 1799 | 599 | 601 | 41.1 | 0–2 | 0.970 |
| 8 | ELA | 1799 | 599 | 601 | 53.0 | 0–2 | 0.858 |
| 9 | ELA | 1798 | 599 | 600 | 49.7 | 0–2 | 0.810 |
| 10 | Science | 1640 | 546 | 548 | 41.4 | 0–2 | 0.883 |
The responses to each ASAP task were divided by the organizers into three partitions. The training partition contains approximately 60% of the responses to each question, and was intended to be used for direct parametrization of automated scoring models developed for the challenge. Participants were provided with both sets of human scores to all responses in the training partition. The leaderboard partition contains another 20% of the responses. The texts of the leaderboard responses were available to participants throughout the challenge, but the human scores for these responses were not. However, participants could submit their score estimates for leaderboard responses through a web interface (at most, twice per day) to learn how well these estimates agreed with human scores on the leaderboard set, and to be ranked on a publicly visible “leaderboard” on this basis. Finally, the remaining 20% of the responses made up the test partition, which was provided to participants without human scores at the very end of the competition, and which was used as the basis for final rankings of systems.
4 Model
The features described in the following section were used to train a variety of different regression models to estimate the score to be assigned to each response:
-
•
simple least-squares linear regression,
-
•
ridge regression,
-
•
support vector regression (with an RBF kernel),
-
•
random forests, and
-
•
gradient boosting.
The parameters used in model training were determined by cross-validation within the training set.
This setup is consistent with the popular modeling approach of stacking used in the ASAP competition, in which individual predictive features used by the top-level model are themselves the outputs of classification or regression models (as are many of the features described in Section 5). And as many participants chose to do in the ASAP competition, we have also included a model variant which uses an ensemble as the top-level model, in which the unrounded outputs of all five of the simple regression models are averaged to produce the final ensemble prediction. For all models, rounding of scores is done as the final step.
5 Features
5.1 BASE Features
The four classes of features described in this section constitute the “BASE” set, which is intended to be representative of the features commonly included in high-performing models from the ASAP challenge.
5.1.1 Bag of Words Features
The first set of base features included in our stacking classifier is a feature that is itself the output of a model trained to predict human scores based on the presence of specific words. Such a bag-of-words model using random forest regression was provided by the competition organizers as a baseline for the ASAP challenge.
Using the same methodology as the simple bag-of-words models, we also included two features based on bags of character ngrams. Character ngrams tend to be useful for this task, because they capture lexical information in a way that is insensitive to spelling errors.
Finally, we include two bag-of-stems features, trained using the same method as above, but with all words pre-processed using the Porter stemming algorithm.
These three feature sets together will be referred to below as Bag of Words (BOW) features.
5.1.2 LDA Features
For each question, two LDA topic spaces were constructed using the MALLET toolkit [McCallum, 2002], one with 30 dimensions, and one with only ten. The weight of each of these 40 topics for a given response was used as a feature. These features are meant to be roughly comparable to the reduced-dimensionality lexical features used by ASAP participants.
5.1.3 Well-formedness Features
Five features were used to represent the degree to which each response consisted of well-edited, grammatical English text. These features were based on the count of errors identified in four different categories, as identified automatically by a system for grammatical error detection [Attali and Burstein, 2006], as well as a feature representing the sum across error categories.
5.1.4 Length Features
Three features were used to represent length: the number of characters, words, and sentences in each response.
5.2 Syntactically-informed Features
The four additional categories of features described in this section are more “syntactically-informed” than those in the BASE set, because they encode information about word sequences, syntactic units or discourse units.
5.2.1 Ngram Features
This feature class included three “bag-of-ngram” features analogous to the bag-of-words features described above. Each included the top 1000 most frequent unagrams, bigrams and trigrams in a regression model trained to predict the human score. The three feature variants used random forests, support vector machines, and ridge regression.
5.2.2 Language Model Features
Three features were included based on language models built using the IRST Language Modeling Toolkit [Federico et al., 2008]. Language models were trained on responses to each question that received the highest score, one of the two highest scores, and the score of zero. The perplexity of a response with respect to each of these models was used as a feature.
5.2.3 Dependency Features
This feature class included six “bag-of-dependency” features. Each included the top 1000 most frequent dependency triples (and possibly other items; see below) extracted from responses in the training set using the Stanford parser [Klein and Manning, 2003] in a regression model trained to predict the human score. The feature variants included models incorporating dependencies only, dependencies and single words, and dependencies combined with “partial” dependencies (a lexical head associated with a dependency relation, but not the other head with which it is associated). Each of the three variants was implemented with both random forests and support vector machines, yielding a total of six features.
5.2.4 -Nearest Neighbors features
Two features were developed that relate to the similarity of word sequences used to respond to a question by different examinees. To represent the similarity between responses, we used a symmetric version of the BLEU score . We then defined two features based on the set of eight training responses most similar to a given response: the average score of these eight nearest neighbors, and the distance-weighted average score.
5.2.5 Discourse Segment Features
This final feature class included five features based on a system for segmenting short-answers into meaningful sub-units based on regular expressions. This model parses out sentences or clauses set off using bullets, numbering, or discourse connectives such as furthermore or however. The features used are the count of the total number of discourse units identified, the length of any numbered list identified, the highest number identified associated with a numbered bullet, and the number of discourse units headed by discourse markers in two categories (the finally category indicating a conclusion, and the furthermore category indicating supplemental information).
6 Experiments
First, in order to demonstrate the strong performance of the ensemble model on this data set relative to single top-level regression models, we trained each model on the BASE feature set (cf. Section 5.1). As Table 3 indicates, the ensemble of regressors outperforms any individual model on two of the three metrics, and is barely edged by gradient boosting on to the third metric.
The results reported in Table 3 are aggregated across all ten ASAP questions, using three different metrics. The average correlation of unrounded predicted scores with human scores provides the most precise measure of model performance, since information is lost in the rounding process, and in many testing contexts an unrounded item score could be used directly to construct total test scores. The average quadratic weighted kappa, computed using rounded predictions, is provided for comparison. Finally, we also report the “official” metric used in the ASAP short-answer scoring competition, in which weighted kappas for each task are manipulated with the Fisher transform before averaging:
| Model Type | Average | Average | ASAP |
|---|---|---|---|
| Correl. | Weighted | Weighted | |
| Kappa | Kappa | ||
| linear regression | 0.775 | 0.740 | 0.749 |
| ridge regression | 0.785 | 0.746 | 0.755 |
| RBF-SV regression | 0.756 | 0.719 | 0.726 |
| random forest | 0.779 | 0.739 | 0.746 |
| gradient boosting | 0.785 | 0.751 | 0.761 |
| ensemble | 0.789 | 0.752 | 0.759 |
In order to determine the effect of different feature categories on overall performance, we then compared variants of the ensemble model using the BASE feature set with variants that employed more features, individually adding in each of the other feature categories described above. These results, as well as the performance results for a model including ALL available features, are indicated in Table 4.
| Feature Set | Average | Average | ASAP |
|---|---|---|---|
| Correl. | Weighted | Weighted | |
| Kappa | Kappa | ||
| BOW Only | 0.787 | 0.745 | 0.753 |
| BASE | 0.789 | 0.752 | 0.759 |
| BASE+NGRAMS | 0.789 | 0.749 | 0.756 |
| BASE+KNN-BLEU | 0.790 | 0.752 | 0.759 |
| BASE+SEGMENTS | 0.790 | 0.753 | 0.761 |
| BASE+LM | 0.792 | 0.750 | 0.758 |
| BASE+DEPS | 0.793 | 0.758 | 0.767 |
| ALL | 0.795 | 0.758 | 0.768 |
As Table 4 shows, each of the new features added to the BASE set adds some incremental predictive power to the model, except for the bag-of-ngrams features, which slightly degrade performance vs. the baseline. The greatest increase in performance for a single feature class comes from the inclusion of dependency-based features, which yields a modest increase in all three measures. The addition of all five features to the BASE feature set increases the overall weighted kappa using the ASAP contest metric by approximately 0.009 to 0.768. This increase may be small, but it is not negligible, considering the magnitude of differences between top-ranked participants. (The difference between places 1 and 10 in the final ranking of participants on the public leaderboard was only 0.011.) Note that the BASE feature set performs slightly better than a model using only bag-of-words features (including features based on stems and character ngrams).
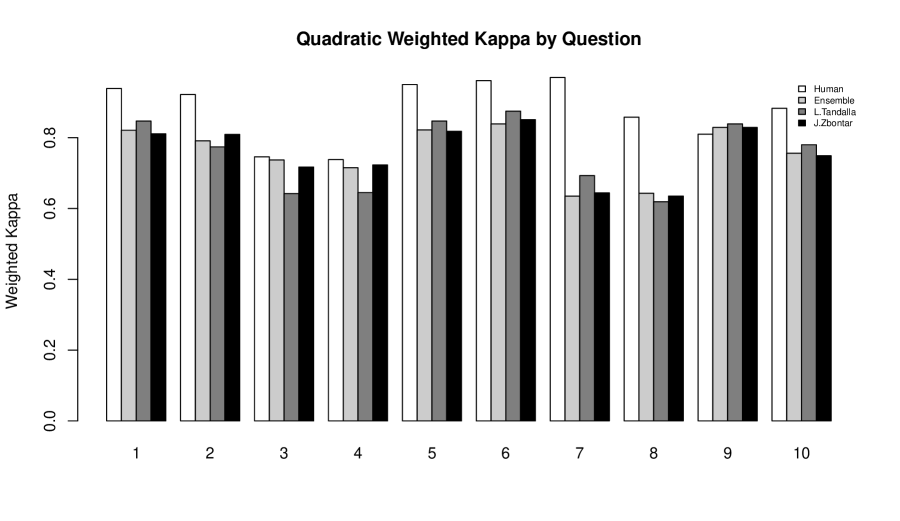
Figure 3 shows the performance of the ensemble model across all ten ASAP questions, as well as the cross-task performance of two top-ranked systems from the competition777Since participants made their code available as open source, we were able to reproduce their models and generate more detailed statistical evaluations.. The agreement of predicted scores and human scores varies both according to the reliability of human scoring (cf. Table 2) and according to the difficulty of modeling the distinctions made in the scoring rubrics for each question. For example, questions 7 and 8 call for students to draw conclusions based on a reading passage, and to support those conclusions with examples. In part because of the supra-lexical semantic requirements this imposes on responses, the reliability of automated scoring lags behind that of human scoring for these items. By contrast, questions 5 and 6 ask students to list specific biological concepts or processes, and for these items automated scoring performance is higher both in absolute terms and relative to human scoring.
7 Conclusions and Discussion
7.1 Performance relative to ASAP systems
The first point to note in connection with the results reported above is that the final ensemble model’s prediction accuracy on the ASAP leaderboard data is lower than the highest scores posted during the competition itself. The top final weighted kappa score on the ASAP public leaderboard was 0.772, compared to our result of 0.768. There are a number of reasons for this.
Firstly, stacking models such as our ensemble model and the models applied by the top-ranked ASAP participants have a number of free parameters that can be iteratively manipulated in order to improve the models’ performance. Learning parameters of the base-level and top-level regression models can be tweaked, features can be added or removed, and feature variants can be introduced in order to optimize prediction results. Since ASAP participants had the opportunity to submit predictions to the Kaggle server twice a day for two months (receiving performance measures on the leaderboard set each time), there was ample opportunity to fit these parameters to the leaderboard data. In contrast, the models described here were not optimized in any way using information from the leaderboard set. While the ASAP challenge also had an independent test set (the “private leaderboard”), the human scores on that set have not been released publicly, so it could not be used for the current study.
The second reason why the ensemble model’s performance trails that of the top ASAP models is that it uses exactly the same features and parameterization across all ten questions. Because our aim was to examine the contribution of different feature categories to overall scoring accuracy, rather than to achieve the highest possible scoring accuracy through model optimization, we did not optimize the configuration of the model to each question individually (as most ASAP participants did).
Finally, in contrast to some ASAP systems, our ensemble model does not use any special method for rounding of scores; scores are simply truncated to the allowable range, and rounded to the nearest integer. As noted above, unrounded scores are more appropriate for most testing purposes.
7.2 Role of syntactically-informed features
The question this paper set out to address was to reexamine the seeming lesson of the ASAP short answer scoring challenge, that lexical features alone could not be improved upon except by investing considerable effort in task-specific knowledge engineering. The results presented in Table 4 above indicate that more syntactically-informed features can, indeed, contribute to improved short-answer scoring performance. The use of all new features together improves the aggregate weighted kappa by about 0.009, with the greatest increase coming from the incorporation of syntactic dependency information, the feature class with the clearest link to syntax. This is particularly remarkable given that many student answers contain numerous misspellings and grammatical errors, making them difficult to parse reliably.
The incremental predictive value of these features was modest, but there may be motivation for including such features in short-answer scoring systems beyond their empirical effects on scoring accuracy. Since the scoring rubrics for these items claim to be sensitive to characteristics of responses beyond simple word choice, including higher-level features will improve the systems’ validity, the degree to which it will actually measure the skills and knowledge that items are supposed to test. If students are not able to get a high score simply by producing a response that includes relevant vocabulary, this will reduce the risk of negative washback, or unproductive learning strategies directed solely toward optimizing test performance.
7.3 Future work
There are a number of areas in which this work could be extended. First, of course, the use of syntactic dependencies does not come close to exhausting the space of feature types that more directly reflect the syntactico-semantic relationships that short answers are supposed to encode. Features based on semantic role labeling and paraphrase detection, for example, may offer additional benefits. There may also be some gains to be had from tailoring features to a particular content area (for example, Biology or reading comprehension).
Another important question to address is how the particular setting of the ASAP task affects the results achieved. Parameters such as training sample size, the number of tasks to be modeled concurrently, and the content areas to be scored, could significantly influence the findings.
References
- [Attali and Burstein, 2006] Yigal Attali and Jill Burstein. 2006. Automated essay scoring with e-rater v.2. Journal of Technology, Learning, and Assessment, 4(3).
- [Attali et al., 2010] Yigal Attali, Brent Bridgeman, and Cathy Trapani. 2010. Performance of a generic approach in automated essay scoring. Journal of Technology, Learning, and Assessment, 10(3).
- [Burstein and Kaplan, 1995] Jill Burstein and Randy M. Kaplan. 1995. GE FRST evaluation report: How well does a statistically-based natural language processing system score natural language constructed responses? ETS Research Report No. RR-95-29. Educational Testing Service.
- [Callear et al., 2001] David Callear, Jenny Jerrams-Smith, and Victor Soh. 2001. CAA of short non-MCQ answers. In Proceedings of the 5th International CAA Conference, Loughborough, UK. Loughborough University.
- [Carlson and Ward, 1988] Sybil B. Carlson and William C. Ward. 1988. A new look at formulating hypotheses items. GRE Board Professional Report No. 85-14P; ETS Research Report 88-12. Educational Testing Service.
- [Conort, 2012] Xavier Conort. 2012. Short answer scoring: Explanation of Gxav solution. ASAP Short Answer Scoring Competition System Description. Downloaded from http://kaggle.com/asap-sas/.
- [Dzikovska et al., 2012] Myroslava O. Dzikovska, Rodney D. Nielsen, and Chris Brew. 2012. Towards effective tutorial feedback for explanation questions: A dataset and baselines. In Proceedings of the 2012 Conference of the North American Chapter of the Association for Computational Linguistics: Human Language Technologies, pages 200–210, Montréal, Canada, June. Association for Computational Linguistics.
- [Elliot, 2003] Scott Elliot. 2003. Intellimetric: From here to validity. In Mark D. Shermis and Jill Burstein, editors, Automated essay scoring: A cross-disciplinary perspective, pages 71–86. Lawrence Erlbaum Associates, Inc., Hillsdale, NJ.
- [Federico et al., 2008] Marcello Federico, Nicola Bertoldi, and Mauro Cettolo. 2008. IRSTLM: an open source toolkit for handling large scale language models. In Proceedings of Interspeech 2008, pages 1618–1621.
- [Foltz and Lochbaum, 2010] Peter Foltz and Karen Lochbaum. 2010. AI scoring MSA science. Paper presented at the meeting of the Maryland Assessment Group. Ocean City, MD.
- [Foltz et al., 2011] Peter Foltz, Karen Lochbaum, and Mark Rosenstein. 2011. Analysis of student writing for a large scale implementation of formative assessment. Paper presented at the National Council for Measurement in Education. New Orleans, LA.
- [Hahn and Meurers, 2012] Michael Hahn and Detmar Meurers. 2012. Evaluating the meaning of answers to reading comprehension questions: A semantics-based approach. In Proceedings of the Seventh Workshop on Building Educational Applications Using NLP, pages 326–336, Montréal, Canada, June. Association for Computational Linguistics.
- [Jesensky, 2012] James Jesensky. 2012. Team JJJ technical methods paper. ASAP Short Answer Scoring Competition System Description. Downloaded from http://kaggle.com/asap-sas/.
- [Kaplan and Bennett, 1994] Randy M. Kaplan and Randy E. Bennett. 1994. Using the free-response scoring tool to automatically score the formulating-hypotheses item. ETS Research Report No. RR-94-08. Educational Testing Service.
- [Kaplan, 1991] Randy M. Kaplan. 1991. Using a trainable pattern-directed computer program to score natural language item responses. ETS Research Report No. RR-91-31. Educational Testing Service.
- [Klein and Manning, 2003] Dan Klein and Christopher D. Manning. 2003. Accurate unlexicalized parsing. In Proceedings of the 41st Annual Meeting of the Association for Computational Linguistics, pages 423–430, Sapporo, Japan, July. Association for Computational Linguistics.
- [Landauer et al., 2003] Thomas K. Landauer, Darrell Laham, and Peter W. Foltz. 2003. Automated scoring and annotation of essays with the Intelligent Essay Assessor. In Mark D. Shermis and Jill Burstein, editors, Automated essay scoring: A cross-disciplinary perspective, pages 87–112. Lawrence Erlbaum Associates, Inc., Hillsdale, NJ.
- [Leacock and Chodorow, 2003] Claudia Leacock and Martin Chodorow. 2003. C-rater: Scoring of short-answer questions. Computers and the Humanities, 37(4):389–405.
- [McCallum, 2002] Andrew Kachites McCallum. 2002. Mallet: A machine learning for language toolkit. http://mallet.cs.umass.edu.
- [Meurers et al., 2011] Detmar Meurers, Ramon Ziai, Niels Ott, and Janina Kopp. 2011. Evaluating answers to reading comprehension questions in context: Results for German and the role of information structure. In Proceedings of the TextInfer 2011 Workshop on Textual Entailment, pages 1–9, Edinburgh, Scottland, UK, July. Association for Computational Linguistics.
- [Mitchell et al., 2002] Tom Mitchell, Terry Russell, Peter Broomhead, and Nicola Aldridge. 2002. Towards robust computerized marking of free-text responses. In Proceedings of the Sixth International Computer Assisted Assessment Conference, Loughborough University, Loughborough, UK.
- [Mohler et al., 2011] Michael Mohler, Razvan Bunescu, and Rada Mihalcea. 2011. Learning to grade short answer questions using semantic similarity measures and dependency graph alignments. In Proceedings of the 49th Annual Meeting of the Association for Computational Linguistics: Human Language Technologies, pages 752–762, Portland, Oregon, USA, June. Association for Computational Linguistics.
- [Nielsen et al., 2008] Rodney D. Nielsen, Wayne Ward, and James H. Martin. 2008. Classification errors in a domain-independent assessment system. In Proceedings of the Third Workshop on Innovative Use of NLP for Building Educational Applications, pages 10–18, Columbus, Ohio, June. Association for Computational Linguistics.
- [Page, 1966] Ellis B. Page. 1966. The imminence of grading essays by computer. Phi Delta Kappan, 48:238–243.
- [Page, 1968] Ellis B. Page. 1968. The use of the computer in analyzing student essays. International Review of Education, 14(2):210–225.
- [Pérez et al., 2005] Diana Pérez, Enrique Alfonseca, Pilar Rodríguez, Alfio Gliozzo, Carlo Strapparava, and Bernardo Magnini. 2005. About the effects of combining latent semantic analysis with natural language processing techniques for free-text assessment. Revista Signos, 38(59):325–343.
- [Peters and Jankiewicz, 2012] Jonathan Peters and Paweł Jankiewicz. 2012. The William and Flora Hewlett Foundation Automated Student Assessment Prize (ASAP). ASAP Short Answer Scoring Competition System Description. Downloaded from http://kaggle.com/asap-sas/.
- [Sargeant et al., 2004] John Sargeant, Mary McGee Wood, and Stuart M. Anderson. 2004. A human-computer collaborative approach to the marking of free text answers. In Proceedings of the 8th International CAA Conference, Loughborough, UK. Loughborough University.
- [Shermis and Hamner, 2012] Mark D. Shermis and Ben Hamner. 2012. Contrasting state-of-the-art automated scoring of essays: Analysis. In Paper presented at Annual Meeting of the National Council on Measurement in Education, Vancouver, Canada, April.
- [Sukkarieh and Pulman, 2005] Jana Sukkarieh and Stephen Pulman. 2005. Information extraction and machine learning: Automarking short free text responses to science questions. In Proceedings of the 12th International Conference on Artificial Intelligence in Education (AIED), Amsterdam, The Netherlands.
- [Tandalla, 2012] Luis Tandalla. 2012. Scoring short answer essays. ASAP Short Answer Scoring Competition System Description. Downloaded from http://kaggle.com/asap-sas/.
- [Williamson et al., 2012] David Williamson, Xiaoming Xi, and F. Jay Breyer. 2012. A framework for evaluation and use of automated scoring. Educational Measurement: Issues and Practice, 31(1):2–13.
- [Wolpert, 1992] David H. Wolpert. 1992. Stacked generalization. Neural Networks, 5:241–259.
- [Yannakoudakis et al., 2011] Helen Yannakoudakis, Ted Briscoe, and Ben Medlock. 2011. A new dataset and method for automatically grading ESOL texts. In Proceedings of the 49th Annual Meeting of the Association for Computational Linguistics: Human Language Technologies, pages 180–189, Portland, Oregon, USA, June. Association for Computational Linguistics.
- [Zbontar, 2012] Jure Zbontar. 2012. Short answer scoring by stacking. ASAP Short Answer Scoring Competition System Description. Downloaded from http://kaggle.com/asap-sas/.