Reactor antineutrino experiments
Abstract
Neutrinos are elementary particles in the standard model of particle physics. There are 3 flavors of neutrinos that oscillate among themselves. Their oscillation can be described by a 33 unitary matrix, containing three mixing angles , , , and one CP phase. Both and are known from previous experiments. was unknown just two years ago. The Daya Bay experiment gave the first definitive non-zero value in 2012. An improved measurement of the oscillation amplitude = and the first direct measurement of the mass-squared difference = were obtained recently. The large value of boosts the next generation of reactor antineutrino experiments designed to determine the neutrino mass hierarchy, such as JUNO and RENO-50 .
keywords:
antineutrino,Daya Bay, , mass hierarchyPACS numbers: 14.60.Pq, 29.40.Mc, 13.15.+g
1 Introduction
The neutrino is a fundamental particle and was first discovered in 1956 by Cowan and Reines [1],[2]. In the last few decades, it has been proven that the observed neutrino oscillations can be described in a 3-flavor neutrino framework. A parameterization of the standard Pontecorvo-Maki-Nakagawa-Sakata (PMNS) matrix describing the unitary transformation relating the mass and flavor eigenstates, defines the three mixing angles (, , and ) and one charge-parity(CP)-violating phase [3],[4]. is about 34º and determined by solar and reactor neutrino experiments. is about 45º and determined by atmospheric and accelerator neutrino experiments. An upper limit of the last unknown angle was given by CHOOZ 0.15 at 90% confidence level (C.L.)[5]. It was hinted to be non-zero by recent results from the T2K [6], MINOS [7] and Double Chooz experiments[8]. The value of will guide the designs of future experiments for the measurements of the mass hierarchy and CP-violation.
Long-baseline accelerator experiments have limited sensitivity to the mixing angle due to dependencies on the yet unknown mass hierarchy and CP-violating phase. Reactor antineutrino experiments can provide a clear and accurate measurement of , due to their pure antineutrino source, clear signal and independence of the CP phase and matter effects. For reactor-based antineutrino experiments, can be determined in terms of the survival probability of at certain distances from the reactors,
| (1) |
where 1.267 L(m)/E(MeV), E is the energy in MeV and L is the distance in meters between the source and the detector. is the difference between the mass-squares of the mass eigenstates and ( = - ). Since [9], the short distance ( km) reactor oscillation is mainly determined by the terms.
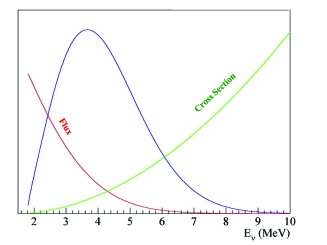
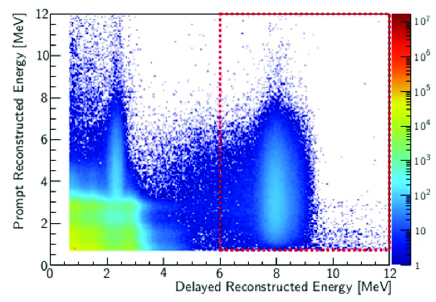
Most reactor antineutrino oscillation experiments measure antineutrino events via the inverse beta decay(IBD) reaction . The IBD reaction is characterized by two time correlated events, the prompt signal coming from the production and subsequent annihilation of the positron, and the delayed signal from the capture of the neutron in the liquid scintillator. For the Daya Bay experiment, 0.1% gadolinium (Gd)-doped liquid scintillator is used to increase the capture cross section of thermal neutrons on Gd and reduce the capture time (about 30 s) to suppress accidental coincidence backgrounds. The total energy of gammas from neutron capture on Gd is about 8 MeV, which is much higher than the energy range of background radioactivity. The observable antineutrino spectrum is shown in Fig.1.
Due to the small value of , precise measurements are required to reduce the experimental uncertainties. In previous reactor antineutrino experiments, such as Palo Verde [10] and CHOOZ [5], single detectors were utilized for antineutrino detection. Their measurements had large uncertainty from errors related to detector response and antineutrino flux predictions. There are three ongoing reactor experiments : Daya Bay, Double Chooz, and RENO. They use multiple detectors at different baselines to reduce correlated uncertainties by a relative measurement. A comparison of the three experiments is shown in Table 1. The baselines of their far detectors are 1.65, 1.05 and 1.44km, respectively. [11].
The following content of this paper mainly focuses on the Daya Bay experiment and future prospects of reactor antineutrino experiments.
Comparison of three reactor experiments \topruleExp. Power Det.(t) Overburden 3y Sens. (GW) (N/F) (m.w.e)N/F (90%CL) \colruleDouble Chooz 8.5 8/8 120/300 0.03 RENO 16.5 16/16 120/450 0.02 DYB 17.4 80/80 250/860 0.008 \botrule
2 Daya Bay experiment
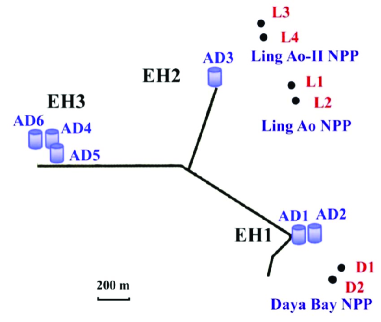
The Daya Bay experiment is designed to explore the unknown value of by measuring the survival probability of electron antineutrinos from the nuclear reactors in Daya Bay, China. The Daya Bay Nuclear Power Plant complex, one of the 5 most prolific sources of reactor neutrinos in the world, consists of 6 reactors(see Fig.2) producing 17.4 GW of total thermal power. The goal of the experiment is to measure with a sensitivity of at a 90% C.L. In order to achieve such high sensitivity, the experiment is optimized in several aspects. Multiple sites (one far experimental hall (EH3) and two near experimental halls (EH1,EH2)) are used to effectively cancel the flux uncertainty by relative measurements. The experiment employs 8 identically designed detectors to decrease detector related errors. As shown in Fig.2, only 6 detectors were deployed before August. 2012. All 8 detectors were installed by October, 2012. The detectors are installed underground to reduce the cosmic-ray muon flux. Each site has redundant muon detectors (water Cerenkov detectors and resistive plate chambers (RPCs)) for muon identification.
2.1 Detector
2.1.1 Antineutrino detector
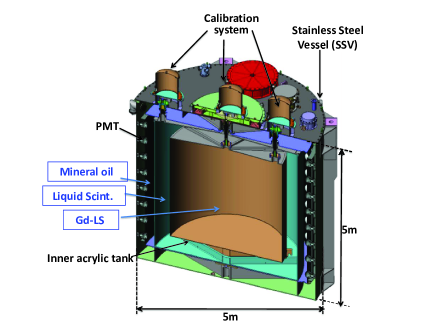
The antineutrino detectors (ADs) are filled with Gd doped liquid scintillator for antineutrino event detection. The experiment uses 8 functionally identical detectors (2 at EH1, 2 at EH2 and 4 at EH3), which are cylindrical stainless steel vessels(SSV) with a 5 m diameter and 5 meter height (Fig.3). Each detector is instrumented with 192 8-inch photomultiplier tubes (PMTs). The detector has a three-zone structure, including a Gd-doped liquid scintillator (GdLS) zone, liquid scintillator (LS) zone and mineral oil (MO) zone. The inner region is the primary target volume filled with 0.1% Gd-LS. The middle layer is LS and act as a gamma catcher, and the outer layer is filled with MO which reduces the impact of radioactivity from PMT glass and the SSV. Two acrylic tanks are used to separate each layer. There are two reflectors at the top and bottom of an AD, which are laminated with ESR (VikuitiTM Enhanced Specular Reflector Film) film sealed between two 1-cm thick acrylic panels.The reflectors improve light collection and uniformity of detector response.
Three automated calibration units (ACUs) are located on the top of each AD (Fig.3). The ADs are calibrated periodically by deploying LEDs and radioactive sources inside the detectors. LEDs are used for timing and PMT gain calibration. Energy calibration is performed with radioactive sources. Based on the first three months of data, the first pair of ADs in EH1 are shown to be functionally identical [12].
2.1.2 Muon veto system
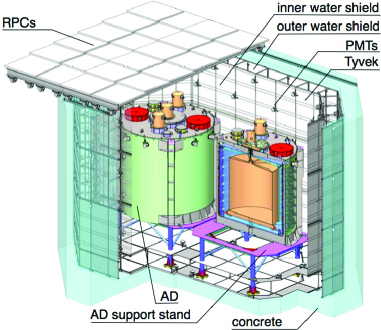
The muon veto system of the Daya Bay experiment is shown in Fig.4 . The antineutrino detectors are immersed in an octagonal pool of ultrapure water. The pool is divided into outer and inner volumes by Tyvek sheets. Both volumes are instrumented with PMTs as active muon detectors via muon Cherenkov light. The Tyvek sheet with very high reflectivity(95%) can increase light collection efficiency. The outer layer of the water pool is 1 m thick and the thickness of the inner layer is 1.5 m. At least 2.5 m of water surrounds each AD to shield against ambient radioactivity. 288 8-inch PMTs are installed in each near hall pool and 384 in the Far Hall. There is a water circulation and purification system in each hall to maintain water quality. The tops of the water Cherenkov detectors are covered by 4 layers of RPCs. RPCs are gaseous detectors with resistive electrodes operating in streamer mode at Daya Bay[13]. RPC signals are read out by external strips, with a position resolution of about 8 cm. There are 54 modules in each near hall and 81 modules in the Far Hall. The designed efficiency is 99.5% with uncertainty less than 0.25% by combining the water Cherenkov and RPC detectors. From muon data analysis, water Cherenkov detector efficiency is 99.7% for long track muons[12], which is better than the design requirement.
2.2 Data analysis
2.2.1 Event selection
After energy calibration and event reconstruction, we select the IBD events under the following criteria: {itemlist}
PMT light emission events will be rejected by the PMT flasher cut[12].
The energy of prompt and delayed candidates satisfy 0.7 MeV Ep 12 MeV and 6.0 MeV Ed 12 MeV, where Ep is the prompt signal energy and Ed is the delayed signal energy.
The delayed signal (neutron capture) time satisfies: 1s t 200s, where t is the time between the prompt and delayed signal.
If a muon goes through the water pool and fires 12 PMTs, it will be treated as a ’water pool muon’. The rejection time window of water pool muons is [-2 s, 600s].
If the visible energy in the AD is (20 MeV), it will be treated as an ’AD muon’. The rejection time window of AD muon is [-2s, 1400s].
If the visible energy in the AD is 2.5 GeV, the rejection time window is [-2 s,0.4s]
There must be no additional prompt-like signals 400s before the delayed neutron signal and no additional delayed-like signal 400s after the delayed neutron signal. As Fig. 5 shows, the events within the dash lines are the IBD candidate events after selection.
2.2.2 Background
Background control is crucial for a precise measurement in reactor antineutrino experiments. Li9/He8 is the main background from cosmic-ray muons. It is a correlated background that can mimic prompt signals with a beta-decay signal and delayed signals with neutron capture. This background is directly measured by fitting the distribution of IBD candidates versus time since the last muon. The background to signal ratio (B/S) of Li9/He8 is 0.30.1%. Another background from muons is the fast neutron background. Energetic neutrons from muons can give a prompt signal from proton recoil and a delayed signal from the neutron’s capture on Gd. By relaxing the prompt energy range from 12 MeV to 50 MeV in the IBD events selection, the fast neutron spectrum in the range of 12MeV can be extrapolated from the higher energy distribution. The fast neutron spectrum and rate is cross-checked with fast-neutron samples tagged by the muon veto system. The B/S ratio of fast neutrons is 0.1% (0.06%) for the near(far) sites.
Two uncorrelated signals can accidentally mimic an IBD signal. This accident background can be precisely measured from data. The B/S of accidentals is 1.5% (4%) for the near(far) sites. The error in the accidental rate is 1% (4%).
The 238U, 232Th, 227Ac decay chains and 210Po produce a 13C( n)16O backgrounds. This background is estimated by Monte Carlo(MC).The B/S of this background is 0.01% (0.05%) for the near(far) sites. Am-C calibration sources inside the ACUs on top of each AD constantly emit neutrons, which would occasionally mimic IBD signals by scattering inelastically with nuclei in the shielding material (emitting gamma rays) before being captured on a metal nucleus, such as Fe, Cr, Mn or Ni (releasing more gamma rays). MC is also used to estimate the rate of this background. The background rate and shape are constrained by taking data with a temporary intense source on top of the AD. The B/S ratio of Am-C sources is 0.04% (0.35%) for the near(far) sites.
2.2.3 Recent results
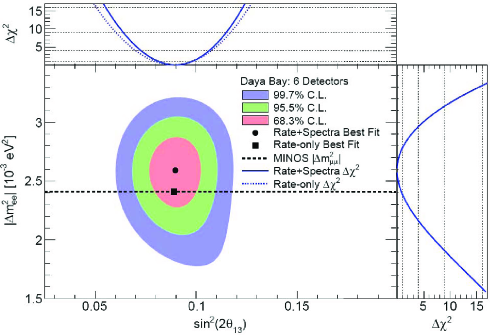
The Daya Bay experiment first presented the discovery of a non-zero (5.2) in 2012[14]. The most recent analysis[16] is based on the full six-AD data sample from Dec. 24, 2011 to July 28, 2012, which includes more than 300,000 IBD interactions. The rate-only analysis yields = 0.090 0.010 with /NDF = 0.6/4. Spectral information is also used after applying an energy nonlinearity correction to the positron spectrum. The oscillation parameters can be extracted from a fit taking into account both rate and spectral information. In Eq. 1, the short baseline ( km) reactor oscillation is mainly determined by the terms. We use the following definition[15] of the effective mass-squared difference . The best-fit values are = and = with /NDF = 163/153 (68.3% C.L.). The 68.3%, 95.5%, and 99.7% C.L. allowed regions in the vs. plane are shown in Fig.6.
The relative deficit and spectral distortion observed between far and near ADs at Daya Bay give the first independent measurement of = and the most precise measurement of = to date.
2.3 Future plan
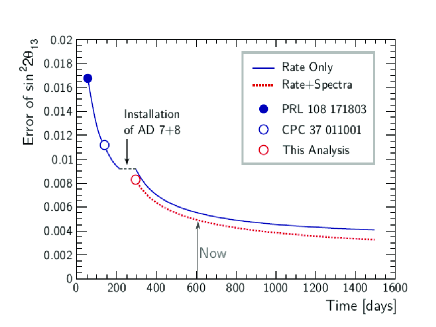
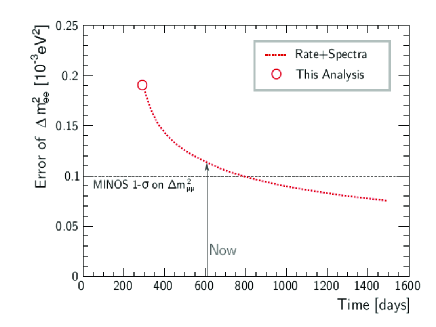
The sensitivity of versus time for Daya Bay is shown in Fig. 7. The projected uncertainty of is less than 4% after 3 years of data taking. Daya Bay is also expecting to measure in complementary precision to accelerator neutrino experiments. Fig.8 shows the error versus data-taking time. The error of will be after 3 years of data-taking.
2.4 RENO and Double Chooz status
RENO updated their result in March, 2013[18]. They gave =0.1000.010(stat)0.015(syst) and observed a clear rate deficit (7.1% reduction) between far and near sites. RENO aims to achieve 7% uncertainty in and suppress their systemic error to 0.5%. Double Chooz[19] provided their new results from a combined fit of Gd capture and Hydrogen capture with =0.1090.035. For Double Chooz, the near detector is under construction and will start running in 2014.
3 Future prospects
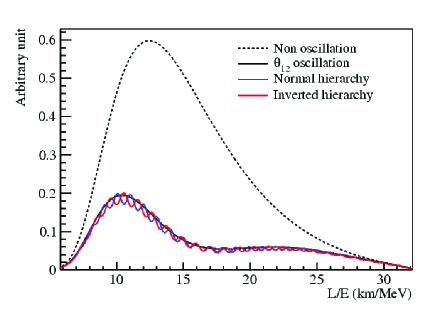
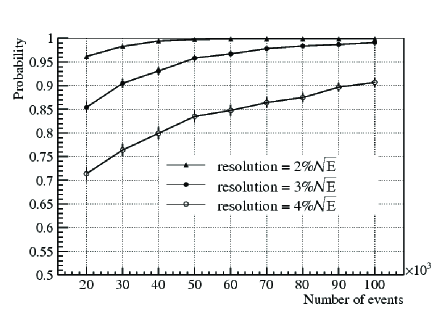
The next generation of neutrino oscillation experiments will mainly focus on the mass hierarchy and CP phase. The mass hierarchy can be determined by a precisely energy spectrum measurement in reactor neutrino oscillations, which is independent of the CP-violating phase. Fig.9 shows the L/E distribution of reactor antineutrino oscillations. It is found that frequencies of oscillation between the normal hierarchy and inverted hierarchy have some difference. The two oscillation frequency components are driven by and , respectively [20]-[23]. The difference is very sensitive to detector energy resolution. According to the study in Ref. \refciteZhanl2, for a single detector at a baseline of 58 km and with a 35 GW reactor, the probability to determine the sign of the hierarchy has a significant difference between 3% and 4% energy resolution as shown in Fig.10. Another big effect on mass hierarchy sensitivity is potentially from multiple reactor baselines, which are required to be within 500 m[25]. A large detector with good energy resolution (3%) and equal baselines from powerful reactor cores is required for a mass hierarchy determination.
3.1 The Jiangmen Underground Neutrino Observatory
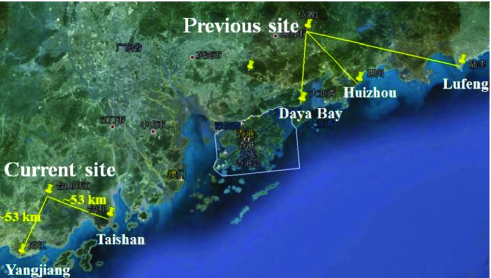
The Jiangmen Underground Neutrino Observatory (JUNO) is located at Kaiping, Jiangmen City, in Guangdong Province, China, as shown in Fig.11, 53 km from the Yangjiang and Taishan nuclear power plants. The total thermal power of the reactors is 36 GW. The detector will be constructed deep underground to reduce the cosmic-ray muon flux, with an overburden of about 700 m of rock. The detector will be filled with 20 ktons of liquid scintillator with 3% energy resolution (at 1MeV). The major goal of JUNO is to determine the mass hierarchy by precisely measuring the energy spectrum of reactor antineutrinos. However, it is a multi-purpose experiment that can also measure neutrino oscillation parameters, study atmospheric, solar and geo-neutrinos, and perform other exotic searches.
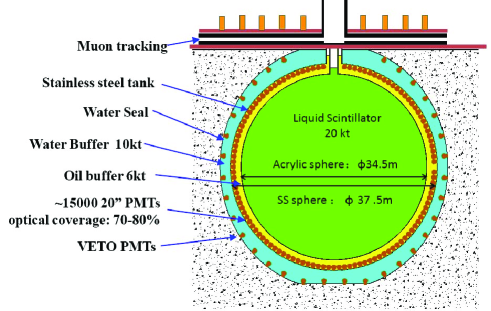
Fig.12 is the detector concept of JUNO. There are around 15,000 20-inch PMTs installed in the central detector for the 3% energy resolution. 6 ktons of mineral oil is used to shield the scintillator from PMT glass radioactivity. The muon veto system includes an outer water Cherenkov detector and a top tracking system. As for the physics prospects of JUNO[25], if we take into account the spread of reactor cores, uncertainties from energy non-linearity, etc, the mass hierarchy sensitivity with 6 years of data-taking can reach 9 with a relative measurement and 16 with an absolute measurement from accelerator neutrino experiments. Civil construction has begun and will complete in 2019. Liquid scintillator filling and data taking will begin around 2020.
3.2 RENO 50
RENO-50 was proposed in South Korea[26]. The detector will be constructed underground and consist of 18 ktons of ultra-low-radioactivity liquid scintillator and 15,000 20-inch PMTs, about 50 km away from the Hanbit nuclear power plant. The scientific goals of the experiment include a high precision measurement of and , determination of the mass hierarchy, the observation of neutrinos from reactors, the Sun, the Earth, supernovae, and any possible stellar objects. The total budget is 100 million dollars for 6 years of construction. Facility and detector construction will be started from 2013 and finished in 2018. The experiment data taking will start in 2019.
4 Summary
Reactor-based antineutrino experiments have obtained many excellent achievements in recent years. Daya Bay measured the non-zero with great precision, together with other experiments. The most recent results from Daya Bay provide the first independent measurement of and the most precise measurement of to date. The precision on will be improved to 4% in the future. The large value of boosts the next generation of neutrino oscillation experiments to determine the neutrino mass hierarchy and measure the CP violation phase. Reactor-based antineutrino experiments will continue to play an important role in the mass hierarchy determination and precise measurements of oscillation parameters.
Acknowledgments
The article is supported by the National Natural Science Foundation of China (Y3118G005C). I would like to acknowledge my Daya Bay collaborators for useful suggestion and comments, especially Dr. Yufeng Li, Logan Lebanowski and Viktor Pec who helped me a lot to improve this article.
References
- [1] C. L. Cowan et al. Science 124, 103 (1956);
- [2] F. Reines and C. L. Cowan, Jr., Nature 178, 446 (1956).
- [3] B. Pontecorvo, Sov. Phys. JETP 6, 429 (1957) and 26, 984 (1968);
- [4] Z. Maki, M. Nakagawa, and S. Sakata, Prog. Theor. Phys. 28, 870 (1962).
- [5] CHOOZ Collab. ( M. Apollonio et al.), Phys. Lett. B 466, 415 (1999).
- [6] T2K Collab. (K. Abe et al.), Phys. Rev. Lett. 107, 041801 (2011).
- [7] MINOS Collab. (P. Adamson et al.), Phys. Rev. Lett. 107, 181802 (2011).
- [8] Double Chooz Collab. ( Y. Abe et al.), Phys. Rev. Lett. 108, 131801 (2012).
- [9] J. Beringer et al. (Particle Data Group), Phys. Rev. D 86, 010001 (2012), Section 13.
- [10] F. Boehm et al., Phys. Rev. Lett. 84, 400 3764(2000).
- [11] J. Cao, plenary talk at the 36th International Conference on High Energy Physics, Melbourne, Jul. 2012.
- [12] DayaBay Collab. ( F. An et al.), NIM A 685, 78-97 (2012).
- [13] L. Ma et al.NIM A 659, 154(2011); J. Xu et al., Chin. Phys. C 35,844 (2011).
- [14] Daya Bay Collab. ( F. Anet al.), Phys. Rev. Lett. 108, 171803 (2012).
- [15] The Daya Bay definition is consistent with H. Minakata et al., Phys. Rev. D bf 74, 053008 (2006) and H. Minakata et al., Phys. Rev. D 76, 053005 (2007).
- [16] Daya Bay Collab.( F. Anet al.), http://arxiv.org/abs/1310.6732
- [17] (MINOS Collaboration),(P. Adamsonet al.) Phys. Rev. Lett. 110, 51801 (2013).
- [18] Seon-Hee Seo, talk on NuTel2013, March 2013
- [19] Ralitsa Sharankova, talk on NuFact2013, Aug,2013, Beijing
- [20] S. T. Petcov and M. Piai Phys. Lett. B 533, 94 (2002);
- [21] S. Choubey, S. T. Petcov, and M. Piai Phys. Rev. D 68, 113006 (2003).
- [22] J. Learned et al., hep-ex/0612022
- [23] L. Zhan, Y. Wang, J. Cao, L. Wen,Phys. Rev. D 78, 111103 (2008); Phys. Rev. D 79, 073007 2009
- [24] L. Zhan, Neutrino Oscillation Workshop 2012,September 9-16, 2012 Italy
- [25] Yu-Feng Li, Jun Cao, Yifang Wang, and Liang Zhan,Phys. Rev. D 88, 013008 (2013).
- [26] Soo-Bong Kim, talk at the international workshop on RENO-50, June 13-14, 2013, Seoul.