Multichannel Interference In High-Order Harmonic Generation From Ne+ Driven By Ultrashort Intense Laser Pulse
Abstract
We apply the time-dependent R-matrix method to investigate harmonic generation from Ne+ at a wavelength of 390 nm and intensities up to Wcm-2. The and states of Ne2+ are included as residual-ion states to assess the influence of interference between photoionization channels associated with these thresholds. The harmonic spectrum is well approximated by calculations in which only the and thresholds are taken into account, but no satisfactory spectrum is obtained when a single threshold is taken into account. Within the harmonic plateau, extending to about 100 eV, individual harmonics can be suppressed at particular intensities when all Ne2+ thresholds are taken into account. The suppression is not observed when only a single threshold is accounted for. Since the suppression is dependent on intensity, it may be difficult to observe experimentally.
pacs:
32.80.Wr, 42.65.Ky, 31.15.A-I Introduction
High-order harmonic generation (HG) has been investigated intensively since its observation more than three decades ago Ago . It has remained a process of great interest due to its potential as a source of XUV radiation Zhao . Since the light generated by HG is coherent, HG is the key for the production of ultrashort pulses of light attosecond duration Paul ; Hen . These ultrashort pulses have been applied to a variety of time-resolved studies, enabling researchers to explore ultrafast electron dynamics occurring on the sub-femtosecond time scale Sch ; Kl . Examples of these explorations include the investigation of dynamics in inner shell vacancies for Kr atoms Dre , the time-resolved investigation of laser induced tunnel ionization Uib and the study of electron dynamics during photoemission from a tungsten surface Cav .
Harmonic generation is also of interest as a measurement tool in the study of molecular dynamics and structure. Different harmonics are generated at slightly different times, and this characteristic has been used to demonstrate differences in the period of molecular vibrations S . More recently, a harmonic spectroscopy technique allows photochemical reactions to be measured in real time Wor1 ; this method has the ability to monitor the dynamic electron density as the electrons are transferred between atoms in a molecule during chemical reactions. Furthermore, HG has been applied to investigate how Br atoms move apart in the dissociation of Br2 molecules Wor2 .
HG is generally understood in terms of the quasi-classical, three-step model Cor1993 . Three different stages of electron dynamics need to be included: first, the ejection of an electron from the atom, second, the motion of this ejected electron in the laser field and, third, its photo-recombination with the parent ion. The three-step model has proven to be very useful for understanding many of the features of HG. It provides intuitive understanding about the highest harmonic that can be observed and the timing delays between different harmonics.
One of the key findings in recent experiments is that HG in molecules is significantly affected by interferences between ionization channels associated with different ionization thresholds Shi . Although the three step model is suitable for noble-gas targets which have an isolated lowest ionization threshold, it may be less suitable for systems with several, closely spaced low-lying ionization thresholds. For these systems, the electronic dynamics may become quite complicated, leading to amplitude and phase differences between different ionization pathways, phase differences between electron trajectories in the laser field associated with different ionization thresholds, and amplitude differences in the recombination step. Hence, although the underlying mechanism of HG does not change for systems with multiple low-lying ionization thresholds, additional physics merits consideration. Recent theoretical studies on HG in atoms have demonstrated that interference effects between states associated with different ionization thresholds can play a notable role in atomic systems as well Pab1 ; Pab2 ; Bro1 ; Bro2 ; Sta .
Atomic systems present significant advantages in developing understanding of HG in systems with multiple ionization thresholds. Many atomic systems have multiple low-lying ionization thresholds. Atomic systems can be described with very good accuracy, enabling a detailed investigation of the effect electronic interactions have on the competition between different pathways. Accurate theoretical methods are available: for example, time-dependent R-matrix (TDRM) theory was developed at Queen’s University Belfast to investigate the influence of electron interactions on atomic dynamics in intense fields Lys ; Lys1 . Pabst and Santra Pab1 ; Pab2 have developed the TD-CIS approach, whereas Ngoko Djiokap and Starace Sta have investigated harmonic generation in the two-electron He atom by solving the full-dimensional Schrödinger equation.
The accuracy of the TDRM approach to HG processes was verified by the comparison of HG spectra for He with those obtained by the HELIUM code Smy98 ; Bro2 . It has since been applied to investigate the multielectron response for several systems: the effects of resonances on HG in Ar Bro1 , and the effect of multiple ionization thresholds on HG in Ar+ Bro3 ; Bro4 . In these Ar+ studies, only a few harmonics appeared for photon energies exceeding the Ar+ binding energy, and it was therefore difficult to identify clear interference effects in the plateau region. The Ar+ studies were carried out at Wcm-2. At higher intensities, high ionization probabilities made the accurate determination of the hamonic spectrum impossible. The study of HG from ions is not only of theoretical interest. It has been suggested that the very highest harmonics seen in experiment are generated by ionised atoms rather than neutral atoms Ze ; Gi ; Wa .
In the present study, we have chosen to investigate Ne+. Due to its higher ionization potential, the intensity can be increased significantly before ionization leads to a loss of accuracy in the harmonic spectrum. Ne+ is therefore a more suitable ion for investigating interference effects between pathways associated with different threshold. The energy gap between the Ne+ ionization thresholds is about twice as large as the energy difference between Ar+ thresholds. However, the energy difference remains comparable to the photon energy, so the interaction between channels associated with different thresholds should still be strong.
The organization of the paper is as follows. In the following section, we present briefly the theoretical background, giving an overview of TDRM theory, and details on the computations. In Sec III we present harmonic spectra including the three low-lying ionization thresholds, the , , states of Ne2+, in the calculations for several intensities. We then look in detail at the role of the different ionization thresholds on HG by presenting harmonic spectra for calculations in which subsets of the ionization thresholds have been included. Since the total magnetic quantum number significantly affects harmonic generation Bro4 , results for are presented in section III.1 and those for in section III.2. Finally, we will summarize our results and conclusions.
II THEORY
II.1 TDRM Theory
In this report, we employ TDRM theory to study HG in Ne+. TDRM theory is a fully non-perturbative ab initio theory, which has been developed to describe the interaction of an intense ultrashort light pulse with general multielectron atoms and atomic ions. In the theory, it is assumed that the light field can be treated classically in the dipole approximation, that it is linearly polarized along the -axis and that it is spatially homogeneous. At present, relativistic effects are not taken into account.
TDRM theory is based upon R-matrix theory, in which space is divided into two distinct regions: an inner region and an outer region. In the inner region, all electrons are contained within a distance of the nucleus. In the outer region, one electron has separated from the residual ion, and is at a distance greater than from the nucleus, while the other electrons remain confined within a distance of the nucleus. In the inner region, electron exchange and correlation effects between all pairs of electrons are described in full. However, in the outer region, exchange interactions between the ejected electron and the electrons remaining near the residual ion can be neglected. Hence, in this region only the laser field and the long-range (multipole) potential of the residual ion are included for the motion of the outer electron.
To obtain the wavefunction for the initial state of Ne+, which is fully contained within the inner R-matrix region at time , we solve the time-independent field-free Schrödinger equation. The inner-region wavefunction is expanded in terms of an R-matrix basis , given by Burbook
| (1) | |||||
is the antisymmetrization operator, are channel functions in which residual Ne2+ ion states are coupled with the spin and angular parameters of the outer electron. = , where are the space and spin coordinates of the electron. The functions form a continuum basis set for the radial wavefunction of the outer electron inside the inner region. Correlation functions are -electron basis functions which vanish at the boundary. The residual-ion states and correlation functions are constructed from Hartree Fock, Ne2+ orbitals Roe , and the functions are orthogonalised with respect to these input orbitals. The coefficients and are obtained through diagonalization of the field-free Hamiltonian.
Once we have obtained the initial state, we solve the time-dependent Schrödinger equation for an atom in a light field on a discrete time grid of step size using the Crank-Nicolson technique described by Lysaght et al Lys . We obtain the wavefunction at time from the solution at , by rewriting the Schrödinger equation using the unitary Cayley form of the time evolution operator exp(-). This gives, correct to ,
| (2) |
where
| (3) |
In Eqs. (2) and (3), , with . is the time-dependent Hamiltonian at the midpoint time of and . In this time-dependent Hamiltonian, the laser field is described in the dipole-length gauge.
In order to solve Eq. (2), we apply different approaches to the inner region and the outer region Lys . Within the inner region, we expand the time-dependent wavefunction in terms of the field-free R-matrix basis:
| (4) |
so that the time-dependence is contained entirely within the coefficients . However, the continuum functions in the R-matrix basis expansion (1) are non-vanishing at the boundary. Hence the Hamiltonian is not Hermitian in the inner region due to surface terms arising from the kinetic energy operator, . We introduce the Bloch operator, , to cancel these terms, such that is Hermitian in the internal region.
| (5) |
Using this result we can rewrite Eq. (2) in the internal region as:
| (6) |
Similar to standard R-matrix theory Burbook , we now need outer-region information to set the boundary conditions for to solve Eq. (6) in the inner region Lys . Hence, the inner and outer regions are linked to each other through the so-called R-matrix:
| (7) |
Here, and indicate channel functions , whereas and indicate field-free eigenfunctions . indicates the surface amplitude of the field-free eigenfunctions at with respect to each channel function . In the present computational scheme, the R-matrix is obtained through solving a system of linear equations rather than a diagonalization of .
The wavefunctions in the inner and the outer regions are then connected to each other at the boundary according to Burbook ; Lys by
| (8) |
where the vector is the reduced radial wavefunction of the scattered electron, and its first derivative. Compared to standard R-matrix theory, an additional inhomogenous term appears on the right hand side, which arises from the -term in Eq. (2). This so-called T-vector is given by:
| (9) |
The T-vector is determined together with the R-matrix in the linear solver step. With this equation, we can determine the full wavefunction in the inner region once we know the vector . In standard R-matrix theory, this is achieved through setting boundary conditions at infinity. Within time-dependent R-matrix theory, on the other hand, it takes time for the wavefunction to evolve, and consequently, the boundary condition on the F-vector is that at a sufficiently large distance the wavefunction, , equals zero.
In order to obtain the time-dependent wavefunction, we need to consider the outer-region wavefunction at a sufficiently large distance. Although Eq. (8) is given at the inner-region boundary, it is a general equation that holds throughout the outer region. The equation also hold at a large distance where it can be assumed that the wavefunction, , has vanished. We thus need to obtain the R-matrix and T-vector at this large distance. This is achieved by dividing the outer region into subsectors, ranging from the inner-region boundary out to this large distance . The Hamiltonian in each subsector is calculated in a similar way as in the internal region by including Bloch operators and for the left-hand and right-hand boundaries. We can then obtain the time-dependent Green’s function for each subsector, and use these Green’s functions to propagate the R-matrix and T-vector from the inner-region boundary to the outer boundary Burbook ; Lys . Subsequently, we can use the R-matrix and T-vector to propagate the F-vector inward from to . Once we have obtained across all subsector boundaries, we can determine the wavefunction in the inner region and within all outer region subsectors, and initiate the computation for the next time step. Repeating this procedure at each time step, we can follow the behaviour of the wavefunction across the full range of times. For more details on the propagation method, see Lys .
Calculation of the harmonic spectrum through the TDRM approach follows from determination of dipole moment of the wavefunction at each time step. The harmonic radiation emitted from the atoms and ions in an intense laser field can be expressed in terms of the Fourier transform of the time-dependent expectation value of either the dipole moment, the dipole acceleration or the dipole velocity. The relative merits of each of these operators is still an active subject of discussion Bagg .
In the TDRM approach, we have a choice of using the length form,
| (10) |
or the velocity form,
| (11) |
The acceleration form is less appropriate for the TDRM approach, as restrictions on the basis set mean that inner-shell electrons, such as the 1s electrons, are normally kept frozen. As a consequence, the calculations include the action of the 1s electrons on valence electrons, but the back-action on the 1s electrons is not taken into account. This limitation prevents the use of the dipole acceleration in the determination of the harmonic spectrum. In the present calculations, the harmonic spectrum is calculated using both the dipole length and dipole velocity form, and we check for consistency between both spectra.
II.2 Calculation Parameters
As described above, basis functions for the description of Ne+ states are expressed as Ne2+ residual-ion states plus an additional electron. We describe Ne2+ using Hartree-Fock orbitals for , and of the Ne2+ ground state, as given by Clementi and Roetti Roe . The R-matrix inner region has a radius of 15 a.u. The continuum functions are described using a set of 60 B-splines of order , for each available angular momentum of the outgoing electron. We include all three states, , and 1Se, as residual-ion states. The description of Ne+ includes all Ne+ channels up to a maximum total angular momentum =23. In order to test the spectra for convergence some calculations were also carried out for a angular momentum =27. The Ne+ ground-state energy has not been shifted to its experimental value.
In the TDRM calculations, the time step in the wavefunction propagation for this calculation is normally set to 0.05 a.u. Additional calculations were carried out at time steps of 0.04 a.u., and 0.06 a.u. with no significant change in the overall spectrum. In the outer region we set the outer boundary to 1000 a.u. to prevent any unphysical reflections of the wavefunction. The outer region is divided into subsectors of width 2 a.u. Here, the radial wave function for each channel is described using a set of 35 B-splines of order 11. The laser pulse wavelength is chosen to be 390 nm. The pulse profile is given by a three-cycle sin2 turn-on followed by four cycles at peak intensity and a three-cycle sin2 turn-off (3-4-3).
III Results
In this report, we investigate HG from Ne+ ions irradiated by laser light with a wavelength of 390 nm. Ne+ has been chosen for this current study due to its higher ionization potential, 41 eV, compared to 27 eV for Ar+. Due to the higher ionization potential, the same level of ionization requires higher intensities, and it is thus possible to investigate HG at higher intensities for Ne+ compared to Ar+. The higher intensity leads to an extended plateau region for HG, and Ne+ should therefore show in more detail how interference due to channels associated with different ionization thresholds affects the harmonic spectra.
| Configuration | Threshold | Energy KR | Energy (Present) |
|---|---|---|---|
| eV | eV | ||
| 0.00 | 0.00 | ||
| 3.20 | 3.42 | ||
| 6.91 | 6.55 |
The energies for the lowest three ionization thresholds of Ne+, corresponding to the three different Ne2+ states, as calculated in the present study, are listed in Table 1, and compared to literature values. The three ionization thresholds are separated from each other by just over 3 eV. This energy difference is comparable to the photon energy and, hence, the interplay between channels associated with different thresholds cannot be neglected. The energy spacings in the present study differ from the literature values, with the largest difference seen for the - gap which is 3.71 eV experimentally compared to 3.13 eV in the present study. The most important energy gap is the - gap with a gap difference of 0.22 eV. These differences are sufficiently small for identification of the most important effects of the interplay between channels.

III.1 High Harmonic generation from Ne+ aligned with
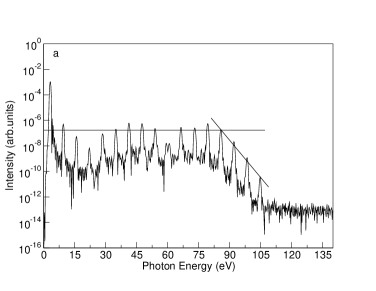
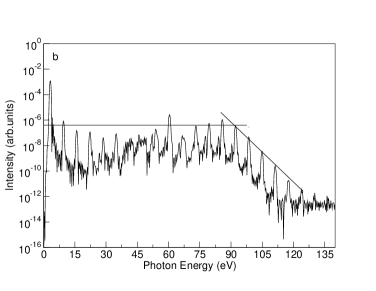
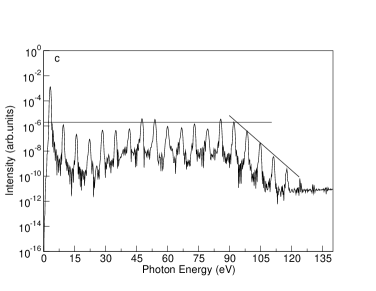
The harmonic response of Ne+, as calculated from the expectation value of the dipole length operator, is shown in Fig. 1, for peak laser intensities between Wcm-2 and Wcm-2, and a 3-4-3 pulse profile. The spectra have the expected structure with a plateau containing eight odd harmonics up to a cut-off energy around 90 eV. Beyond this cut-off energy, an exponential decay in the harmonic yield is seen. The plateau is more extensive than observed for Ar+ at Wcm-2, for which the plateau contained 3 harmonic peaks Bro2 ; Bro3 . Although the figure shows only the harmonic spectrum obtained through the dipole operator, the harmonic spectrum has also been obtained using the expectation value of the dipole velocity. The spectra calculated through the dipole and the dipole velocity show very good agreement. The convergence is typically within 20 in the overall harmonics up to 120 eV where the spectra associated from both dipoles start to diverge clearly. The main reason for the overall difference is the limited basis expansion used for the description of the Ne2+ states in the present calculations.
Table 2 gives indicative intensities of the harmonic peaks, normalized to the harmonic spectrum obtained at Wcm-2, and the cutoff energy of the plateau as determined from the spectra. The straight lines in Fig. 1 demonstrate the origin of these values. Table 2 also gives the population in the outer region. In the three step model ionization is the first step of HG. The table shows that the increase in the harmonic yield approximately follows the increase in population in the outer region, with a factor 13 increase in the harmonic yield going from 7 1014 Wcm-2 to 1015 Wcm-2 matched by an increase of a factor 15 in the outer-region population.
| Intensity | Relative harm- | Outer region | Cut-off | Cut-off |
|---|---|---|---|---|
| onic yield | population | Le | ||
| (Wcm-2) | (eV) | () | (eV) | (eV) |
| 1.0 | 8.43 | 98.2 | 96.4 | |
| 0.29 | 4.14 | 93.8 | 91.9 | |
| 0.17 | 1.72 | 92.5 | 87.4 | |
| 0.08 | 0.58 | 86.2 | 82.8 |
Table 2 shows the variation of the cut-off energy of the plateau with peak intensity. The determination of the cut-off energy is shown in the graphs. These cut-off values are expected to have an energy uncertainty 1.5 eV. The standard cut-off formula for the energy of the cut-off is given by Le , where is the ponderomotive potential of a free electron in a laser field, is the ionization potential and is a parameter, which depends on the ratio between and . For the present range of intensities, the parameter ranges between 1.235 and 1.25. For simplicity, we adopt . Values obtained from this formula are also given in the table. It can be seen that for all intensities, the observed cut-off energy values differ by about 2 eV from the predictions of the formula, although at an intensity of Wcm-2 the cut-off formula underestimates the observed cut-off energy by 5.1 eV.
Figure 1 shows great variation of peak intensity within the plateau region. In Fig. 1(b), harmonic 19 at 60 eV is a factor 40 more intense than harmonic 21. In Fig. 1(d), relatively little harmonic response is observed for harmonics 23 and 27, at 72 eV and 86 eV, respectively. The basis set in the present calculations is chosen specifically to exclude resonances above the ionization threshold, so that this reduction in magnitude cannot ascribed to atomic structure at these harmonic energies. Harmonics up to a photon energy of around 50- 55 eV, on the other hand, can be strongly affected by resonances due to the Rydberg series leading up to the thresholds.
The HG spectra can be affected by interferences arising from several sources. Below the cut-off energy, harmonics can be created by electrons returning on so-called short and long trajectories Sm . For multi-threshold systems, interferences between channels associated with different thresholds can arise as well. Within the TDRM approach, it is difficult to unambiguously separate short and long trajectories. Therefore, in order to understand whether the interplay between channels associated with different thresholds could be responsible for the interference structure, as well as the discrepancy in the cut-off energy, we have carried out additional calculations in which only subsets of the thresholds are taken into account.

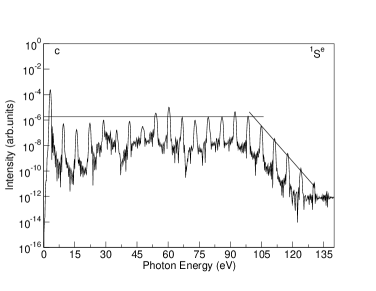

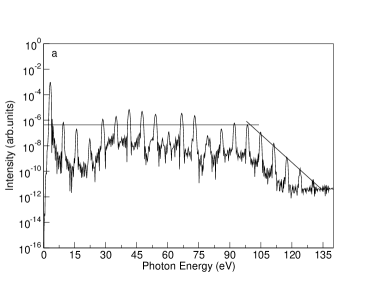
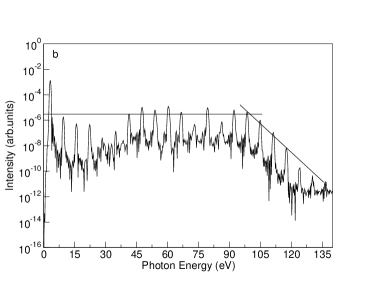
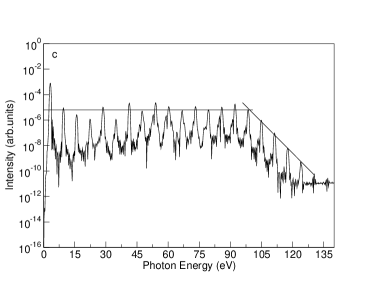
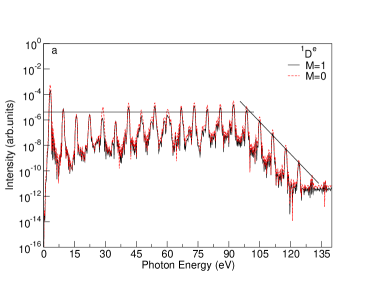
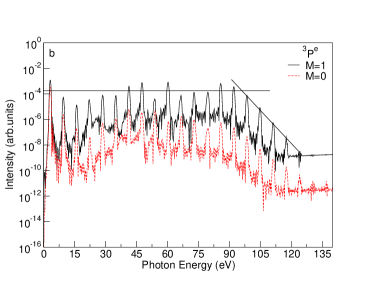
First, we consider the harmonic spectra when only a single residual ion state is included in the calculation. Since harmonics 23 and 27 show a significant reduction in magnitude for an intensity of W cm-2, we have chosen this intensity for the comparison. Figure 2 shows the harmonic spectra when only an individual threshold of Ne2+, ( or ) is included. For comparison, the figure also includes the full spectrum.
Figure 2 shows significant variation in the harmonic efficiency between the different individual threshold calculations. In the calculation in which only the threshold is retained, the observed harmonic intensities are about an order of magnitude greater than those observed when only the threshold is retained. The harmonic intensities when only the threshold, the Ne2+ ground state, is retained are about one order of magnitude smaller than those when only the threshold is retained at 45 eV, and about two orders of magnitude smaller at 90 eV. The spectrum obtained when all thresholds are included shows harmonic intensities one order of magnitude smaller than the spectrum obtained when only the threshold is retained. This is a significant variation in harmonic yields depending on the symmetry of the ionization threshold. Since the smallest harmonic yields are retained when only the Ne2+ ground state is obtained, this variation cannot be explained solely by the variation in binding energy of the different thresholds.
| Threshold | Relative | Cut-off | Population |
|---|---|---|---|
| harmonic yield | (eV) | in outer region | |
| , and | 1 | 98.1 | |
| 4.1 | 98.6 | ||
| 92.4 | |||
| 0.64 | 99.1 | ||
| , | 2.1 | 99.2 | |
| , | 0.28 | 97.2 | |
| , | 4.4 | 98.2 |
As demonstrated earlier, the typical harmonic yield behaves similarly to the population in the outer region. We focus our attention therefore first on these populations, shown in Table 3. Note that the table does not provide a typical harmonic yield when only the threshold is retained. Figure 2(a) shows a decrease of about an order of magnitude across the plateau region, and it is therefore impossible to identify a typical value that applies to the entire plateau. Table 3 shows that the variation in the typical harmonic yields is reflected to some extent in the outer-region populations. The outer region population when only the threshold is retained is about a factor 3.7-5.5 larger than when either the or threshold is retained. It is, however, also a factor 4 larger than when all three thresholds are retained. The increase in the population in the outer region may therefore be the fundamental reason for the higher harmonic yields when only the threshold is retained. However, the population in the outer region does not explain the difference between the harmonic yields obtained when only the or the threshold is retained.
Table 3 also shows how the cut-off energies for the plateau region depend on the thresholds retained in the calculation. The cut-off energies when only the or threshold is retained lie within 1 eV of the cut-off energy observed when all three thresholds are retained. However, the cut-off energy obtained when only the threshold is retained is nearly 6 eV smaller than the cut-off energies obtained in the other calculations. This is clear demonstration that there are fundamental differences between the process of HG in Ne+ with when all three thresholds are accounted for and when only the Ne2+ ground state is accounted for.
Figure 2(d) shows the full harmonic spectrum, in which harmonics 23 and 27 are reduced in intensity by about 1.5 order of magnitude. However, Fig. 2(a), (b) and (c), show no significant reduction in intensity at either of these harmonics. Instead, the spectra show smooth variations in the intensities of the different harmonic peaks. These single-threshold spectra are still affected by interferences between the short and long trajectories. No sign of these interferences is seen in the individual spectra, although there is some variation in the magnitude of individual harmonic peaks. Hence, the reduction in the harmonic intensity seen in Fig. 2(d) cannot be assigned to dynamics associated with a single ionization threshold. It is therefore necessary to consider harmonic spectra obtained when multiple ionization thresholds are retained.
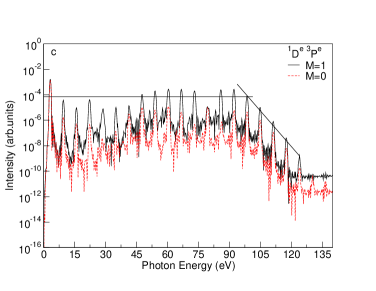
The next stage in the analysis is to investigate harmonic spectra when pairs of Ne2+ residual-ion states, (, ), (, ) and (, ), are retained in the calculations. These harmonic spectra are shown in Fig. 3 and compared to the spectrum obtained in the full calculation. The harmonic spectrum obtained when both the and thresholds are retained shows great similarity to the harmonic spectrum obtained when all three target states are retained. The other spectra show noticeable differences with the full spectrum. The spectrum obtained when both the and thresholds are retained shows harmonic intensities, which are about a factor of 4 smaller than those of the full spectrum, especially at higher energies. The (, ) spectrum has harmonic intensities which are slightly larger than the full spectrum in the plateau region. However, the yield for harmonics below the ionization threshold is larger than obtained in the full calculation and these peaks are more pronounced compared to the full spectrum. No sign of interference is seen for harmonics 23 and 27.
Once again, Table 3 lists the population in the outer region when each pair of Ne2+ residual-ion states (, ), (, ) and (, ) is retained in the calculation. When the threshold is included in the calculation, the total population in the outer region is within 10% of the outer-region population when all three thresholds are included. However, when only the and thresholds are accounted for, the population in the outer region is larger than the population in the full calculation by more than a factor 3. Hence the inclusion of the threshold is essential to obtain an accurate population in the outer region.
The cut-off energies, given in Table 3, show agreement with the full spectrum within 1 eV. The interaction between channels associated with the threshold and channels associated with either the or threshold leads to the cut-off energy of the harmonic spectrum being shifted upward by about 6 eV.
Signs of destructive interference can be observed in the spectra obtained in both the (, ) and (, ) calculation. In the former case, harmonics 25 and 27 are suppressed, whereas harmonics 23 and 27 are suppressed in the latter case. For the (, ) case, the decrease in magnitude corresponds well to the decrease observed in the full calculation.
Overall, these harmonic spectra demonstrate that HG from ground-state Ne+ with at a wavelength of 390 nm requires the inclusion of at least the 2s22p4 and thresholds of Ne2+. The harmonic spectrum is dominated by the harmonic response of the excited threshold, as demonstrated, for example, by the cut-off energy in the full calculation. However, if just the threshold is accounted for, the ionization rate is too high, and the spectra do not show the right level of variation in harmonic intensities. Inclusion of the (lower-lying) threshold reduces the ionization rate, and the correct magnitude of the harmonic yield is obtained. Interference between pathways associated with these ionization thresholds then leads to the destructive interference for certain harmonics.
It is counterintuitive that inclusion of a lower-lying ionization threshold reduces the ionization rate. The lower ionization rate associated with the threshold can be explained through the allowed -values of the ejected electron Bro3 . For , ejection of an electron with is only allowed for the threshold. The threshold can only be reached through the emission of electrons. The Rydberg series converging to the and the thresholds overlap. When an electron is excited towards the threshold, electron-electron interactions between the two channels can ‘re-route’ an electron from the path to the path changing the -value of the electron. Since below the state the density of states in the Rydberg series converging to the threshold is higher than that for the series converging to the threshold, it may be difficult for the electron to return from the Rydberg series to the Rydberg series. This process can slow down ionization and, through reduction of the ionization pathway, reduce the harmonic yield.
III.2 High Harmonic generation from Ne+ aligned with
In the previous study of HG in Ar+, a difference of about a factor of 4 was observed between the harmonic yields for and . It is therefore valuable to investigate whether a similar difference is observed for Ne+ as well, and to see whether the magnetic quantum number leads to changes in the interference pattern. The total magnetic quantum number has a significant effect on the calculations: it affects the allowed radiative transitions. For systems with , the selection rules state that only radiative transitions with are allowed, but, for , radiative transitions are allowed. Hence, transitions between states with different parity but the same angular momentum () are now allowed. This doubles the number of total symmetries that need to be retained in the calculation, with a corresponding increase in the size of the calculations. We have therefore performed only a limited number of calculations for , focussing primarily on the interplay between the and thresholds.
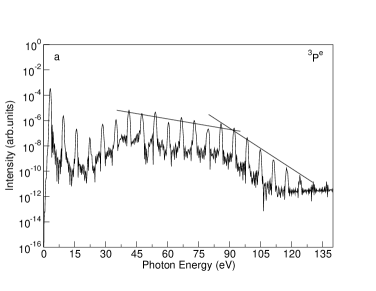
Figure 4(d) shows the harmonic spectrum for Ne+, with initially, obtained when all three residual Ne2+ states are retained in the calculation. The spectrum is included for comparison. The figure shows an increase for of about a factor 26 compared to . This reflects, in part, an increase in the population in the outer region by a factor of 12.5 for compared to . This change in the harmonic yield is a factor 6 larger than the relative change seen for Ar+, demonstrating that the initial alignment is a more critical factor for Ne+ than for Ar+.
Figure 4(d) also shows that harmonics 17 - 29 have a very similar magnitude, apart from harmonic 25, which has been reduced by over one order of magnitude, compared to the other harmonics in the plateau region. It is noteworthy that, for , both neighbouring harmonics, harmonics 23 and 27- were the ones that decreased noticeably in magnitude. To verify that the reason for this decrease is the interplay between channels associated with the and thresholds, as for , we have carried out additional calculations in which combinations of these states were included as residual-ion states of Ne2+.
| Threshold | Relative | Cut-off | Population |
|---|---|---|---|
| harmonic yield | (eV) | in outer region | |
| , and | 26.4 | 99.2 | |
| 0.63 | 100.7 | ||
| 96.2 | |||
| , | 18.2 | 99.2 |
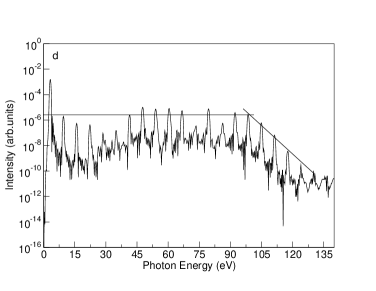
Figure 4(a), 4(b) and 4(c) show the harmonic spectra obtained when just the threshold is retained, just the threshold is retained and when both the and thresholds are retained, respectively. For Figs. 4(a), 4(b) and 4(c), the corresponding spectrum for is also presented. Figure 4(c) and 4(d) demonstrate that the total harmonic spectrum obtained for the (, ) case is very similar to the full spectrum, as observed for . The assumption that the threshold is less important is therefore justified.
The comparison of the harmonic spectra for and is dramatically different for the calculation including the threshold only and for the calculation including the threshold only. When only the threshold is included in the calculations, the harmonic yields for and are very similar. The population in the outer region is also similar, differing by a factor 1.3. On the other hand, when only the threshold is retained, the harmonic intensities increase by over 2 orders of magnitude. The intensities of the harmonics across the plateau region show no obvious decrease with photon energy for , whereas they did for . This marked increase in harmonic yield is matched by an increase of a factor 12 in the population in the outer region. This behaviour is in line with the behaviour seen for Ar+ Bro4 .
The spectrum obtained when both the and thresholds are retained in the calculation shows harmonic intensities which have decreased from the typical intensity shown in the spectrum by approximately a factor of 3. However, apart from harmonic 25, harmonics 17 - 29 appear with very similar intensity in the (, ) spectrum, whereas the spectrum shows more substantial variation across the harmonics. Harmonic 25 shows a significant reduction of about an order of magnitude compared to harmonics 17 - 29. In the individual and spectra, harmonic 25 is similar in appearance as harmonic 23. Destructive interference between the two pathways to HG leads to the significant reduction of the yield of harmonic 25 in the combined spectrum.
The significant change seen in harmonic yield associated with the threshold has the same origin as explained for Ar+ Bro4 . For the initial configuration only contains a single electron with . Its emission leaves in a singlet state, so the state can not be a state of the residual ion following ejection of an electron. For , two electrons have . Emission of one of these electrons leaves a shell with holes at and , which can combine to form a triplet state. Thus, the emission of an electron can leave the Ne2+ residual ion in the ground state for . The ionization step in the recollision model is dominated by a single electron escaping towards an excited threshold for , whereas it is dominated by one out electron (out of two available) escaping towards the lowest threshold for . Ionization should therefore be significantly stronger for , and the harmonic yield should be higher. The threshold can be reached through emission of an electron for both and . In this case, the harmonic yields and populations in the outer region are of similar magnitude.
In addition, Table 4 also shows that the cut-off energy, when only threshold is included in the calculation, is about 96 eV. On the other hand, it is about 99 eV when the threshold taken into account as well. The additional thresholds therefore appear to increase the cutoff energy for the harmonic plateau. For both and , the inclusion of the threshold raises the cut-off energy. The role of the threshold differs in these cases: for , it is the primary threshold for HG, but for it is the secondary threshold.
Overall, the HG spectra for both and demonstrate the necessity to include at least the lowest two thresholds for the reliable determination of the HG spectrum, for the isolated atom. Interplay between channels associated with these thresholds affects the spectra greatly: the overall yield is reduced by a factor 4 from the most efficient channel. The cut-off energy is increased beyond the cut-off associated with the lowest threshold. Interference between pathways can cause specific harmonics to be significantly reduced at specific intensities.
IV Conclusions
We have applied time-dependent R-matrix theory to investigate HG in Ne+ at a laser wavelength of 390 nm. Due to the large binding energy of Ne+, harmonic spectra could be obtained for laser intensities up to Wcm-2, enabling the determination of the role of different ionization thresholds in HG within the plateau region. To assess the influence of channels associated with individual thresholds and of the interactions between channels associated with different ionization thresholds, calculations were performed using all possible combinations of the three , and thresholds of Ne2+. A good approximation to the full spectrum is obtained when both the and threshold are included, indicating that inclusion of the threshold is less critical.
For , we find that inclusion of just the threshold on its own underestimates the harmonic yield by up to an order of magnitude, and gives too small a cut-off energy. On the other hand, inclusion of the threshold on its own overestimates the harmonic yield by an order of magnitude due to an overestimation of the Ne+ ionization rate. Hence both thresholds are essential for a correct description of HG for Ne+ with .
For , we find that inclusion of just the threshold on its own slightly overestimates the harmonic yield by about a factor of 2, whereas, the cut-off energy value underestimates by 3 eV the value when all the three thresholds are retained. On the other hand, inclusion of only the threshold now underestimates the harmonic yield by an order of magnitude. Hence both thresholds are essential for a correct description of HG for Ne+ with .
Interactions between the pathways leading up to the and thresholds affect more than just the overall magnitude of the harmonics. At an intensity of 1015 Wcm-2, we observe noticeable decreases in the harmonic yield for specific harmonics. For harmonics 23 and 27 are affected in particular, whereas for , harmonic 25 is affected the most. These decreases in the harmonic yield are only present when both the and the thresholds are included in the calculations, and are not observed when only a single threshold is included. We thus ascribe this decrease to interference between different ionization channels. It should be noted however that this particular interference is only observed at 1015 Wcm-2, and is not observed at 91014 Wcm-2. Therefore this interference may be strongly intensity dependent. In experiment, where different atoms (or ions) will experience different peak intensities, the effects of this interference may therefore not be apparent.
Although the present work demonstrates that the TDRM approach can describe HG in ions successfully, including an extensive plateau up to photon energies 100 eV, using intensities up to Wcm-2 at a wavelength of 390 nm, it may be difficult to extend the present approach to longer wavelengths due to an increase in the number of angular momenta that need to be retained in the calculations. The recently developed R-matrix incorporating time-dependence (RMT) codes Moor2 should be more amenable to the inclusion of many angular momenta. It will therefore be interesting to explore HG using the RMT approach.
ACKNOWLEDGMENTS
O. Hassouneh acknowledges the University of Jordan for financial support. H. W. H acknowledges financial support from UK EPSRC under Grant No. G/055416/1, and A. C. B support from DEL under the programme for government.
References
- (1) P. Agostini, F. Fabre, G. Mainfray, G. Petite, N. K. Rahman, Phys. Rev. Lett. , 1127 (1979).
- (2) K. Zhao, Q. Zhang, M. Chini, Y. Wu, X. Wang, and Z. Chang, Opt. Lett. , 3891 (2012).
- (3) P. M. Paul, E. S. Toma, P. Breger, G. Mullot, F. Augé, P. Balcou, H. G. Muller, and P. Agostini, Science , 1689 (2001).
- (4) M. Hentschel, R. Kienberger, C. H. Spielmann, G. A. Reider, N. Milosevic, T. Brabec, P. Corkum, U. Heinzmann, M. Drescher, and F. Kraus, Nature Phys. , 414 (2001).
- (5) M. Schultze et al., Science , 328 (2010).
- (6) K. Klunder et al., Phys. Rev. Lett. , 143002 (2011).
- (7) M. Drescher et al., Nature , 803(2002).
- (8) M. Uiberacker et al., Nature , 627(2007).
- (9) A. L. Cavalieri et al., Nature , 1029(2007).
- (10) S. Baker, J. S. Robinson, C. A. Haworth, H. Teng, R. A. Smith, C. C. Chirilva, M. Lein, J. W. G. Tisch, and J. P. Marangos, Science, , 424 (2006).
- (11) H. J. Wörner, J. B. Bertrand, D. V. Kartashov, P. B. Corkum, and D. M. Villeneuve, Nature, , 604 (2010).
- (12) H. J. Wörner, J. B. Bertrand, P. B. Corkum, and D. M. Villeneuve, Phys. Rev. Lett. , 103002 (2010).
- (13) P.B. Corkum, Phys. Rev. Lett. , 1994 (1993).
- (14) A. D. Shiner, B. E. Schmidt, C. Trallero-Herrero, H. J. Wörner, S. Patchkovskii, P. B. Corkum, J.-C. Kieffer, F. Légaré , and D. Villeneuve, Nature Phys. , 464 (2011).
- (15) S. Pabst, L. Greenman, D. A. Mazziotti, and R. Santra, Phys. Rev. A , 023411 (2012).
- (16) A. Sytcheva, S. Pabst, S.-K. Son, and R. Santra, Phys. Rev. A , 023411 (2012).
- (17) A. C. Brown, S. Hutchinson, M. A. Lysaght, and H. W. van der Hart, Phys. Rev. Lett. , 063006 (2012).
- (18) A. C. Brown, D. J. Robinson, and H. W. van der Hart, Phys. Rev. A , 053420 (2012).
- (19) J. M. Ngoko Djiokap and A. F. Starace, Phys. Rev. A , 013404 (2011)
- (20) M. A. Lysaght, H. W. van der Hart, and P. G. Burke, Phys. Rev. A , 053411 (2009).
- (21) M. A. Lysaght, P. G. Burke, and H. W. van der Hart, Phys. Rev. Lett. , 193001 (2009).
- (22) E. S. Smyth, J. S. Parker, and K. T. Taylor, Comp. Phys. Commun. , 1 (1998).
- (23) A. C. Brown and H. W. van der Hart, Phys. Rev. A , 063416 (2012).
- (24) A. C. Brown and H. W. van der Hart, Phys. Rev. A , 033419 (2013).
- (25) M. Zepf, B. Dromey, M. Landreman, P. Foster, and S. M. Hooker, Phys. Rev. Lett. , 143901 (2007).
- (26) E. A. Gibson, A. Paul, N. Wagner, R. Tobey, S. Backus, I. P. Christov, M. M. Murnane, and H. C. Kapteyn, Phys. Rev. Lett. , 033001 (2004).
- (27) C.-G. Wahlström, J. Larsson, A. Persson, T. Starczewski, S. Svanberg, P. Salières, P. Balcou, and A. L’Huillier, Phys. Rev. A , 4709 (1993).
- (28) P. G. Burke, R-Matrix Theory of Atomic Collisions, (Springer Verlag, Heidelberg, 2011), Volume 61, XVIII, 746 p.
- (29) J. C. Baggesen and L. B. Madsen, J. Phys. B: at Mol. Opt. Phy. , 115601 (2011) (+references therein).
- (30) C. Roetti and E. Clementi, Chem. Phys. , 3342 (1974).
- (31) A. E. Kramida, Y. U. Ralchenko, J. Reader, and NIST ASD Team. NIST atomic spectra database, (ver 5.0). http://physics.nist.gov/asd.
- (32) M. Lewenstein, Ph. Balcou, M. Yu. Ivanov, A. L’Huillier, and P. B. Corkum, Phys. Rev. A , 2117 (1994).
- (33) O. Smirnova and M. Yu. Ivanov, Attosecond and XUV Physics, (edited by T. Schulz and M. Vrakking, Wiley VCH, 2013), pp 214-220.
- (34) L. R. Moore, M. A. Lysaght, J. S. Parker, H. W. van der Hart, and K. T. Taylor, Phys. Rev. A , 061404 (2011).