Spatiotemporal correlations between plastic events in the shear flow of athermal amorphous solids
Abstract
The slow flow of amorphous solids exhibits striking heterogeneities: swift localised particle rearrangements take place in the midst of a more or less homogeneously deforming medium. Recently, experimental as well as numerical work has revealed spatial correlations between these flow heterogeneities. Here, we use molecular dynamics (MD) simulations to characterise the rearrangements and systematically probe their correlations both in time and in space. In particular, these correlations display a four-fold azimuthal symmetry characteristic of shear stress redistribution in an elastic medium and we unambiguously detect their increase in range with time. With increasing shear rate, correlations become shorter-ranged and more isotropic. In addition, we study a coarse-grained model motivated by the observed flow characteristics and challenge its predictions directly with the MD simulations. While the model captures both macroscopic and local properties rather satisfactorily, the agreement with respect to the spatiotemporal correlations is at most qualitative. The discrepancies provide important insight into relevant physics that is missing in all related coarse-grained models that have been developed for the flow of amorphous materials so far, namely the finite shear wave velocity and the impact of elastic heterogeneities on stress redistribution.
pacs:
83.60.La Viscoplasticity; yield stress and 83.10.BbKinematics of deformation and flow and 83.10.RsComputer simulation of molecular and particle dynamics1 Introduction
When a simple liquid is sheared, it flows homogeneously, and its flow is traditionally viewed as a uniform slide of vanishingly thin layers of fluids past each other. On the other hand, if shear is applied to an amorphous solid, the response of the material is highly heterogeneous, in that small regions rearrange rapidly while the rest of the material responds elastically, in a more or less affine way Argon1979 ; Schall2007 . In extreme cases, the material may fracture Shimizu2006 ; Furukawa2009b ; Leocmach2014 ; Bonamy2011 ; the shear strain is then entirely borne by a thin layer of matter which has lost its internal cohesion. Material fracture is the most acute case of shear localisation, whereby the deformation is localised in one region of the system. The occurrence of this phenomenon rules out the study of the flow from a homogeneous perspective. But, even when sheared amorphous solids do not exhibit permanent shear localisation, there is growing evidence of the existence of correlations between the localised rearranging regions (referred to as plastic events in the following), that is, of a spatial organisation of the flow at intermediate time scales: In Ref.Chikkadi2012a , Chikkadi and co-workers observed a colloidal glass with confocal microscopy and demonstrated that the non-affine displacements in the material were spatially correlated, prior to any shear-banding instability, while Mandal, Varnik, and colleagues Mandal2013b ; Varnik2014 supported such experimental findings with numerical simulations. The observed correlations are interpreted as the effect of the long-range elastic deformation field induced by a plastic event in the material, at the origin of avalanches of plastic events. In a uniform linear elastic medium, this field is quadrupolarEshelby1957 ; Picard2004 , viz., for a plastic event occurring at the origin, in two dimensions.
Predicting exactly where the next plastic event will occur in the material is an intricate task that is bound to depend sensitively on detailed knowledge of the current, static configuration of the systemWidmer-Cooper2008 ; Tsamados2009 ; Brito2009 ; Tanguy2010 ; Manning2011 . Alternatively, one may choose to investigate to what extent the position of the next plastic event is influenced by that of its predecessors, in the hope that extensive information about the dynamical organization of the flow will thus be revealed. The characterisation of such correlations between plastic events is the objective of this work. Although our tools will be slightly different, we note that similar studies have appeared in two recent publications. In Chattoraj2013 , long-lived correlations of the local strain field observed in molecular dynamics (MD) simulations were taken as evidence of the importance of localised plastic events in a flowing liquid. In Benzi2014 , similar correlations were observed in a numerical model of a dense emulsion undergoing shear flow between solid plates.
In this work, we will concentrate on a numerical study of the flow of a very simple amorphous solid in the athermal limit. We will propose a detailed description of the plastic events and their dynamical correlations, resolved both in space and time. The influence of the applied shear rate is studied. In order to ascertain the origin of the prominent features of the correlations, we investigate a coarse-grained model closely connected to the observed flow phenomenology in complement to the atomistic simulations.
The article is structured as follows: In Section 2, we provide the reader with the technical details pertaining to the MD simulations, and present the observable that will be used to measure the local rearrangements. In Section 3, we report the general properties of the simulated flow, with a particular focus on the statistics of individual plastic events. On the basis of these observations, a coarse-grained model is presented in Section 4 and the general agreement of the model with the atomistic simulations is immediately assessed. Finally, Section 5 is dedicated to our main contribution, namely, a detailed study of the spatiotemporal correlations between successive plastic events and the interpretation of their salient features.
2 Atomistic simulations at zero temperature
To probe the flow properties of amorphous solids, we resort to MD simulations of an amorphous system under shear. More precisely, we simulate a binary mixture of A and B particles, with and , of respective diameters and , confined in a square box of dimensions , with periodic boundary conditions. The system is at reduced density 1.2. The particles, of mass , interact via a pairwise Lennard-Jones potential,
| (1) |
where , ,, , and . The potential is truncated at and shifted for continuity. Simple shear is imposed at rate by deforming the box dimensions and remapping the particle positions.
We conduct our study in the athermal limit, by thermostating the system to a zero-temperature, so that no fluctuating force appears in the equations of motion, viz.,
| (2) | |||||
| (3) |
where are the momentum and position of particle in the deforming frame.
Besides the interparticle forces, the motion of particle i is subject to a damping force , that models friction against solvent molecules in a mean-field way. Here, is the Langevin damping time. The relevance of this specific implementation of friction shall be discussed in Section 5.4. Equations 3 are integrated with the velocity Verlet algorithm with . In all the following, we use as the unit of time and as the unit of length.
To obtain the initial glassy states, we quenched the system at constant volume from the liquid state down to zero temperature at a fast rate. Note that, before any data were collected, the system was always pre-sheared for to ensure that the steady state had been reached.
3 Macroscopic rheology & Statistics of plastic events
In this section, we analyse the global rheology of the system and collect evidence in support of the general scenario of plastic events embedded in an elastic medium outlined in the introduction. We will also characterize plastic events at a statistical level.
3.1 Flow curve
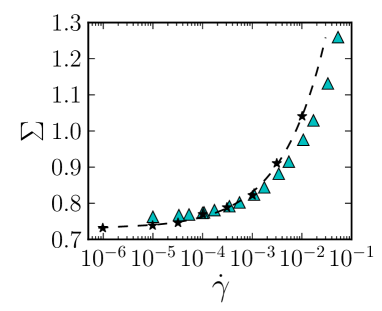
The dependence of the macroscopic shear stress on the applied shear rate is shown in Fig.1; it is well described by the Herschel-Bulkley law . Regarding the bulk mechanical properties of the system, plotting the stress as a function of strain at a given shear rate yields a shear modulus for the system (prior to deformation) and a macroscopic yield strain of order 5-10%.
3.2 Stress autocorrelation function
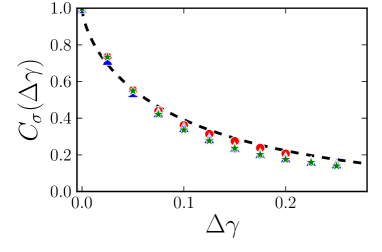
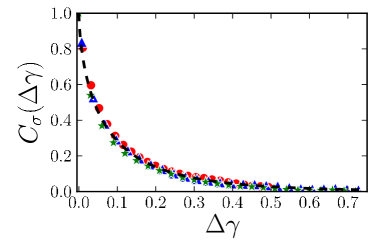
Turning to more local quantities, in Fig.2(top panel) we plot the autocorrelation function
| (4) |
of the local shear stress fluctuations experienced by each particle. The averages are performed over time. We observe a nice collapse of the data for the different shear rates. This confirms that the applied strain , and not the absolute time , causes the decorrelation in this driven athermal system, in line with the idea of periods of elastic accumulation of stress interspersed with shear-induced plastic events. The master curve is fairly well fit by a stretched exponential , with an exponent and a characteristic strain close to the macroscopic yield strain.
3.3 Indicator of plastic activity
Let us now focus on plastic events. In order to detect them, we make use of the quantity presented by Falk and Langer in Ref. Falk1998 , which evaluates deviations from an affine deformation on a local scale. This quantity has been used with noted success to characterize plasticity Falk1998 ; Chikkadi2011 ; Chikkadi2012a ; Chikkadi2012b ; Mandal2013b ; Varnik2014 ; Keim2014 ; in particular, it was shown to yield results consistent with other measures of nonaffinity in Ref. Chikkadi2012b . is defined locally, around a particle labelled i, as the minimum over all possible linear deformation tensors of
where the sum runs over all neighbours of , and denotes the identity matrix. The value of the time lag was fine-tuned to provide a good signal over noise ratio while still being short enough to allow a temporal resolution of the plastic events. Figure 3 presents a snapshot of values in the system: one clearly sees localised plastic regions embedded in an affinely-deforming medium. To provide a more dynamical view of the flow, short movies are available as Supplementary Material Supp-mat , along with their counterparts for the coarse-grained model presented in the next section.
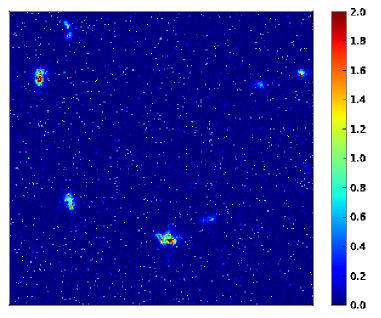
Interestingly, the regions with large systematically coincide with the regions exhibiting large velocities relative to the average solvent flow. This coincidence between the non-locally-affine displacement field and the singular velocity confirms that large local energy dissipation is the hallmark of a plastic event.
3.4 Distribution of durations, magnitudes, and sizes of individual plastic events
We now study the properties of individual plastic events in more detail. First, by scrutinising a number of snapshots such as the image presented in Fig.3, we observe that the size of plastic regions is typically a few particle diameters; this size does not depend dramatically on the shear rate. This point will be confirmed in Section 5 by a detailed analysis of the spatial correlations of the field.
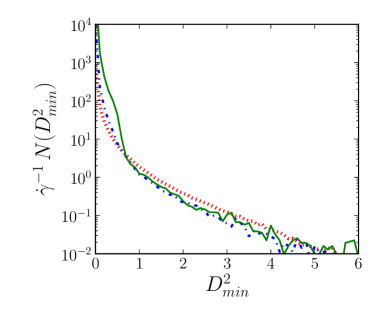
Further insight is gained by computing the overall distribution of the measured values in Fig.4. All distributions exhibit an exponential tail, and they furthermore collapse upon rescaling with the inverse shear rate.
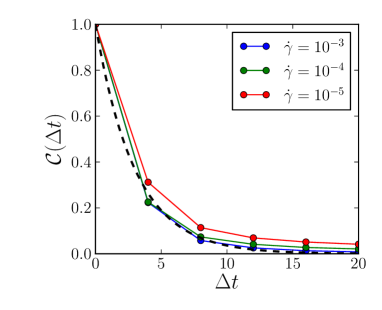
Finally, the typical lifetime of a plastic event can be extracted from the temporal decay of the autocorrelation function plotted in Fig.5. For the value of the damping time used in this study, it is of the order of 3 time units regardless of the shear rate.
4 Generic coarse-grained model
4.1 Description of the model
The numerical observations reported above all support the flow scenario based on short-lived, localised, and strongly dissipative plastic events embedded in an elastic matrix. Accordingly, we shall now introduce a simple, 2D coarse-grained model for the rheology of athermal amorphous solids that is motivated by these observations.
To start with, we discretise space into a lattice of square-shaped elastoplastic blocks, each of the size of a rearranging region. By default, blocks are elastic, in which case the (tensorial) deviatoric stress and strain tensors carried by each block obey Hooke’s law, viz.,
| (5) |
where is the shear modulus. Here, we have postulated incompressibility, i.e., . Plasticity is incorporated into the model by allowing blocks to yield (i.e., switch to the plastic state) as soon as the following yield criterion is fulfilled,
| (6) |
where is a fixed local yield stress, associated to an energy barrier . Equation 6 is simply the well-known von Mises yield criterion111Note that the von Mises and the Tresca yield criteria are equivalent in two dimensions.. Every time a block yields, the value of is renewed; it is randomly selected from a truncated exponential distribution,
| (7) |
where is the Heaviside function. The coefficient is chosen such that the average of the yield strain over coincides with the MD macroscopic yield strain, . The introduction of a lower threshold in Eq.7 comes down to discarding too shallow metabasins in the potential energy landscape (PEL) of the subsystem modelled as an elastoplastic block.
A plastic block is a fluid-like inclusion embedded in an elastic region. The implications of this fact are twofold. First, the plastic rearrangement occurs, not instantaneously, but over a finite time scale , because viscous forces oppose itNicolas2013b . Second, the associated distortion of the plastic region induces an additional stress in the surrounding elastic mediumEshelby1957 . The combination of these two effects occurring in plastic blocks, along with Eq.5 for the elastic regions, leads to,
| (8) |
Here, if the block is plastic, otherwise. is the local viscous time, and the propagator is such that is the stress increment received by block if the block endures a plastic strain . Note in particular that has negative eigenvalues, because plastic blocks relax the stress they bear. More generally, the propagator was calculated rigorously in the limit of a pointwise inclusion in a perfectly homogeneous elastic medium. Its expression and the way it must be altered when simulation cell is deformed are specified elsewhereNicolas2014u . Obviously, the first term on the right hand side of Eq.8 contains the elastic response to the macroscopic driving and follows directly from Eq.5, while the second term deals with the effects of plasticity.
The swift rearrangement of particles that characterises a plastic event corresponds to a jump between metabasins in the PELDoliwa2003 . In our model, it shall come to an end when a given strain has been cumulated locally in the plastic phase, i.e., when
| (9) |
where the total local deformation reads, . represents the typical distance between metabasins, which clearly depends on how much the PEL has been coarse-grained, that is, on . For simplicity, we arbitrarily take . Following this simplification, is the only free parameter in the model, if one excepts the time and stress units and .
To sum up, the transitions between the elastic and plastic regimes obey,
| (10) |
Finally, a coarse-grained version of convection is introduced in the system by incrementally shifting lines of blocks in the flow direction. For this purpose, we keep track of the exact average displacement of each of these ’streamlines’ along the flow direction, and shift the whole line once the displacement gets larger than the size of one block. The implementation of convection also requires to compute the elastic propagator in a deformed frameNicolas2014u .
4.2 Comparison of general features with the atomistic simulations
Figure 1 presents a comparison of the flow curves obtained with the coarse-grained model and with the atomistic simulations. Note that, to allow direct comparison, the time and stress units in the model must be specified. A reasonably good agreement between the flow curves is obtained by setting the shear modulus to 12.5, a value comparable to the shear modulus of the atomistic system prior to deformation (), and , which will lead to similar plastic event life times in the MD and coarse-grained simulations. The best fits of the flow curves with Herschel-Bulkley equations have very similar exponents .
To quantify the global plasticity of the system, we compute the instantaneous surface density of plastic events, i.e., the fraction of blocks which are plastic at a given time. In the absence of thermally-activated plastic events, this quantity increases linearly with the shear rate, from 0.05% at to 0.36% at and 2.8% at . These values are similar to those obtained from the atomistic simulations by integrating the tails of the distributions, in Fig.4, down to a reasonable (but arbitrary) lower threshold: 0.07%, 0.3%, and 0.8%, respectively.
Turning to a more local viewpoint, the autocorrelation function of the stress fluctuations on a given block are shown in panel (b) of Fig.2. As in the MD simulations, the autocorrelations at different strain rates collapse onto a master curve. Interestingly, this master curve is fitted by a stretched exponential, , with a stretching exponent very close to the one used to fit the MD data (), although the precise value of the characteristic strain obtained here, , differs by 50%.
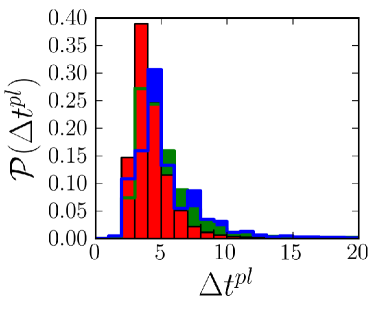
The average life time of a single plastic event in the model is of order a few (remember that we set to 1.5) at all shear rates. More precisely, a noticeable decrease of the average life time is observed as the shear rate is increased, from at to at . This is not unexpected, because the criterion determining the duration of a plastic event, Eq.9, involves the total local deformation rate. Indeed, the distributions of plastic event life times, shown in Fig.6, undergo a small, but noticeable shift to shorter times at higher shear rates.
Since we introduced a cut-off in the yield stress distribution (see Eq.7), the distribution of plastic event magnitudes will naturally differ from that observed in the atomistic simulations. Nevertheless, this distribution is still roughly independent of the applied shear rate (data not shown).
5 Correlations between plastic events
Having verified the agreement of the coarse-grained model with the atomistic simulations with regard to the general flow properties, we can now move on to the study of the correlations in the flow.
5.1 Plastic correlator
The individual localised rearrangements identified in Section 3.3 are not random isolated events: in the athermal, quasi-static limit, Maloney and Lemaître Maloney2004 showed numerically that they are essentially organised in strongly correlated avalanches. By investigating the transverse particle diffusivity, Lemaître and colleagues then showed that these correlations persist at finite shear rates Lemaitre2009 and at finite temperatures Chattoraj2010 ; Chattoraj2011 . The spatial structure of these correlations was revealed by Chikkadi, Mandal, Varnik, et al. Chikkadi2012a ; Mandal2013b ; these researchers provided convincing experimental and numerical evidence that the correlations between flow heterogeneities, quantified by , are long-ranged and all the more anisotropic as shear prevails over thermal effects, i.e., at larger Peclet numbers. To do so, they monitored particle displacements in a driven “hard sphere” colloidal glass with confocal microscopy and were able to reproduce their experimental observations qualitatively with MD simulations. Quantitatively, some discrepancies were found between simulations and experiments, the latter displaying longer correlations, with a power law decay in space.
Here, we purport to extend these studies and unveil the full dynamical picture by resolving correlations between the plastic events both in time and in space, for different shear rates, in the athermal regime. The emphasis shall then be put on the causal links that exist between successive plastic events. To this end, we use the following two-time, two-point plastic correlator,
where the brackets denote an average over time , the bars represent an average over spatial coordinate , and the prefactor is chosen such that . Clearly, measures the (enhanced or reduced) likelihood that a plastic event occurs at if a plastic event was active at position some prescribed time ago. In the coarse-grained simulations, a sensible equivalent is,
| (12) | |||||
where if the block at position is plastic at time , otherwise, and is, again, a normalisation prefactor.
5.2 Decay of the intensity of the correlation with time
Plastic correlations naturally fade away with time, but one may wonder whether their decay is more appropriately described in terms of the absolute time or the strain . Quite interestingly, in the atomistic simulations as well as in the coarse-grained model, absolute time turns out to be the adequate unit of measurement, as evidenced by comparing the evolution of the correlations at different shear rates.
It should be pointed out that this does not conflict with the decay of stress correlations as a function of the strain. Stress correlations exist during the loading phase preceding the shear transformation, whose duration is typically determined by the yield strain. On the other hand, the duration of the plastic activity phase is mostly determined by the local damping time, and is only weakly dependent on strain rate. Correlations in plastic activity are therefore expected on the time scale on a single event, or on somewhat longer time scales in the event of correlated avalanches, but they will remain limited to finite times even for vanishingly small applied strain rates.
5.3 Maps of plastic correlations at various shear rates
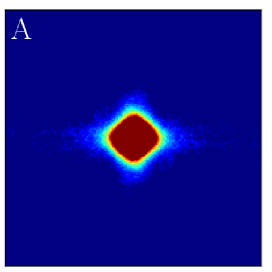
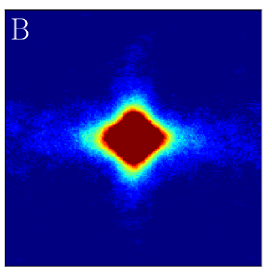
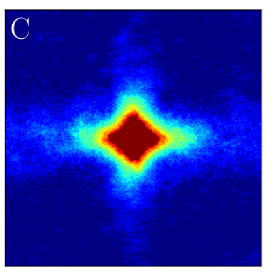
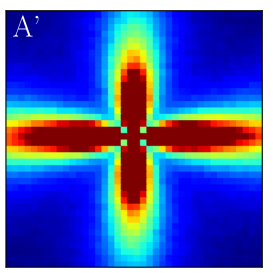
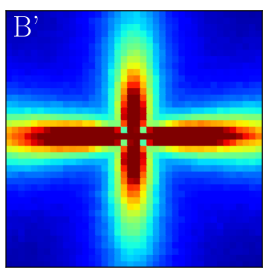
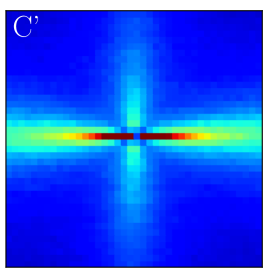
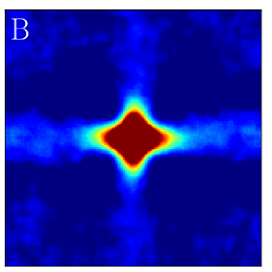
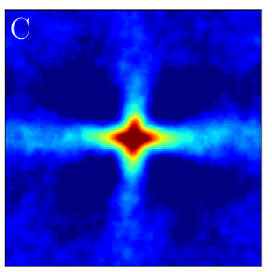
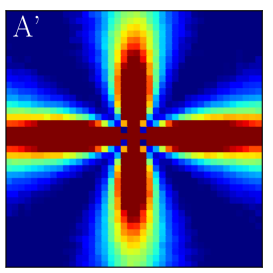
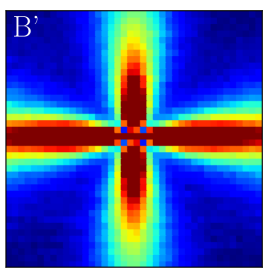
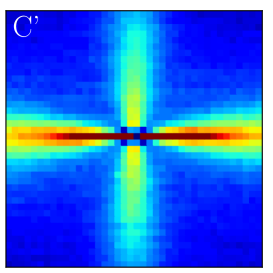
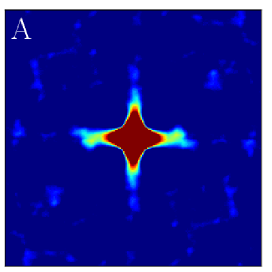
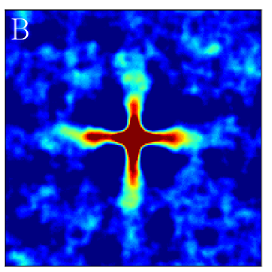
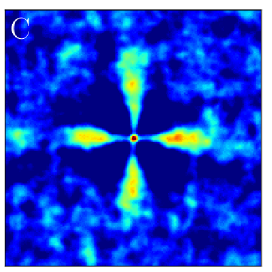
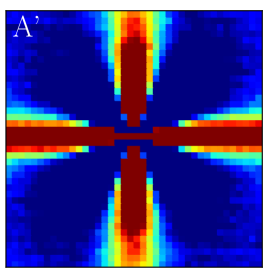
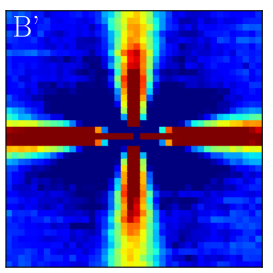
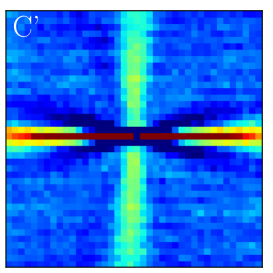
The plastic correlations obtained in the atomistic simulations are shown in Fig.7, 8, and 9 at different time lags for three distinct shear rates: , , and . The counterparts for the coarse-grained simulations are presented directly opposite to them so as to allow an easy comparison, but they will only be discussed below in section 5.4.
The presence of a spatial structure in the correlations is manifest, which is strong evidence that plastic rearrangements are indeed interdependent, and not fully isolated events. The positive correlations in the streamwise and crosswise directions are strongly reminiscent of the positive lobes of the elastic propagator , which supports the idea of interactions via an elastic coupling. In diagonal directions, there tend to be anticorrelations. The (anti)correlations decay gradually, over approximately the same (absolute) time scale as the autocorrelation function, i.e., their value at the origin. These features are common to the various shear rates studied here.
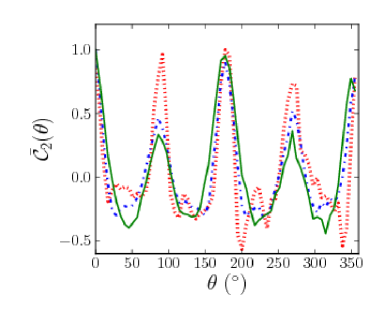
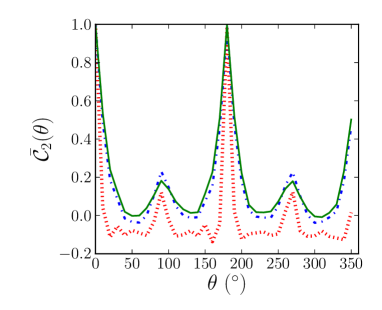
A closer investigation of the plots shows that the decay time tends to decrease with increasing shear rate, thereby reflecting the shear-induced decorrelation of the system, with sequences of correlated events being cutoff by the deformation. Moreover, while the streamwise and crosswise lobes are hardly distinguishable at high shear rates, at lower shear rates there is clearly an asymmetry between them. The propensity to shear localisation of the plastic activity is therefore enhanced at lower shear rates. This is more visible in Fig.10(top panel), where the correlations are integrated along the radial direction in different directions. An enhanced propensity to shear localisation, or, more generally, flow heterogeneities, with decreasing shear rates has already been reported in the literature Picard2005 ; Martens2012 ; Divoux2011 , although, here, some artifact associated with the use of periodic boundary conditions and finite size effects cannot be excludedChattoraj2013 . An additional effect of the shear rate is that the anticorrelated lobes in the diagonal directions appear stronger at higher shear rates.
To assess the strength of the correlations, that is, to what extent they deviate from a random distribution of plastic events, we compare the probabilities that two plastic events, separated by a distance and a time lag , are aligned, on the one hand, along the velocity gradient direction and, on the other hand, along the diagonal direction with respect to the macroscopic shear. We observe an enhancement of the probabilities of streamwise alignment (versus diagonal alignement) by about 10% to 20%. Details are provided in Fig.12 in the Appendix.
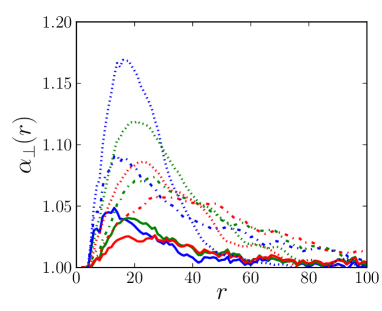
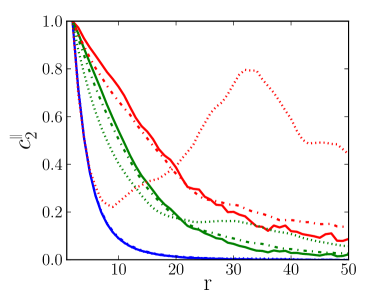
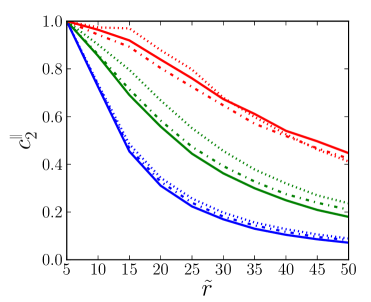
We now turn to the spatial extent of the correlations. In the top panel of Fig.11, we show how they decay along the flow direction, for distinct time lags. The decay, which is not purely exponential, depends only weakly on the shear rate, except at long time lags. Besides, it spreads over larger and larger distances as the time lag is increased; it should however be noted that the correlations have been rescaled so as to be equal to unity close to the origin at all time lags, so that a slower spatial decay does not necessarily imply a larger absolute value far from the origin. This rescaling also entails that small fluctuations will be magnified when the correlations near the origin are small, e.g., for the long time lag , notably in the moderately high shear rate case.
At this stage, we should mention a very recent study by Varnik and co-workers Varnik2014 , who reported that the spatial decay of the correlations was highly contingent on the specific implementation of the friction force in the equations of motion 222Note that, although these researchers have computed nominally “static” correlations, that is to say, at , the time which they used to compute is very large, so that their data actually correspond to an integral of our dynamical correlations over a wide range of time lags .). More precisely, only a friction force based on the relative velocity of a particle with respect to its neighbours (“contact dynamics”) could reproduce the power law decay observed in experiments on colloidal suspensions and immersed granular matter, whereas a mean-field dissipation scheme predicted a faster, exponential decay. The effect of the specific implementation of the frictional force has been the subject of a wider debate: Tighe et al.Tighe2010 , for instance, reported that using a friction term based on relative particle displacements is key to finding suitable correlation functions in the vicinity of the jamming point, while Vagberg et al.Vagberg2013 claimed that a critical behaviour is found with both schemes. Here, we have used a mean-field friction force; accordingly, some quantitative discrepancies may be expected between the extent of the correlations that we have found and those measured in the experimental setups of Ref. Chikkadi2012a ; Varnik2014 . However, our choice of friction force is, arguably, the more adequate one for confined two-dimensional geometries in which particles slide along a fixed plate, for instance, bubble rafts confined in between parallel glass plates Debregeas2001 .
5.4 Successes and limitations of the coarse-grained model
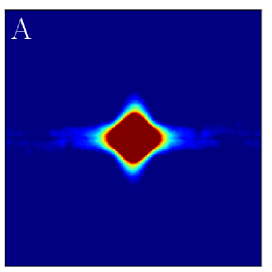
In Section 4.2, we have seen that the coarse-grained model gives a rather satisfactory description of the macroscopic properties, as well as the local ones. Here, we enquire how well it fares with respect to the full set of spatiotemporal correlations. As shown in Figs.7 through 9, the correlation maps for the two models do bear some resemblance, but closer inspection reveals quantitative differences.
Among the satisfactory aspects, the coarse-grained model also indicates a decay of the correlations with absolute time and correlations display a four-fold angular symmetry. By comparing the top and bottom panels of Fig.10, we find reasonable agreement for the angular dependence of the correlations. One should however admit that excessive correlations are predicted along the flow direction, especially in the near field. This is an artifact associated with the use of a regular lattice: as the frame is deformed, the positive lobe of the elastic propagator in the flow direction remains aligned with one axis of the lattice, while the alignment of the perpendicular lobe with the other axis is lost. Moreover, the coarse-grained simulations are able to describe the anti-correlated lobes in the diagonal directions and their enhancement at higher shear rates.
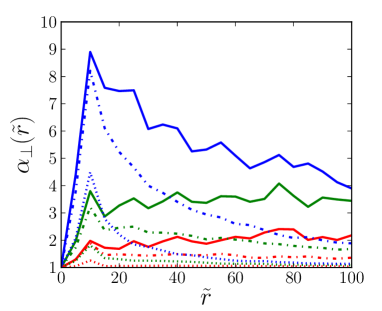
On the downside, it is obvious that salient features of the plastic correlations are amiss. This discrepancy is interesting, because it is a hint that plastic correlations reveal some physical processes that may otherwise be left unnoticed, and that these processes have been omitted in the model. First, the gradual growth with time of the correlations observed in MD is in stark contrast with the maximal extent of the correlations at vanishing time lag in the coarse-grained model, as can be seen in Fig.11(bottom panel). Indeed, within a short time lag , the mesoscopic model builds up correlations over a characteristic distance of order 20, while these quasi-instantaneous correlations do not extend beyond a few unit lengths in the MD simulation. This indicates that the MD correlations do not grow because more and more shear stress is redistributed as the rearrangement proceeds, but because shear waves need a finite time to propagate (whereas instantaneous equilibration was assumed in the model). In other words, the acoustic delay for the propagation of strain-waves within an avalanche slows down the emergence of spatial correlations. Indeed, the initial growth of the correlations is consistent with the propagation of shear waves at the transverse sound velocity (of the undamped system), viz., . The gradual expansion of the strain field created by a plastic event is studied in more details in the companion paper, Ref.Puosi2014 , and in Ref.Idema2013 ; Chattoraj2013 . Note that, in this last reference, the authors also observed some advanced frontline moving at the longitudinal sound velocity .
The second major difference lies in the spatial extent of the correlations, which is much larger in the coarse-grained approach. Had a frictional force based on relative velocities been used, MD may have yielded larger correlations, as suggested by ref.Varnik2014 . However, the large deviation between the predictions of the atomistic and coarse-grained models does point to an additional source of discrepancy. We believe that the underestimation of structural disorder in the coarse-grained model is at the core of the divergence. Indeed, broadening the distribution of energy barriers in the model results in somewhat shorter correlations, at the expense of a poorer fitting of the macroscopic flow properties by our essentially one-parameter model. Of probably equal relevance is the use of an ’ideal’ elastic propagator. This propagator describes stress redistribution in a perfectly uniform elastic medium. Such a description is justified on average, but is inaccurate for a specific plastic eventPuosi2014 , because elastic heterogeneities in the surrounding medium, i.e., the spatial variations of the local elastic constants, induce deviations from the ideal case. The insufficient account of structural disorder in the model is also reflected in the vastly overestimated anisotropy of the correlations that it predicts, as measured by the directional probability enhancement (see the bottom panel of Fig.12 in the Appendix).
6 Summary and outlook
In conclusion, we have reported numerical simulations that confirm the basic flow scenario for amorphous solids, based on swift localised rearrangements embedded in an elastic matrix and interacting via an elastic deformation field. A coarse-grained model based on this simple scenario satisfactorily reproduces the measured flow curve, the surface density of simultaneous plastic events, and the decay of the stress autocorrelation function.
To obtain full insight into the dynamical organisation of flow heterogeneities, we have probed the spatio-temporal correlations between plastic events, and their dependence on the shear rate. As already reported in the literature, these correlations are perceivably anisotropic and exhibit the four-fold angular symmetry characteristic of the elastic propagator. These correlations spread approximately at the transverse sound velocity before fading away. Varying the shear rate only brings on small changes to the general picture: at higher shear rates, the near-field anticorrelations along the diagonal directions seem to be slightly more pronounced, and the velocity and velocity gradient directions are more symmetric. Besides, the spatial extent of the correlations tends to decrease with increasing shear rate.
A coarse-grained model is able to describe the observed symmetries of the correlations, but fails to reproduce their emergence in time, owing to the neglect of the finite shear wave velocity in the model. In addition, the model vastly overestimates the anisotropy in the correlations, thereby pointing to the underestimation of structural disorder in the system, at least partly because of the use of an ideal elastic propagator. These two flaws are not specific to the model used here, but a general deficiency of all approaches of this typeRodney2011 . Consequently, should one aim for a proper description of these correlations, these missing physical aspects will need to be incorporated into the models. To what extent they will alter the macroscopic flow properties predicted by the models, for instance the variable propensity to shear localisation, remains an open question. More generally, it seems likely that in the future the study of plastic correlations, as described in Ref. Chattoraj2013 ; Benzi2014 or in the present work, will become a powerful tool for comparison between models of various types and between models and experiments in systems in which the corresponding observables are experimentally accessible.
Acknowledgments The simulations were carried out using the LAMMPS molecular dynamics software333http://lammps.sandia.gov. JLB is supported by Institut Universitaire de France and by grant ERC-2011-ADG20110209. JR acknowledges support from Université Joseph Fourier and from Institut Laue Langevin during a stay in Grenoble.
References
- (1) A. Argon, H. Kuo, Materials Science and Engineering 39(1), 101 (1979).
- (2) P. Schall, D.A. Weitz, F. Spaepen, Science (New York, N.Y.) 318(5858), 1895 (2007).
- (3) F. Shimizu, S. Ogata, J. Li, Acta Materialia 54(16), 4293 (2006).
- (4) A. Furukawa, H. Tanaka, Nature Materials 8(7), 601 (2009).
- (5) M. Leocmach, C. Perge, T. Divoux, S. Manneville, arXiv preprint arXiv:1401.8234 (2014).
- (6) D. Bonamy, E. Bouchaud, Physics Reports 498(1), 1 (2011).
- (7) V. Chikkadi, S. Mandal, B. Nienhuis, D. Raabe, F. Varnik, P. Schall, EPL (Europhysics Letters) 100(5), 56001 (2012).
- (8) S. Mandal, V. Chikkadi, B. Nienhuis, D. Raabe, P. Schall, F. Varnik, Physical Review E 88(2), 022129 (2013).
- (9) F. Varnik, S. Mandal, V. Chikkadi, D. Denisov, P. Olsson, D. Vågberg, D. Raabe, P. Schall, arXiv preprint arXiv:1401.3986 (2014).
- (10) J.D. Eshelby, Proceedings of the Royal Society A: Mathematical, Physical and Engineering Sciences 241(1226), 376 (1957).
- (11) G. Picard, A. Ajdari, F. Lequeux, L. Bocquet, The European Physical Journal. E, Soft matter 15(4), 371 (2004).
- (12) A. Widmer-Cooper, H. Perry, P. Harrowell, D.R. Reichman, Nature Physics 4(9), 711 (2008).
- (13) M. Tsamados, A. Tanguy, C. Goldenberg, J.L. Barrat, Physical Review E 80(2) (2009).
- (14) C. Brito, M. Wyart, The Journal of Chemical Physics 131(2), 024504 (2009)
- (15) A. Tanguy, B. Mantisi, M. Tsamados, EPL (Europhysics Letters) 90(1), 16004 (2010).
- (16) M.L. Manning, A.J. Liu, Physical Review Letters 107(10), 108302 (2011).
- (17) J. Chattoraj, A. Lemaître, Physical Review Letters 111(6), 066001 (2013).
- (18) R. Benzi, M. Sbragaglia, P. Perlekar, M. Bernaschi, S. Succi, F. Toschi, ArXiv e-prints (2014), 1402.4441
- (19) M. Falk, J. Langer, Physical Review E 57(6), 7192 (1998).
- (20) V. Chikkadi, G. Wegdam, D. Bonn, B. Nienhuis, P. Schall, Physical Review Letters 107(19), 198303 (2011).
- (21) V. Chikkadi, P. Schall, Physical Review E 85(3), 031402 (2012).
- (22) N.C. Keim, P.E. Arratia, Physical Review Letters 112(2), 028302 (2014).
- (23) Supplementary material is available online.
- (24) A. Nicolas, J.L. Barrat, Faraday Discuss. 167(1), 567 (2013).
- (25) A. Nicolas, K. Martens, L. Bocquet, J.L. Barrat, arXiv preprint arxiv:1402.4655 (2014).
- (26) B. Doliwa, A. Heuer, Physical Review E 67(3), 031506 (2003).
- (27) C. Maloney, A. Lemaître, Physical Review Letters 93(1), 016001 (2004).
- (28) A. Lemaître, C. Caroli, Physical Review Letters 103(6), 065501 (2009)
- (29) J. Chattoraj, C. Caroli, A. Lemaître, Physical Review Letters 105(26), 266001 (2010).
- (30) J. Chattoraj, C. Caroli, A. Lemaître, Physical Review E 84(1), 011501 (2011).
- (31) G. Picard, A. Ajdari, F. Lequeux, L. Bocquet, Physical Review E 71(1), 010501 (2005).
- (32) K. Martens, L. Bocquet, J.L. Barrat, Soft Matter 8(15), 4197 (2012).
- (33) T. Divoux, C. Barentin, S. Manneville, Soft Matter 7(18), 8409 (2011).
- (34) B.P. Tighe, E. Woldhuis, J.J.C. Remmers, W. van Saarloos, M. van Hecke, Physical Review Letters 105(8), 088303 (2010).
- (35) D. Vågberg, P. Olsson, S. Teitel, arXiv preprint arxiv:1312.5158 (2013).
- (36) G. Debregeas, H. Tabuteau, J.M. Di Meglio, Physical Review Letters 87(17), 178305 (2001).
- (37) F. Puosi, J. Rottler, J.L. Barrat, arXiv preprint arxiv:1402.1474 (2014).
- (38) T. Idema, J.O. Dubuis, L. Kang, M.L. Manning, P.C. Nelson, T.C. Lubensky, A.J. Liu, arXiv preprint arxiv:1304.4025 (2013).
- (39) D. Rodney, A. Tanguy, D. Vandembroucq, Modelling and Simulation in Materials Science and Engineering 19(8), 083001 (2011).
Quantification of the anisotropy of the correlations
To assess the strength of the anisotropy in the plastic correlations, we compute the directional probability enhancement factor , viz.,
| (13) |
where and are the velocity gradient and diagonal directions, respectively. This factor measures the ratio of the probabilities that two plastic events, separated by in distance and in time, will be aligned along the velocity gradient direction versus diagonally. Figure 12 compares this enhancement ratio for the MD model and the coarse-grained model.